-
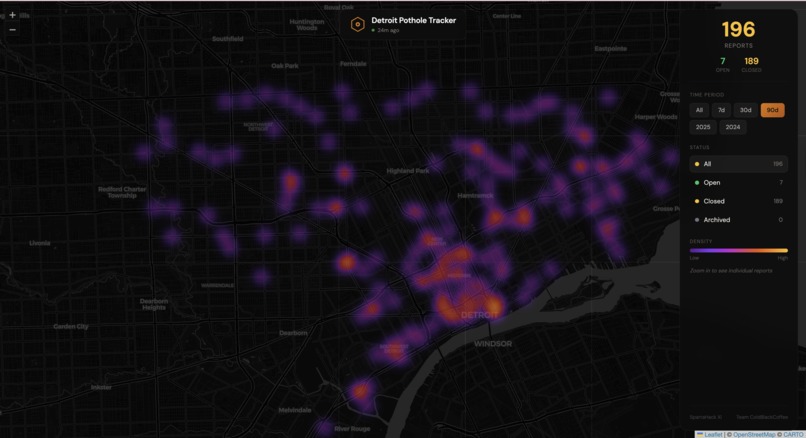
Interactive heatmap showing pothole density across Detroit, with filters for time and status. Brighter spots indicate more reported issues.

Inspiration
Detroit residents report thousands of potholes every year through the Improve Detroit 311 system, but that data sits in spreadsheets most people never see. We wanted to turn those numbers into something visual and actionable, a heatmap that shows exactly where the city's roads need attention. As MSU students driving Michigan roads, we've felt the problem firsthand. The SpartaHack "Roots & Renewal" track was the perfect fit for a project about infrastructure renewal in a city that's rebuilding.
What it does
Detroit Pothole Heatmap pulls live data from Detroit's open data portal and displays 26,000+ pothole reports as an interactive heatmap. Users can filter by status (Open, Closed, Acknowledged, Archived) and by date range to see how reports have changed over time. The map progressively builds as data streams in, showing real-time statistics as it loads. Hotspots glow brighter where reports cluster, making problem areas immediately obvious.
How we built it
We started with a Python/Streamlit approach but pivoted to Node.js and React when we realized that matched our team's strengths better. The backend uses Express.js with Server-Sent Events to stream pothole data in batches from Detroit's ArcGIS API. The frontend is React + Vite with Leaflet.js and the Leaflet.heat plugin for visualization. We implemented caching so repeat visits load instantly, and used progressive loading so users see the heatmap building in real-time rather than staring at a blank screen.
Challenges we ran into
Git was our biggest learning curve—divergent branches, merge conflicts, and figuring out when to rebase vs. reset. React Strict Mode caused a double-fetch bug that duplicated all our data until we tracked it down with useRef. Getting the heatmap layer to update when filters changed required properly removing and recreating the layer. We also spent time debugging why date filters showed blank maps before realizing we weren't passing the created_at field through from the API.
Accomplishments that we're proud of
This was our first hackathon and first time building a product as a team. We went from an empty repo to a working full-stack app that pulls live city data and renders it beautifully. The progressive loading animation, watching the heatmap build up batch by batch, turned a performance necessity into a feature that actually looks impressive. We also successfully navigated Git collaboration without losing anyone's work.
What we learned
We learned Git workflows the hard way: branching, pulling with rebase, and recovering from divergent branches. We learned about Server-Sent Events for streaming data to browsers, and React patterns like using useRef to prevent effects from running twice. Most importantly, we learned that pivoting early (from Python to Node.js) saved us time rather than costing it—use what your team knows.
What's next for Detroit Potholes Heatmap and Dashboard
We want to add neighborhood and council district filters so residents can focus on their area. A historical trends view would show whether pothole reports are increasing or decreasing over time. We'd also like to add response time analytics, how long does it take the city to close a report, and eventually predictive features that identify areas likely to develop problems based on patterns.
Built With
- axios
- detroit-open-data-portal
- esri
- javascript
- leaflet.heat
- leaflet.js
- node.js
- react
- server-sent-events
- vite.js
