Inspiration: Student financial stress often goes unnoticed until it starts affecting attendance and academic performance. I wanted to explore whether simple administrative data like fee payment delays and attendance patterns could help detect early signs of financial stress in students.
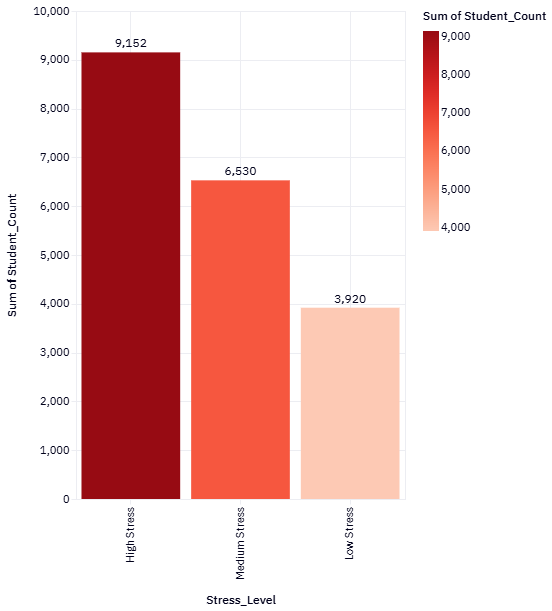
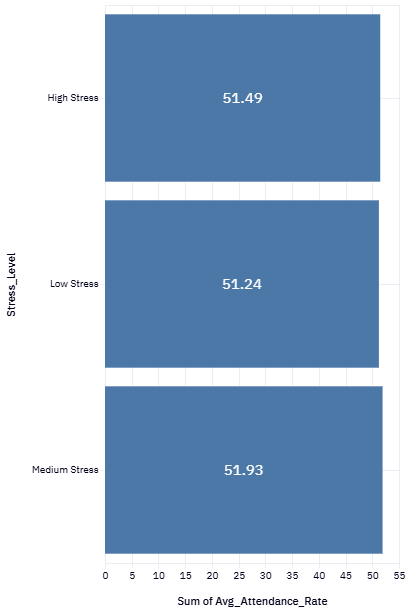
What this project does: This project analyzes student attendance and simulated fee payment delays to identify periods of financial stress. By calculating delay days, classifying stress levels, and visualizing trends through interactive dashboards, the system highlights students who may be at academic risk due to financial difficulties.
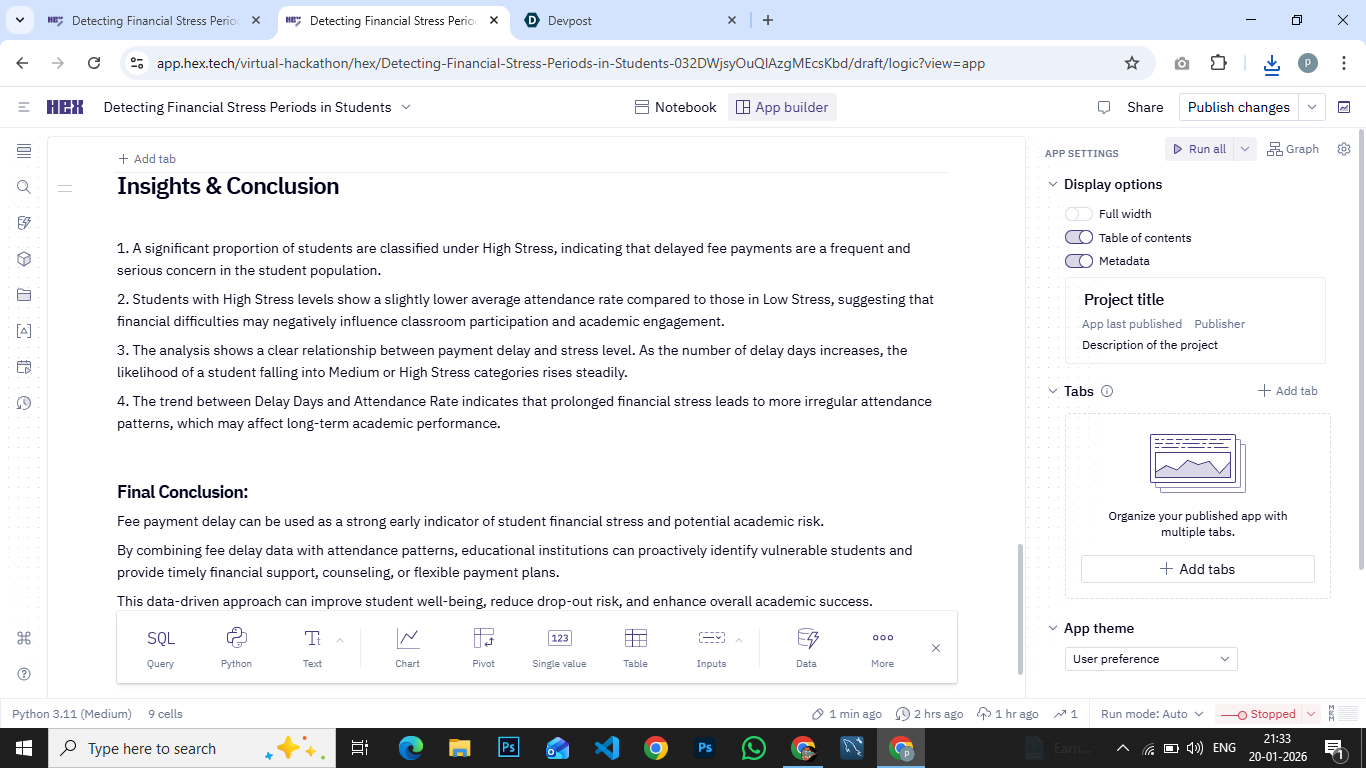
How I built it: I used Hex for data analysis and dashboard development. SQL was used to clean the data, calculate attendance rates, simulate fee payment dates, compute delay days, and classify students into Low, Medium, and High Stress categories. Multiple charts were created to show stress distribution, attendance trends, and the relationship between payment delays and attendance.
Challenges I ran into: One challenge was designing a realistic stress classification using simulated payment delays and ensuring the dashboards remained clear despite large datasets. Optimizing queries and choosing the right visualizations took careful testing.
What I learned: This project taught me how financial indicators can be combined with academic data to build early-warning systems. I also strengthened my skills in SQL, data modeling, and dashboard storytelling.
What’s next: In the future, this system could be extended with real payment data, counseling recommendations, alerts for advisors, and machine-learning models to predict dropout risk earlier.
Built With
- dashboard
- data-visualization
- hex
- sql

Log in or sign up for Devpost to join the conversation.