
Inspiration
Many small businesses collect useful sales information but leave it inside spreadsheets because professional analytics platforms can be expensive or difficult to use. I wanted to combine my interests in business analytics, Python, and artificial intelligence to create a tool that makes data easier to understand.
This inspired me to build DeskSignal, an approachable application that transforms sales data into practical insights.
What it does
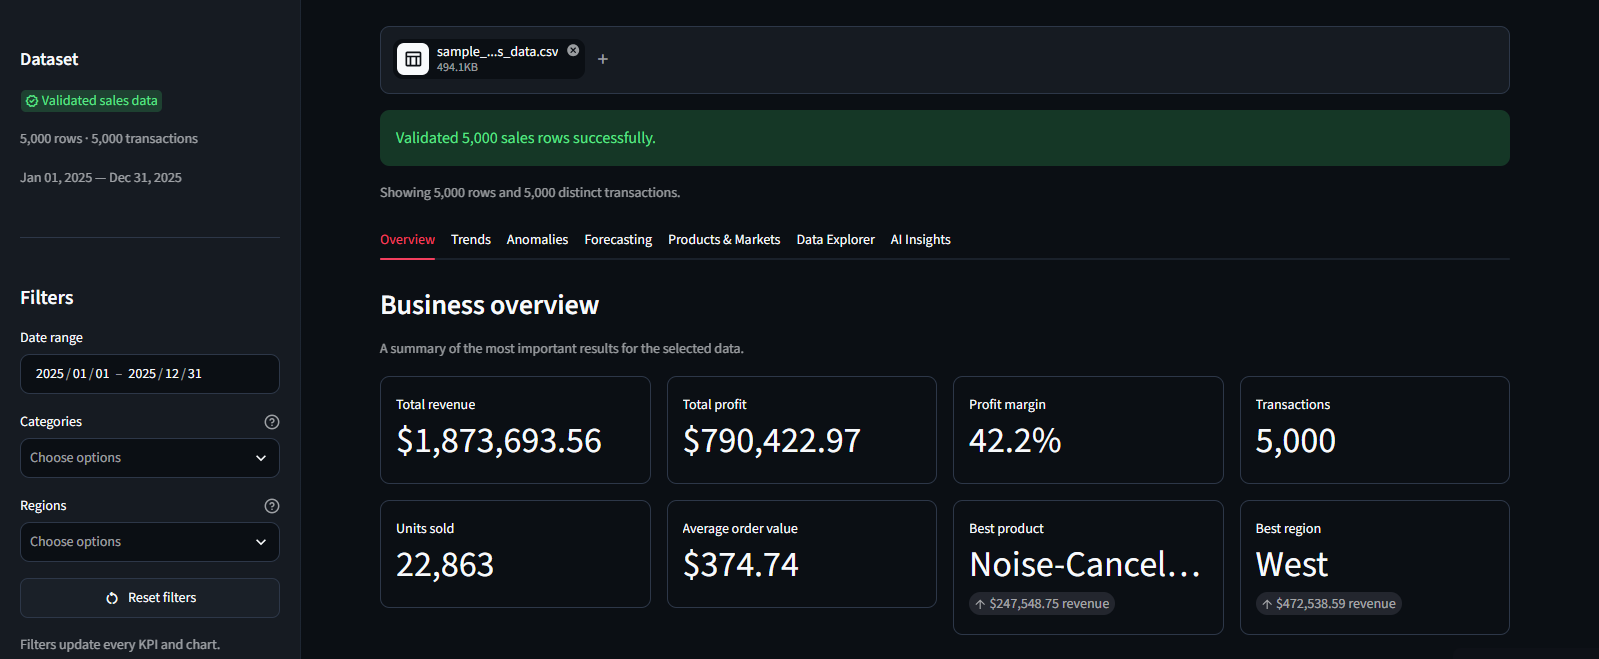
DeskSignal allows users to upload a sales CSV and automatically validates it before displaying results. The application:
- Calculates essential business KPIs
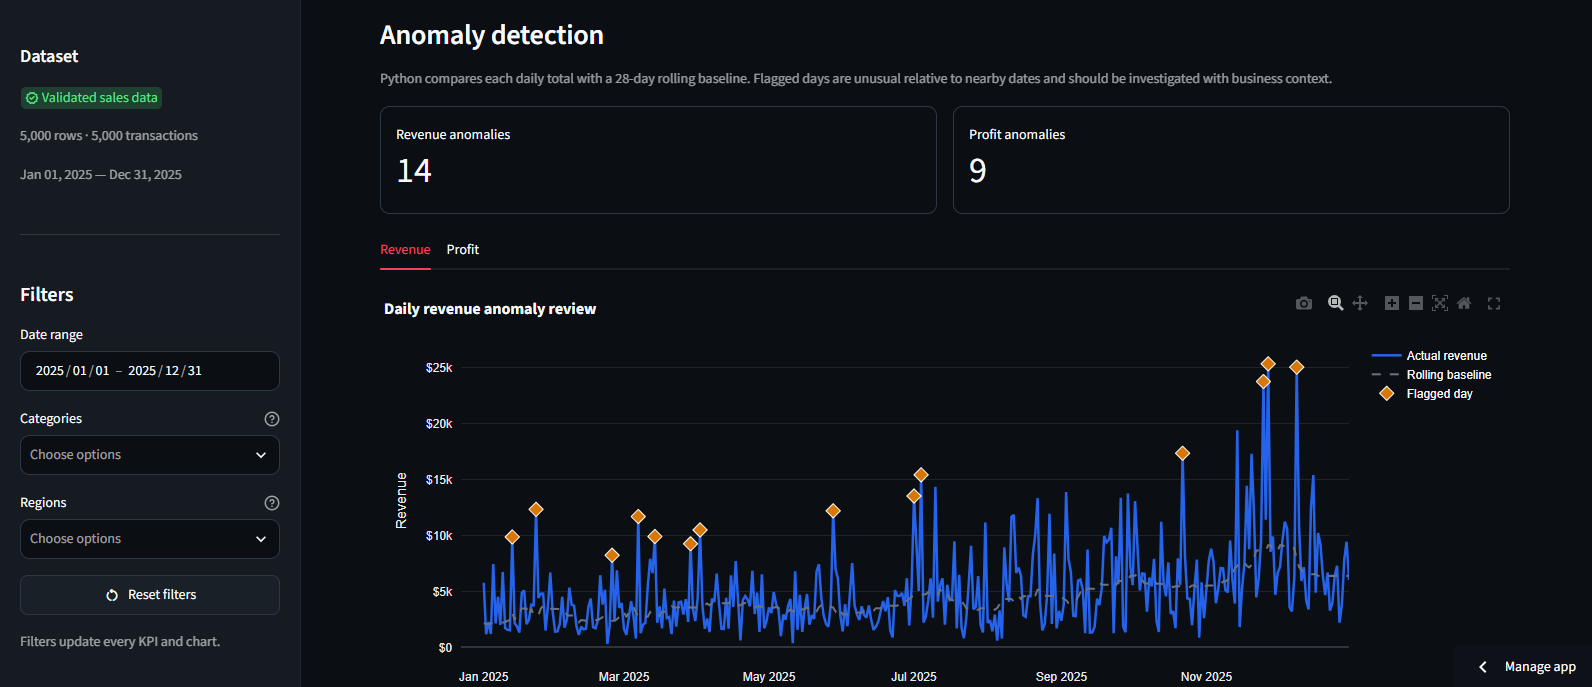
- Identifies sales trends and anomalies
- Generates forecasts and uncertainty ranges
- Compares products, categories, customers, and regions
- Provides filters and a detailed transaction explorer
- Allows users to download results
The AI Insights section contains three locally trained machine-learning tools:
- ML Anomalies uses Isolation Forest to identify unusual sales days.
- Market Segments uses K-Means clustering to group similar markets.
- ML Forecast uses a Random Forest model to predict upcoming sales.
These models run locally through Python and do not require an external API. Optional Claude API tools can provide grounded summaries and recommendations.
How we built it
I built DeskSignal with:
- Python for the application logic and calculations
- Streamlit for the web interface
- Pandas for validation, filtering, and data analysis
- Plotly for interactive visualizations
- scikit-learn for the machine-learning models
- pytest for automated testing
- Git and GitHub for version control
- Streamlit Community Cloud for deployment
I organized the code into separate modules for validation, analytics, machine learning, visualizations, AI tools, and interface components.
AI helped me research useful development tools and troubleshoot errors. I designed, coded, changed, tested, and finalized the application myself.
Challenges we ran into
One major challenge was safely accepting user-uploaded CSV files. DeskSignal needed to detect missing columns, invalid values, incorrect data types, and other issues before performing calculations.
I also worked through challenges involving Streamlit’s rerun behavior, keeping filters consistent across every page, improving chart readability, and producing stable machine-learning results.
Another challenge was clearly separating Python-calculated analytics, locally trained machine-learning models, and optional Claude API features so users understand where each result comes from.
Accomplishments that we're proud of
I am proud that DeskSignal became a complete, publicly accessible application instead of remaining a basic prototype.
Some of my biggest accomplishments include:
- Building seven primary analytics pages
- Creating three local machine-learning tools
- Adding interactive charts and filters
- Developing detailed CSV validation
- Making the core features work without an API key
- Deploying a publicly accessible version
- Writing 88 automated tests
- Creating an organized and documented public GitHub repository
DeskSignal can process a fictional dataset containing 5,000 transactions and transform it into an understandable business dashboard.
What we learned
Building DeskSignal taught me that reliable analytics begins with clean and carefully validated data. I learned how to organize a larger Python project, create reusable functions, train and evaluate machine-learning models, communicate forecast uncertainty, and test calculations automatically.
I also gained experience with GitHub, cloud deployment, debugging, interface design, documentation, and responsible AI use.
Most importantly, I learned that technical results must be presented clearly if they are going to help someone make a decision.
What's next for DeskSignal - AI Business Analytics Assistant
My next goal is to develop DeskSignal into a more complete business platform. Potential improvements include:
- Secure accounts and team workspaces
- Saved and customizable dashboards
- Database and spreadsheet integrations
- Scheduled data imports
- Automatically generated reports
- Support for larger datasets
- Improved model explanations
- Better accessibility and mobile responsiveness
- Comparisons between multiple reporting periods
- Additional forecasting and recommendation tools
These improvements could make DeskSignal more useful for small businesses that need understandable analytics without complicated enterprise software.


Log in or sign up for Devpost to join the conversation.