Inspiration
Actually, our original idea was having a user inputted equation, and contorting an image based off that equation. However, image manipulation is quite challenging, and we did not want to learn something entirely from scratch right in the middle of the hackathon.
It slowly spiraled to this idea that we now created into a study product.
Target Users?
Mostly high schoolers or middle schoolers who need a little extra help on graphing.
What it does
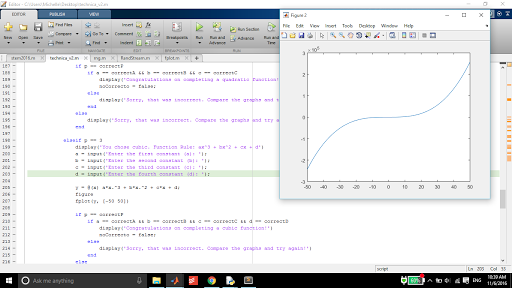
It's a graphing study tool, and can generate multitudes of different graphs so that you'll rarely get the same one twice.
We give the student an equation with unknown variables and a graph from the completed equation. The student finds the values of the variables that create the graph.
By studying through practice, the student will be able to recognize graphing patterns easily and figure the solutions out quickly.
How we built it
With plenty of junk food and caffeine. Haha, no. Actually, we made a loop for each equation and randomly generated the parameters to the equations. Then, we graphed the final equation and asked the user to figure out the equation.
Challenges we ran into
The time constraints were a bit too tight, as we kept on getting distracted. It was harder and harder to concentrate as it got deeper into the night.
What's next for Descartes and the Fly
We are definitely going to add more equations that students can study with, e.g. trigonometric functions and logs. We would also like to add a little helper button, for when the student is stumped. Also, a point system based on the time it took to answer and the number of wrong answers could inspire competition and self improvement.
Originally, we wanted to create a website, but we had no experience with HTML5 Canvas, which is what it uses for graphing. After we get a little work in with that, bringing Descartes and the Fly online is the next step.

Log in or sign up for Devpost to join the conversation.