Inspiration
Because dengue sucks. I've had dengue three times, and the third time I almost died. A second or third infection carries a higher risk of severe dengue, so for people like me every outbreak is more dangerous than the last.
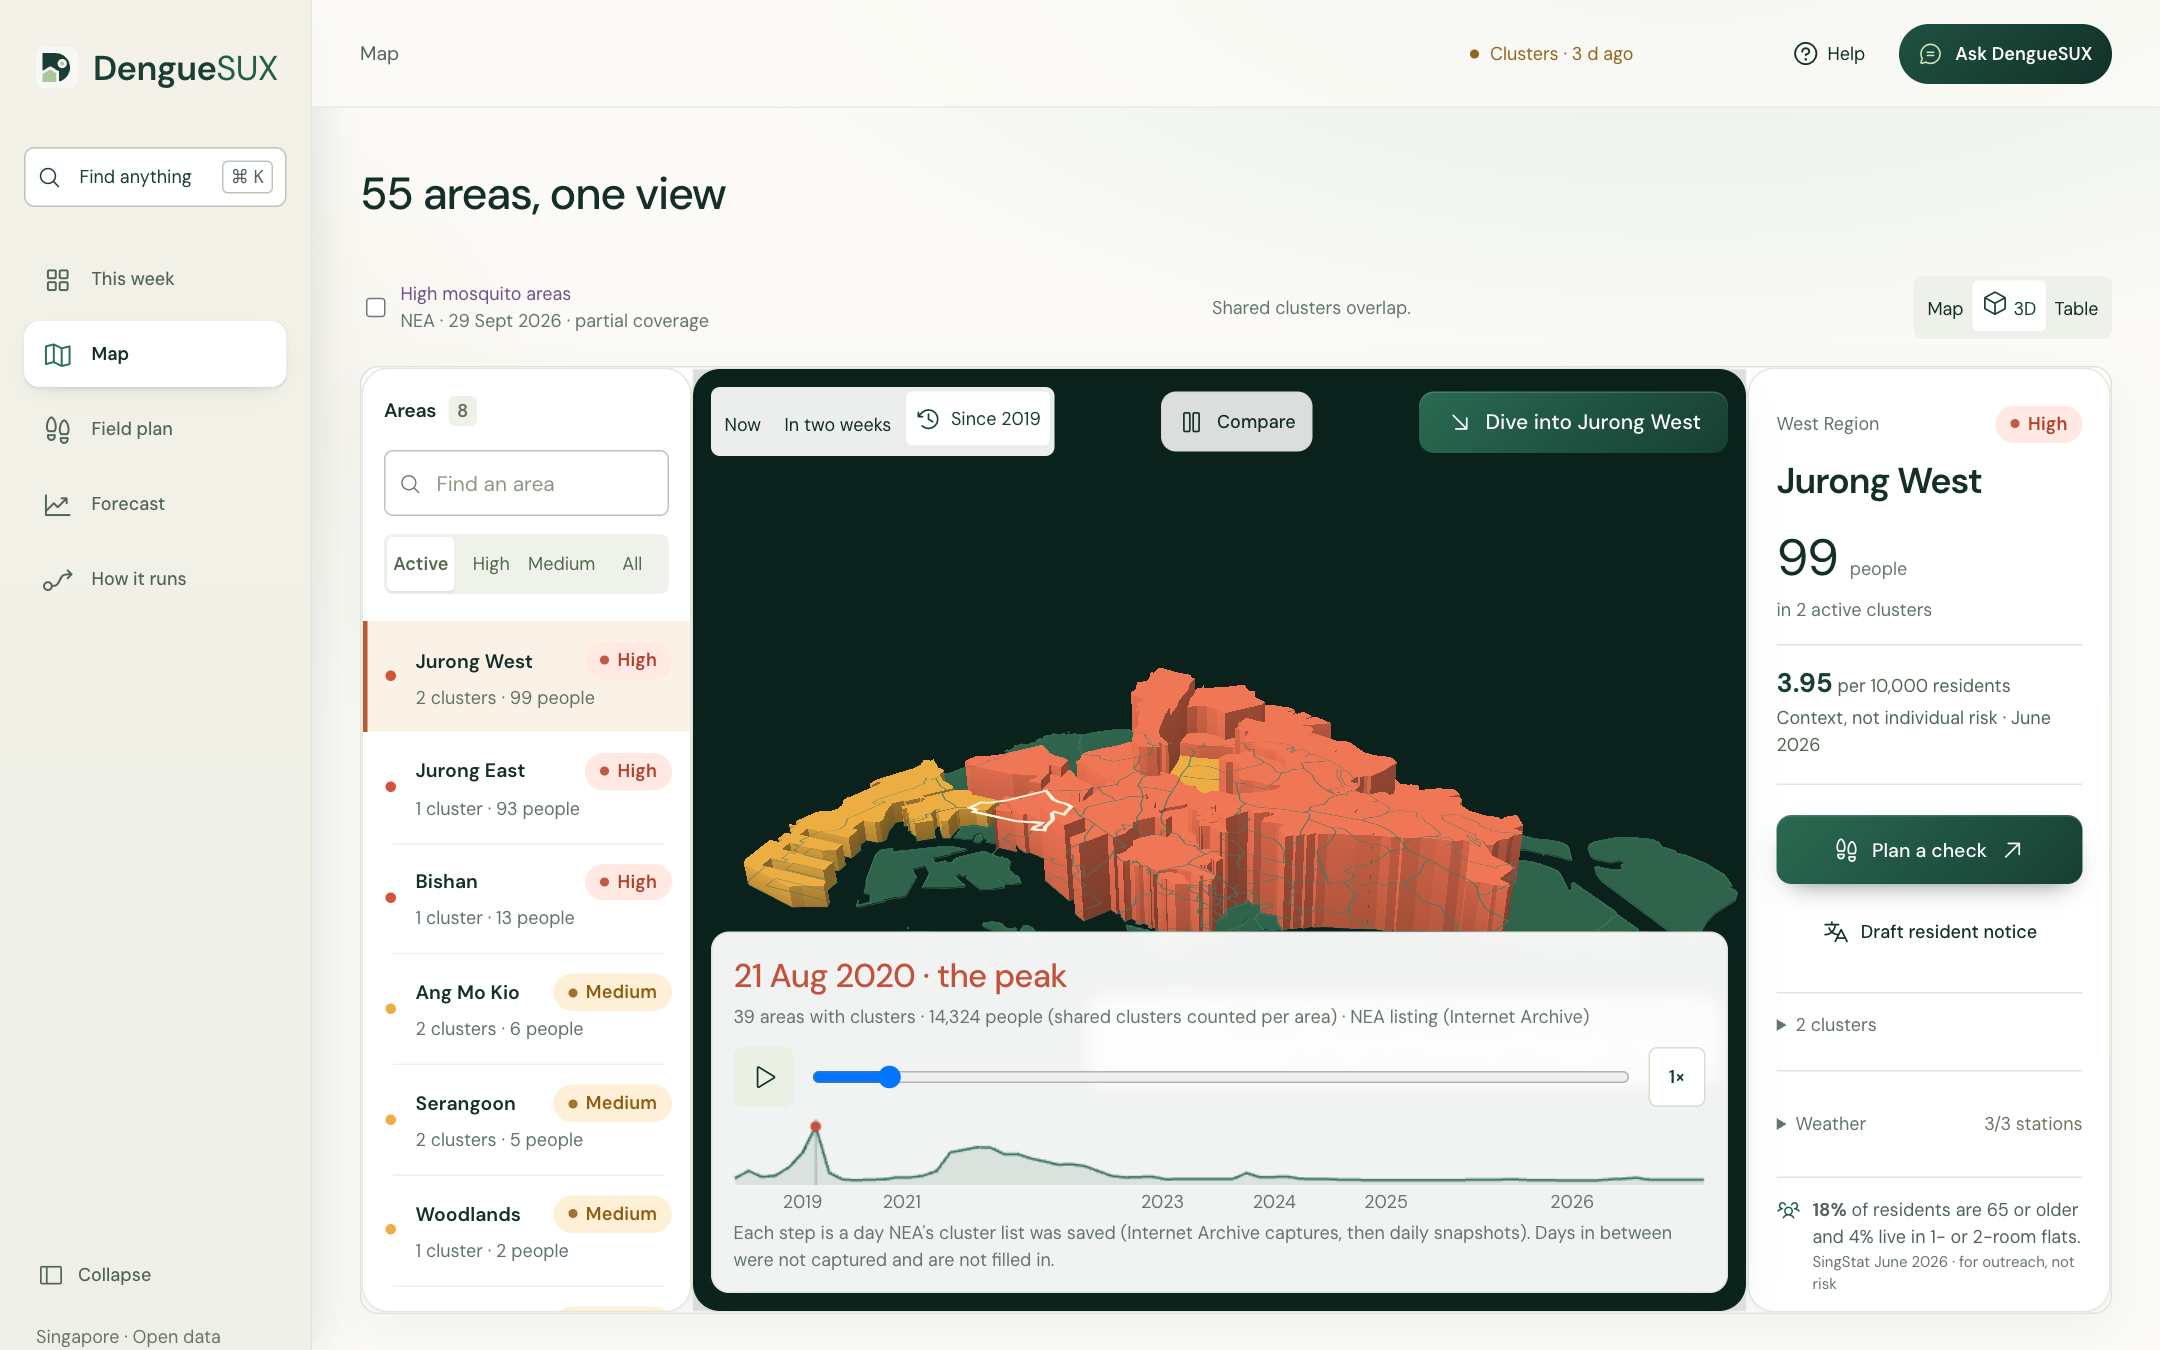
Singapore recorded a record 35,315 dengue cases in 2020, with 1,792 in a single week at the peak, and 32,175 in 2022. Yet we usually learn an area is in trouble only after people are already sick: by the time a cluster appears on the map, mosquitoes may have been breeding nearby for weeks. We wanted to answer one practical question every week: where should we look for mosquitoes first?
What it does
DengueSUX turns Singapore's open data into a weekly plan for three people: estate teams deciding where to inspect, volunteers deciding where to walk, and residents deciding what to do at home.
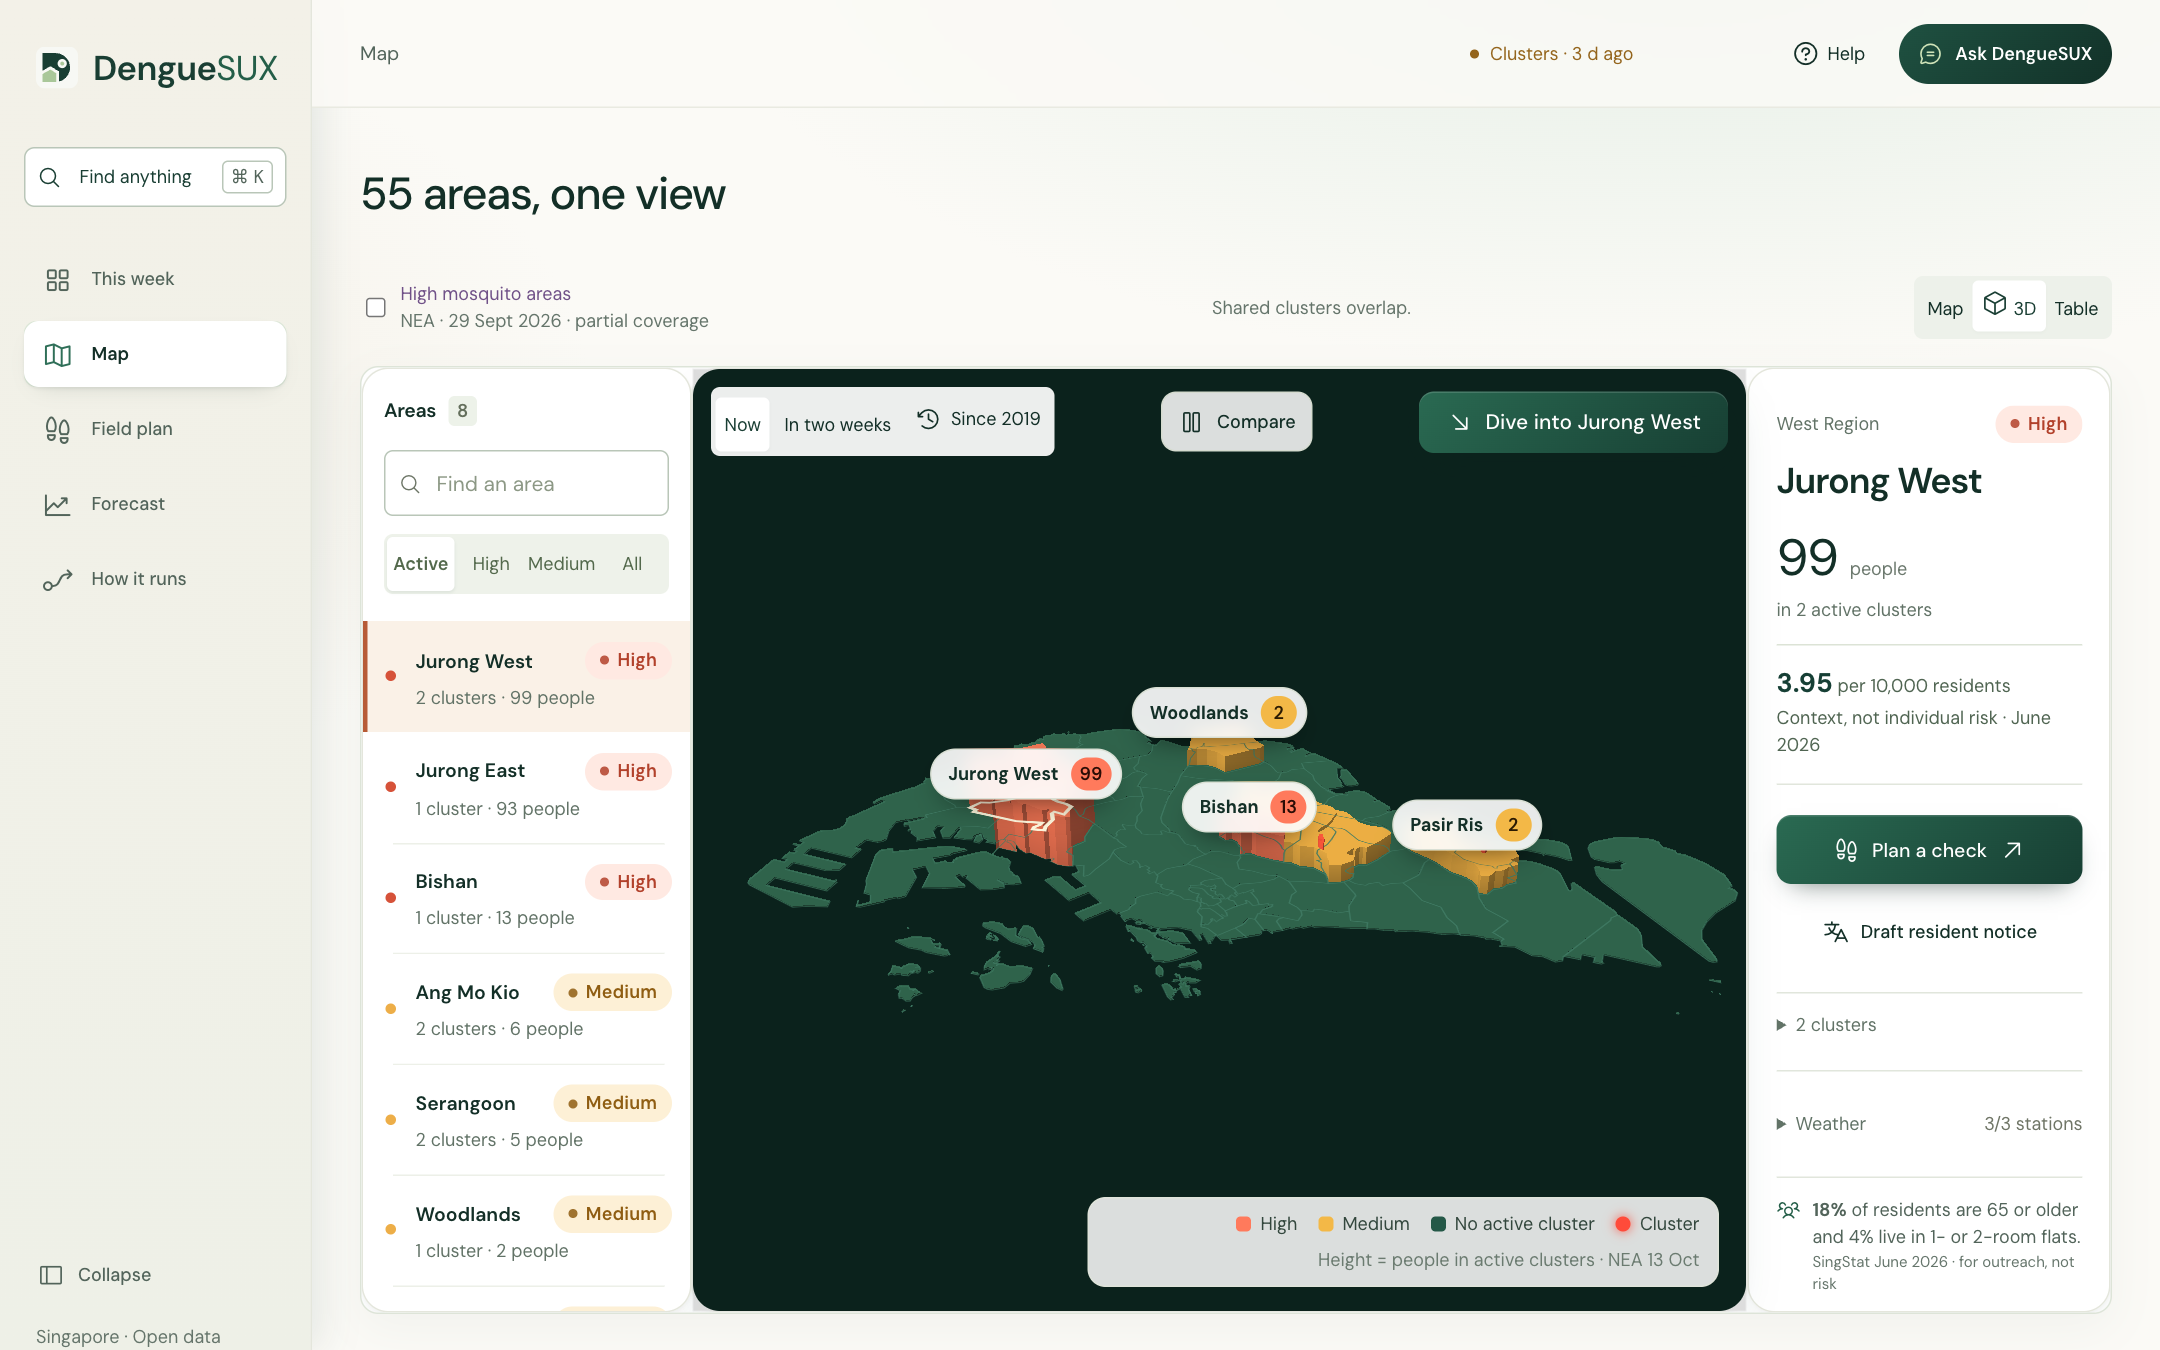
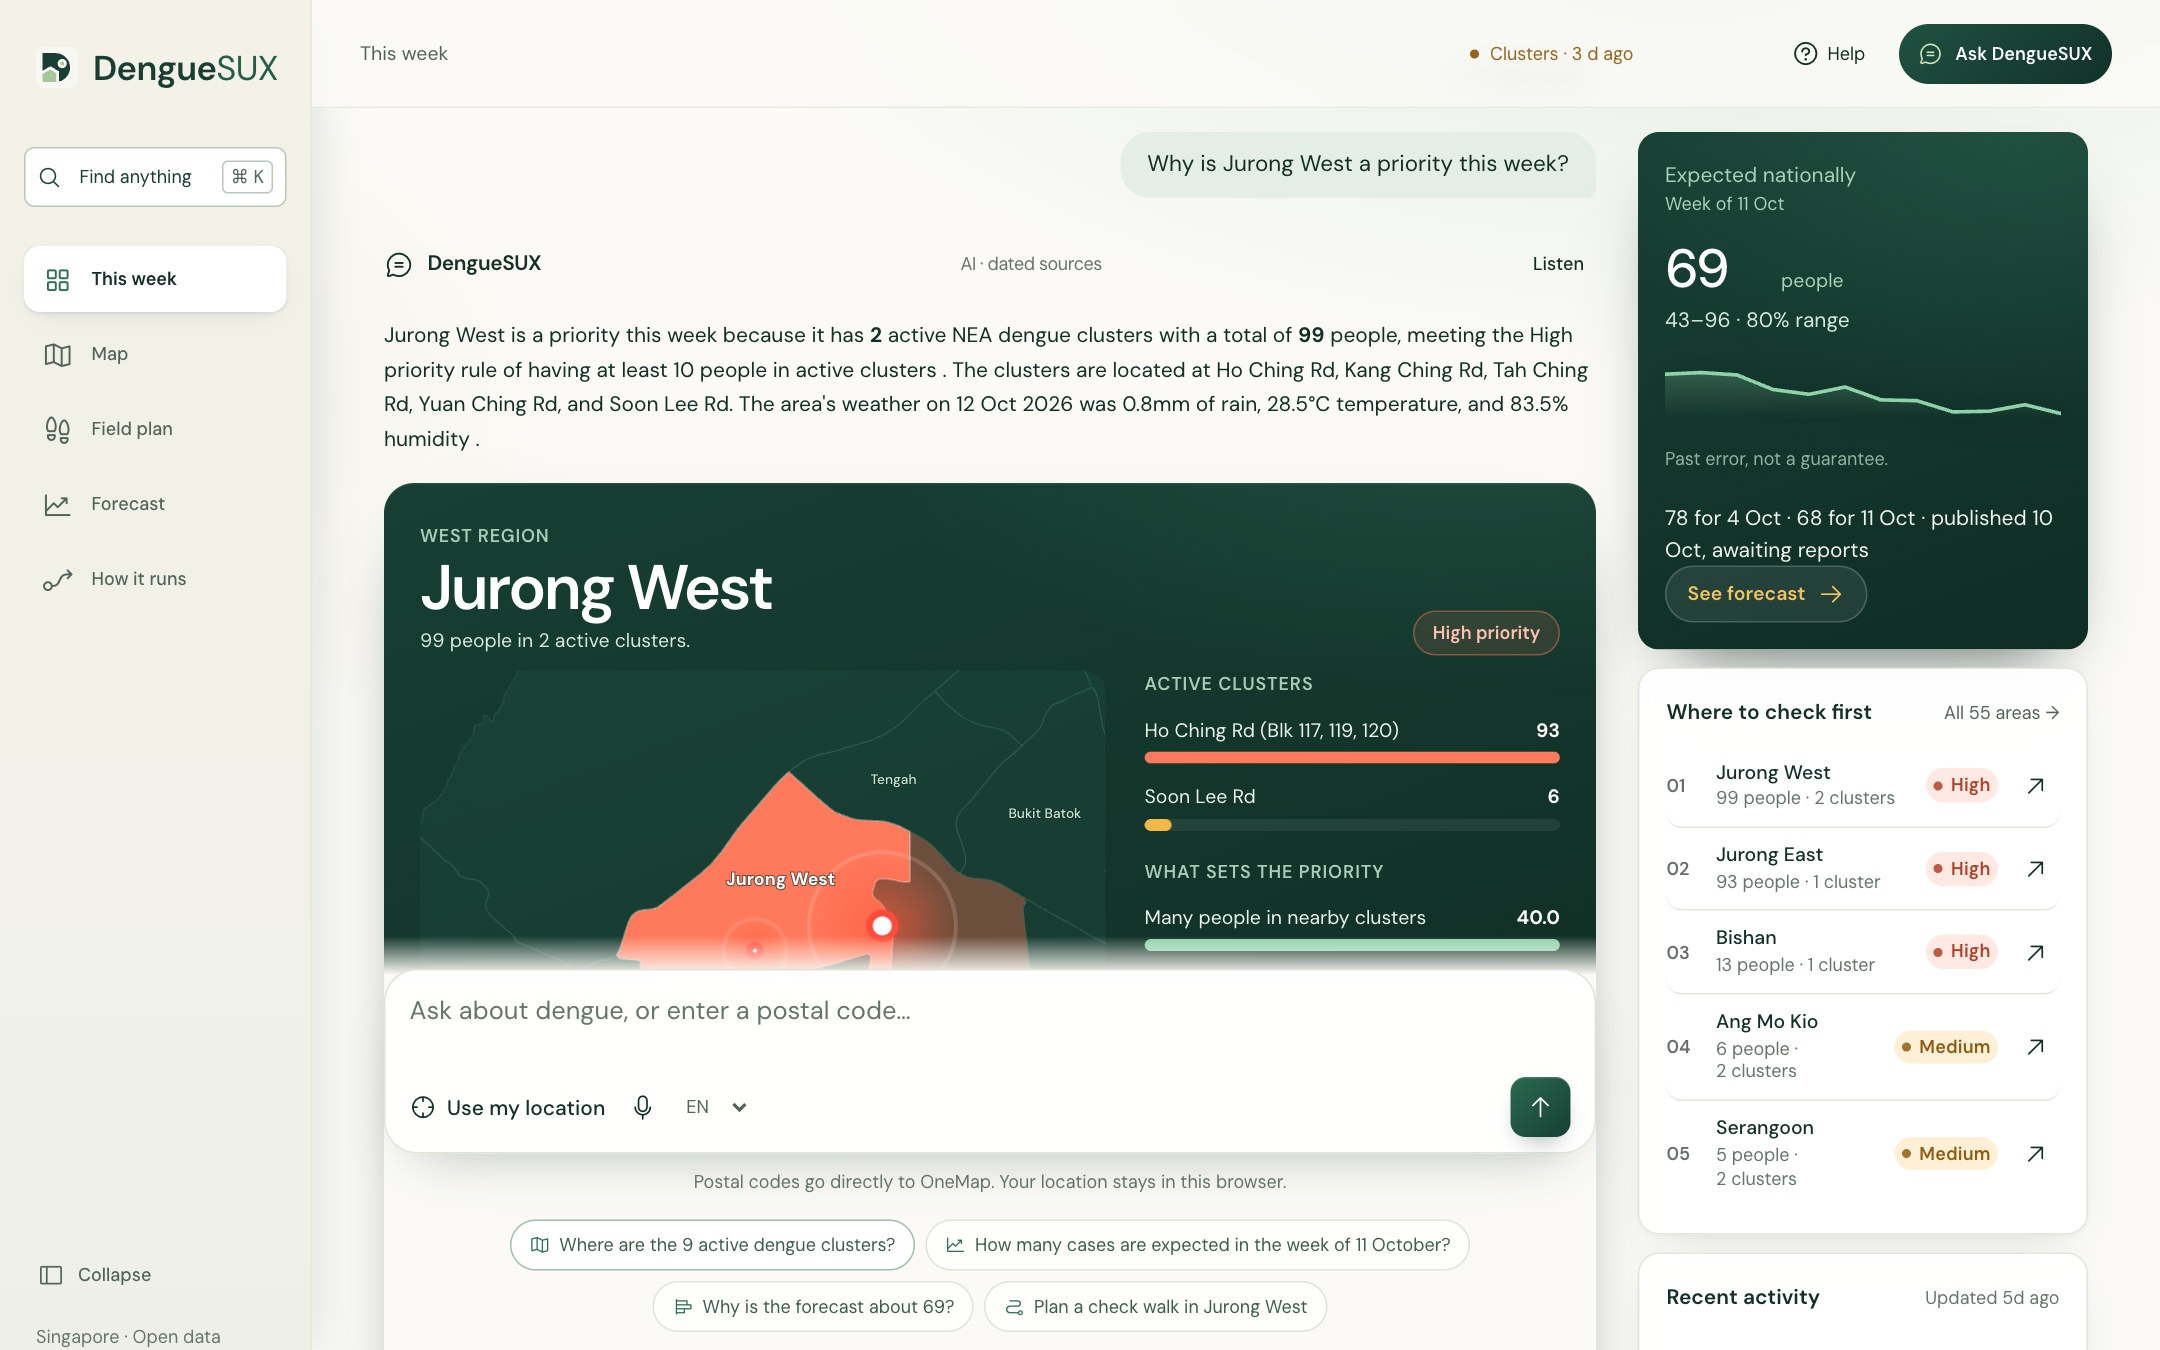
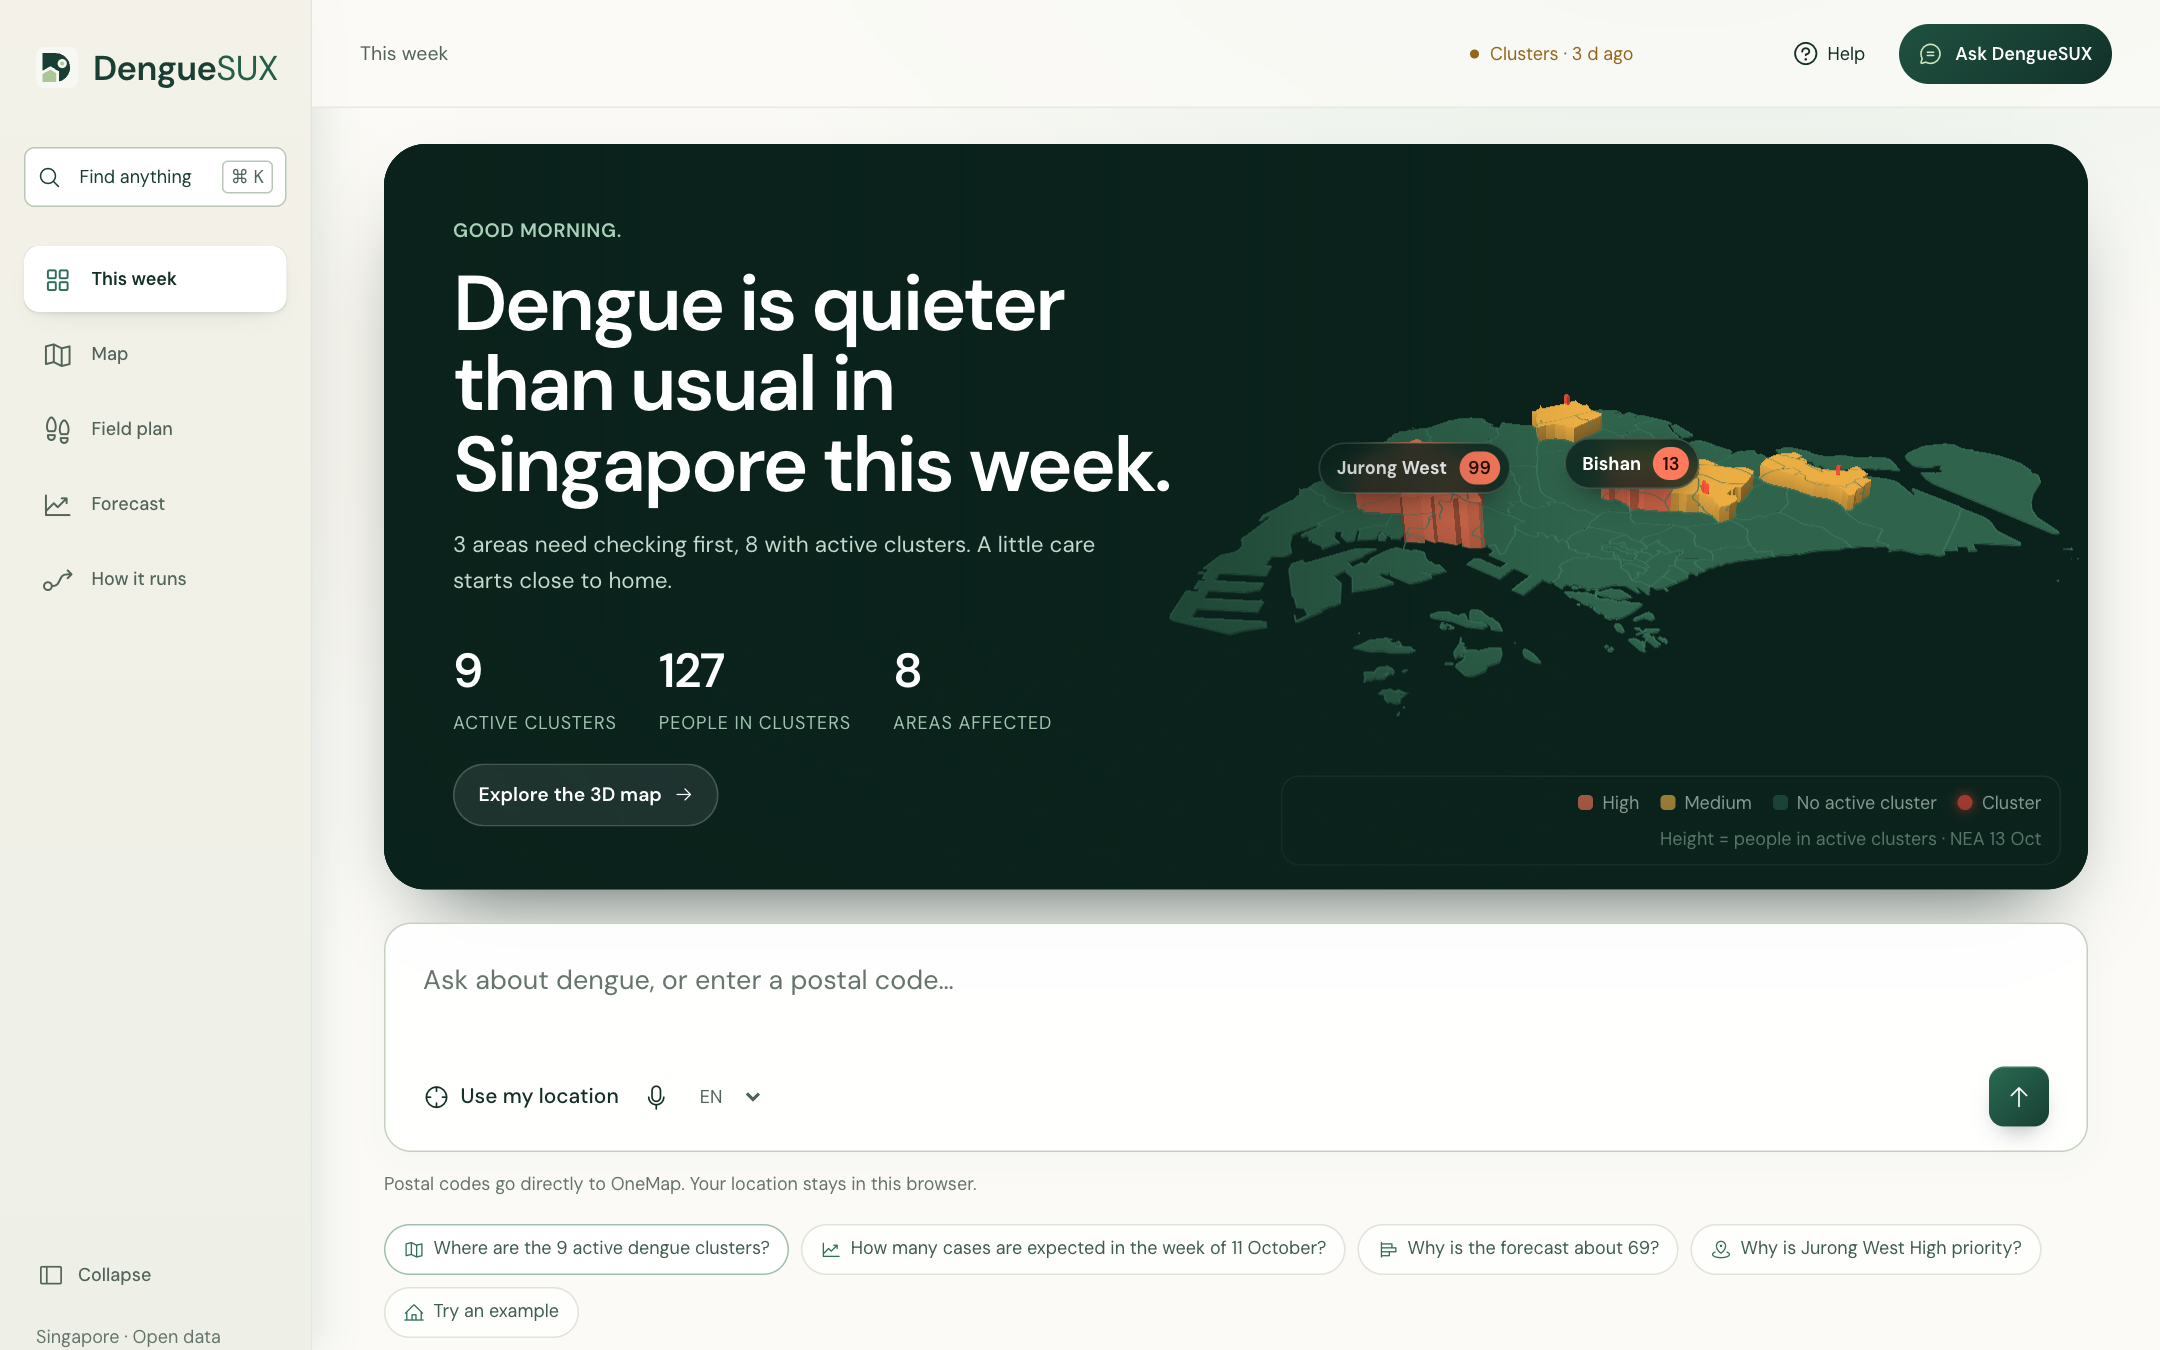
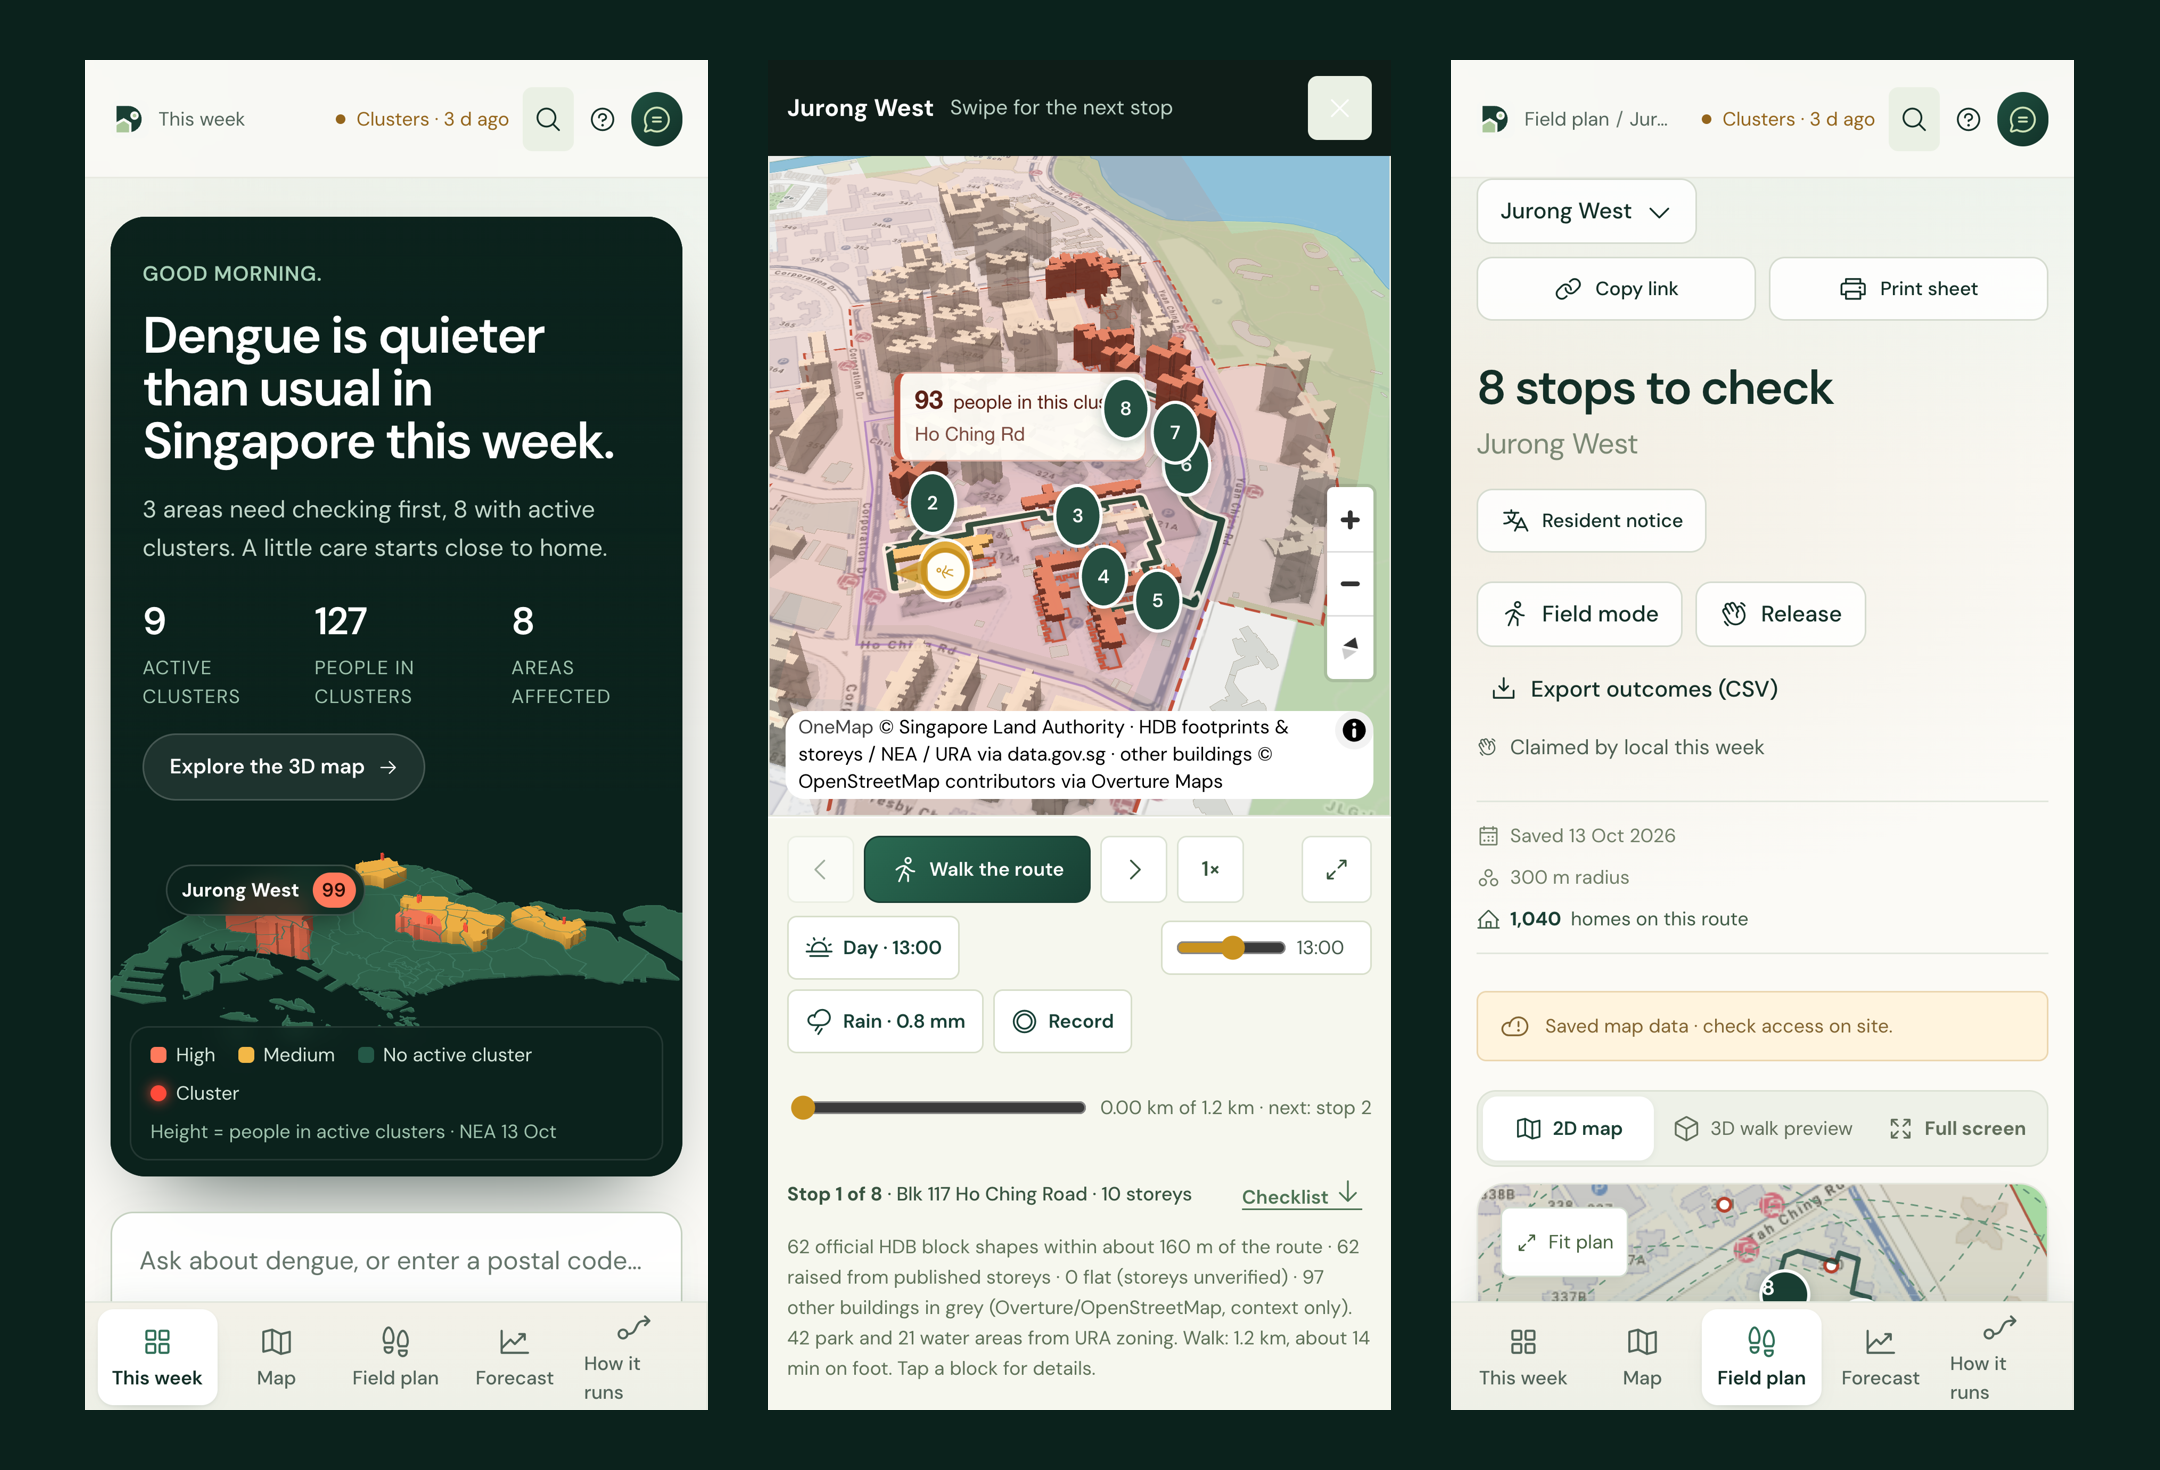
- Where to check first. All 55 planning areas, ranked by people in active NEA dengue clusters and shown as a 3D island. In the 13 October snapshot, 127 people are in 9 active clusters; Jurong West has 99 people in 2 clusters.
- A two-week outlook for every area. We rebuilt area-level cluster history from 68 archived NEA listings plus our daily snapshots (73 listed days since 2019; 98.6% of listed cases placed by block or street). Two logistic models give each area's chance of any cluster, and of 10+ people, about two weeks ahead, with drivers.
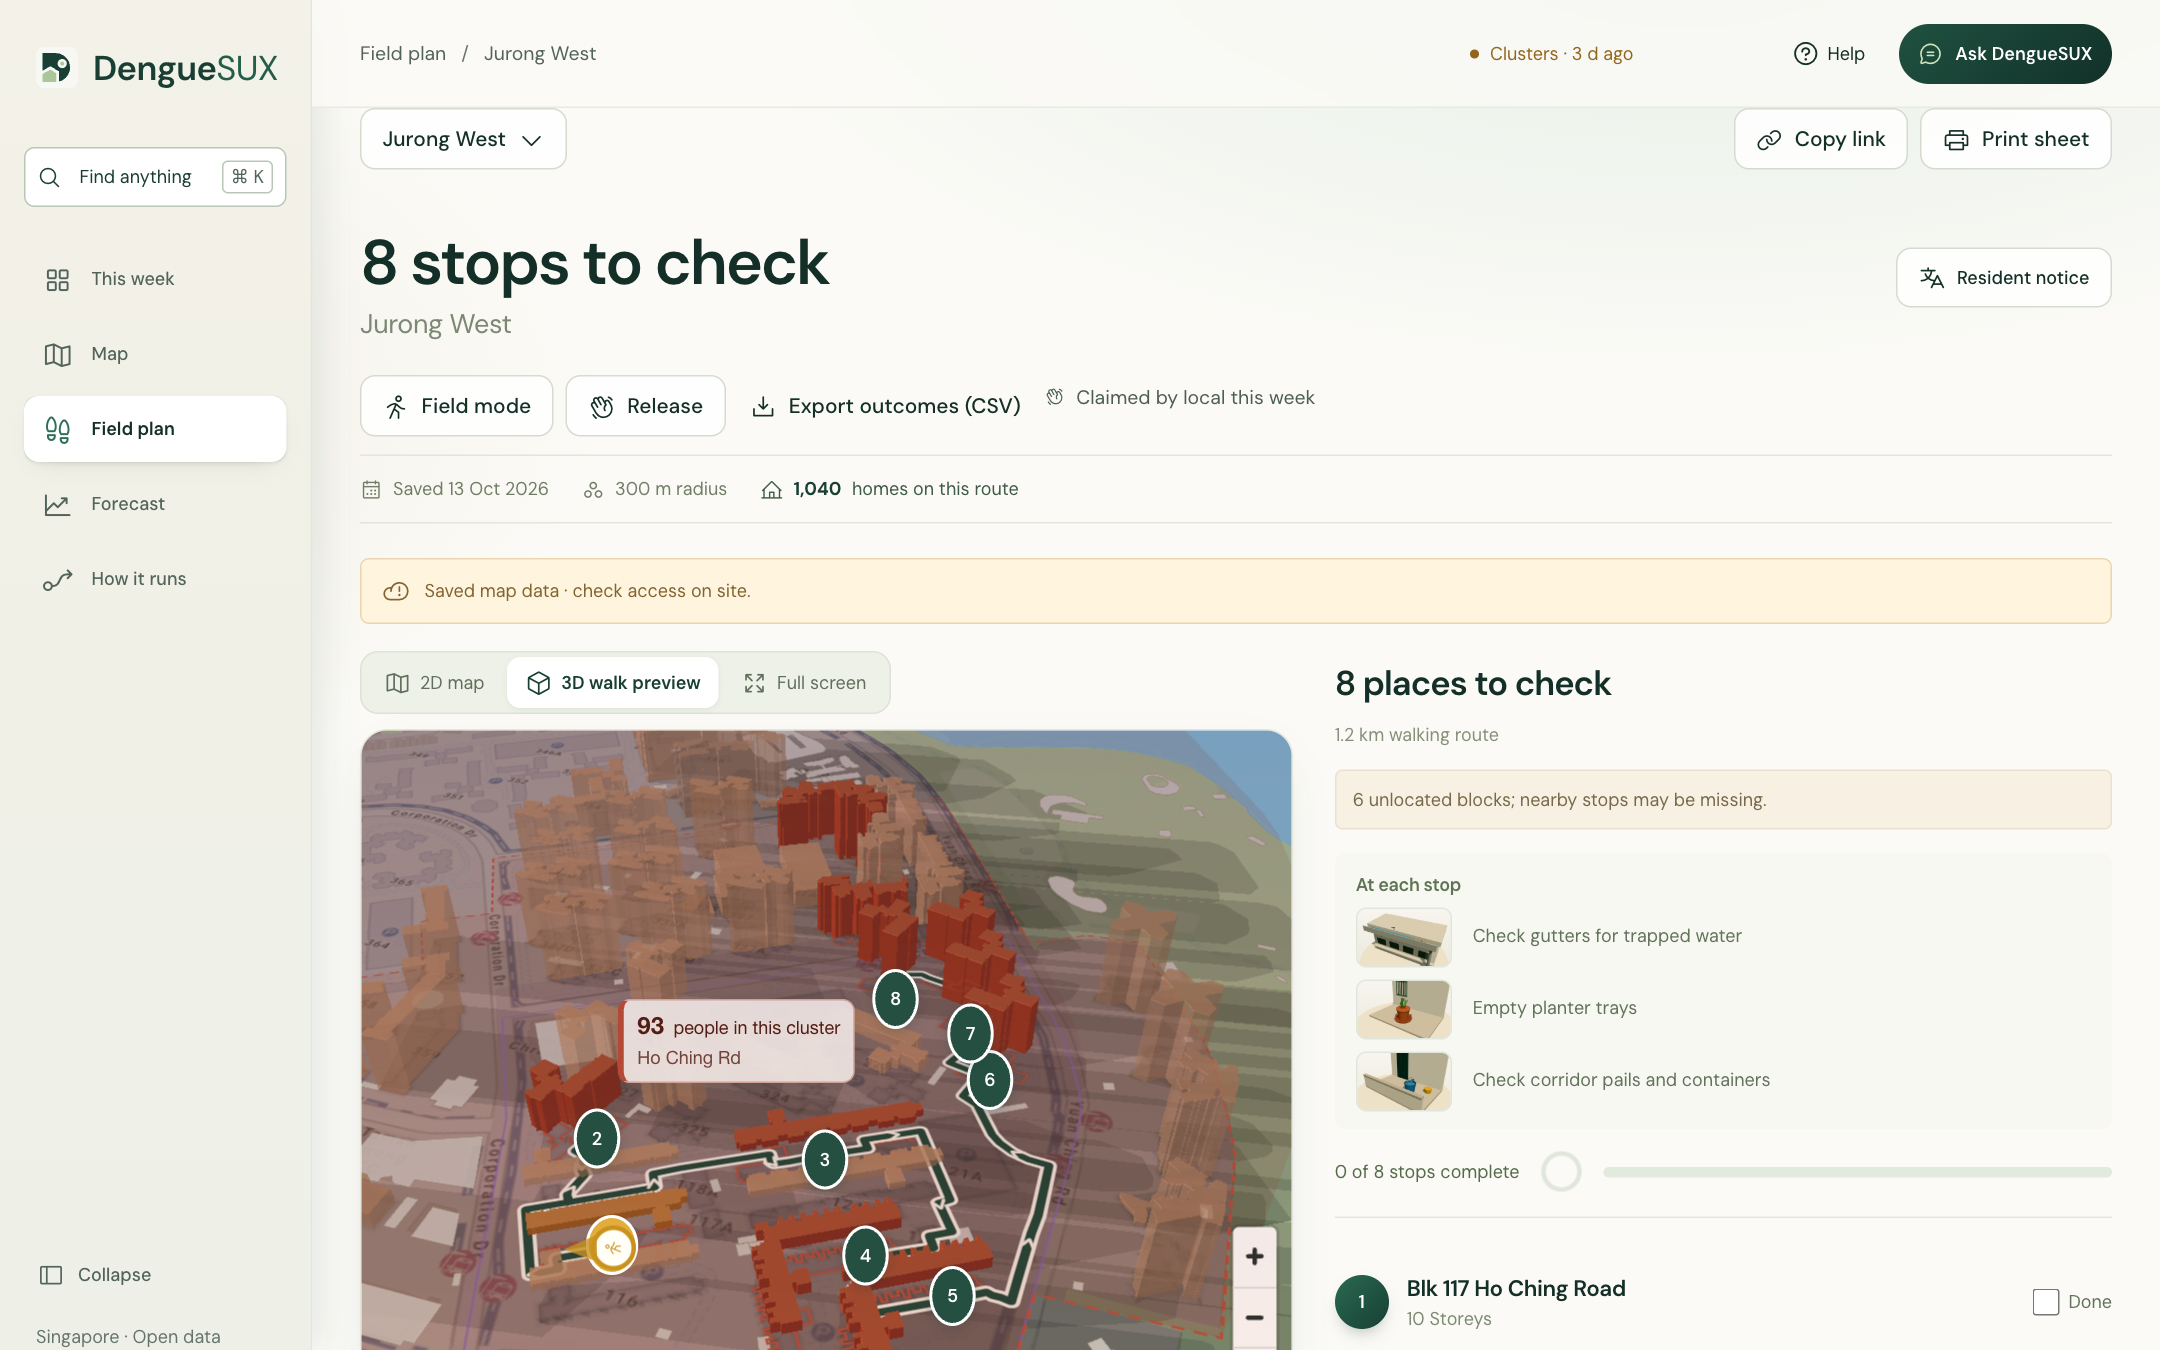
- Which blocks to walk. One click turns an area into ranked places to check (the HDB blocks named in the cluster, plus nearby parks and hawker centres) on a OneMap walking route: 8 stops on 1.2 km in Jurong West. A 3D walk follows the route among official HDB footprints, with a real sun, shadows and the day's rain, and pauses at each stop with an illustration of what to look for. These are places to check, never confirmed breeding sites.
- What to tell residents. A notice for every area in English, 中文, Bahasa Melayu and தமிழ், each passing 5 automatic fact checks, plus an A4 lift-lobby poster with QR codes, a public resident site with no sign-in, and Telegram alerts from @DengueSUXbot.
- Ask DengueSUX. Plain-language questions ("Why is Jurong West High?", "Plan a check walk in Jurong West") are answered by Llama 3.3 70B with nine tools on the Foundation Model API, or by a Genie space over 11 gold tables. Numbers come from tools, every answer cites a dated source, and every answer is traced in MLflow.
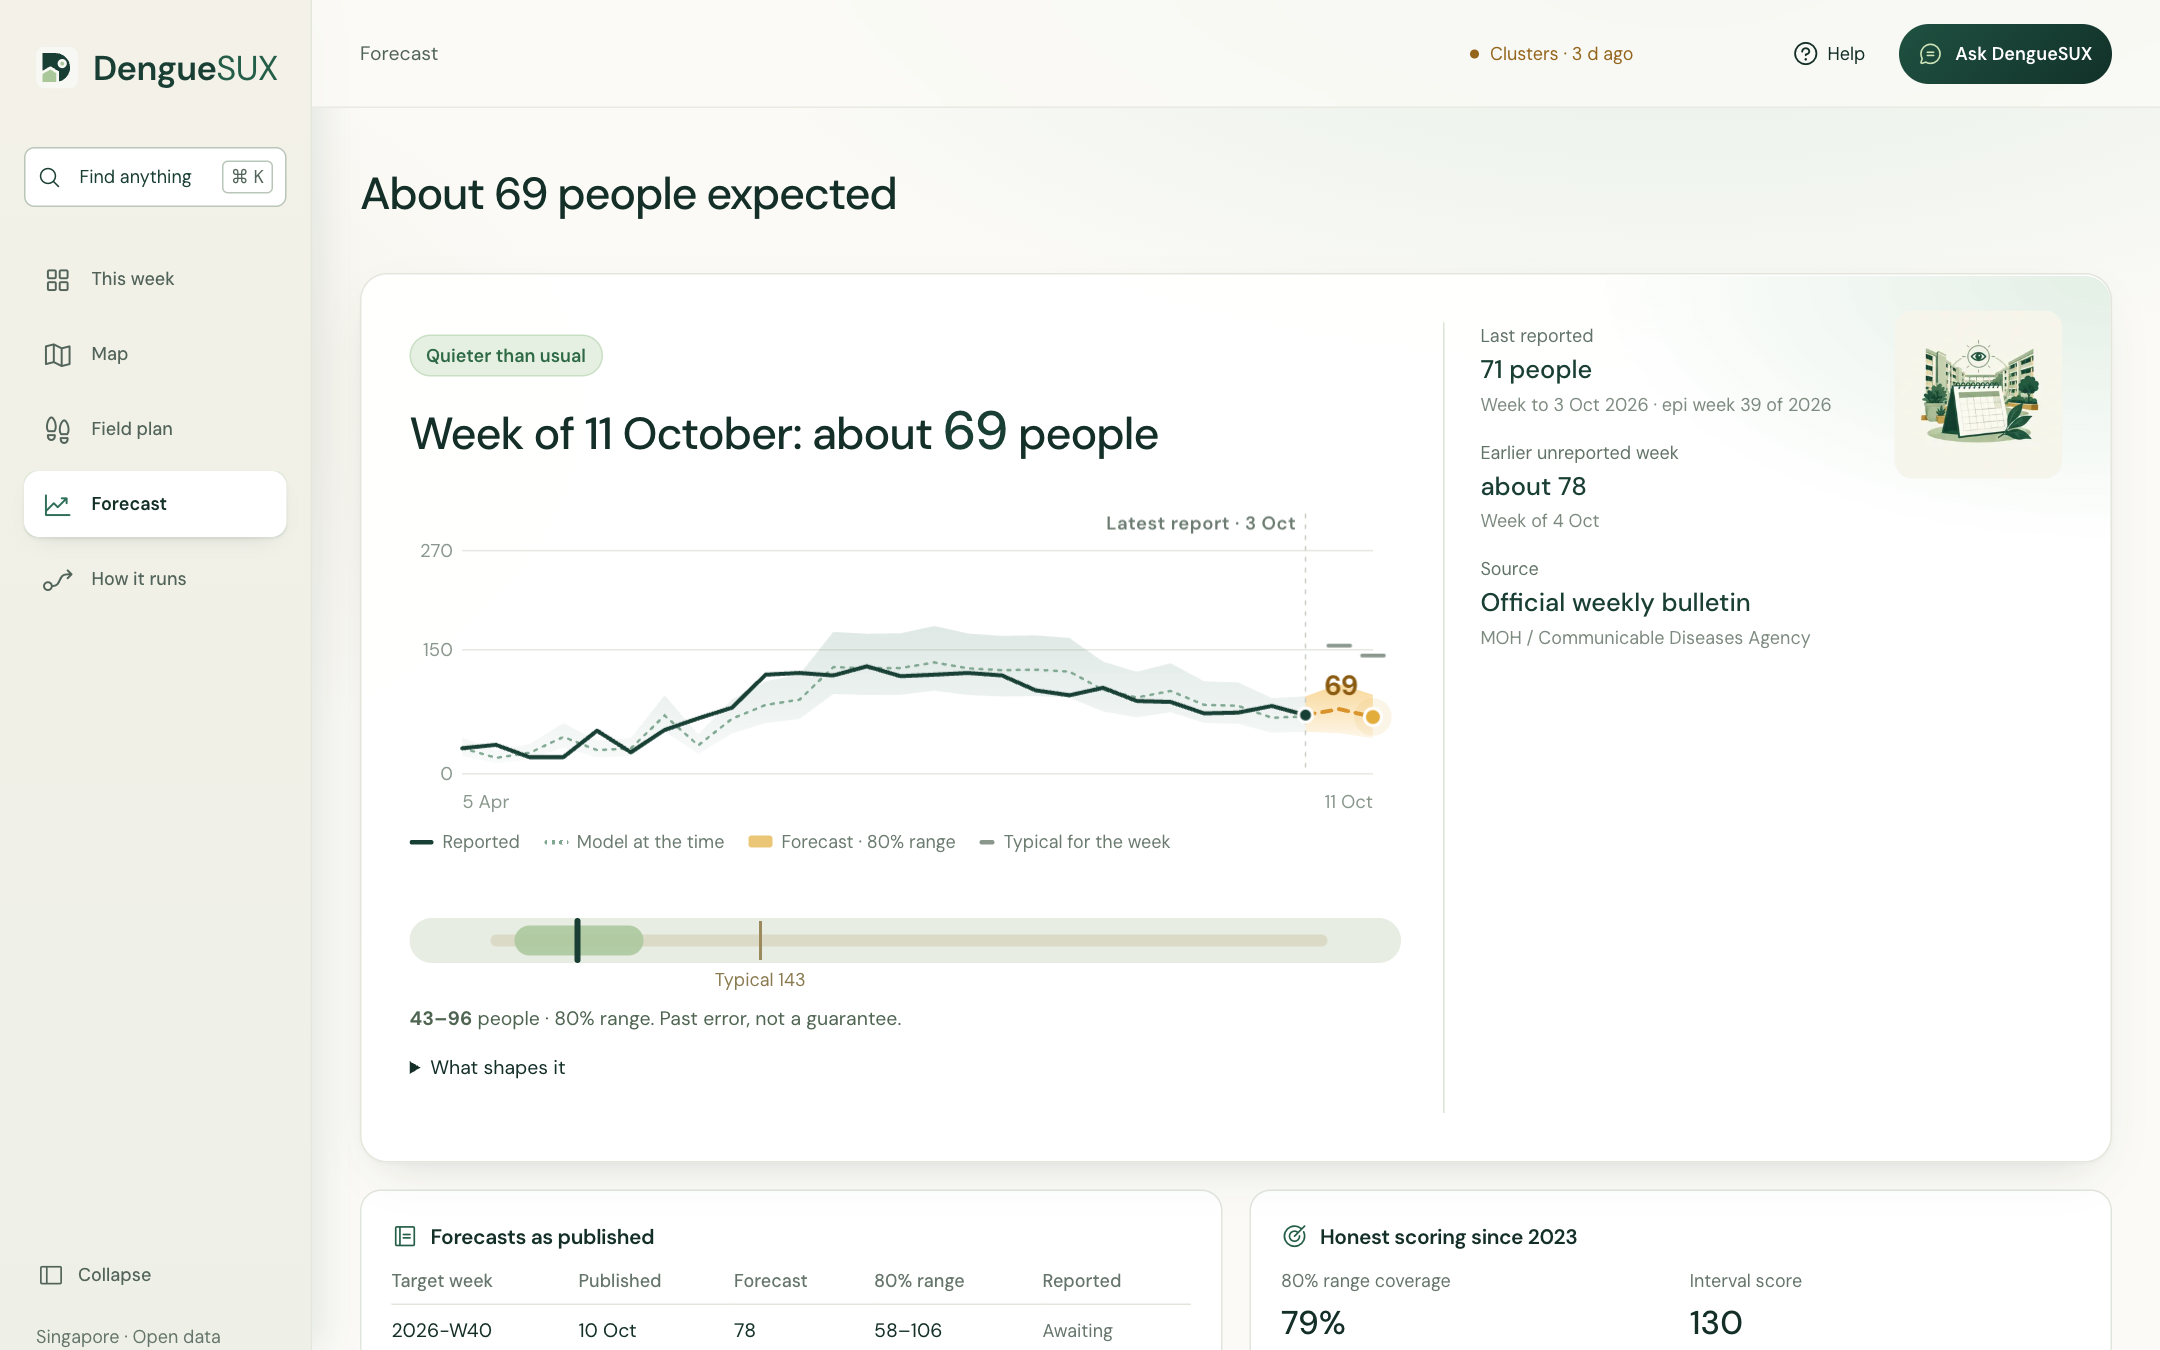
- A live national forecast with a range. Official MOH/CDA weekly counts are collected automatically twice a week. For the week of 11 October the outlook is about 69 people, with an adaptive 80% range of 43–96. Every published forecast goes into an append-only ledger and is scored when the count arrives.
- In the field. Field mode works offline with large tap targets; volunteers log what they find, and a stop where water was found is re-checked first the next day. Team mode lets a walk be claimed for the week and exports outcomes as CSV.
How we built it
Everything runs serverless on Databricks Free Edition.
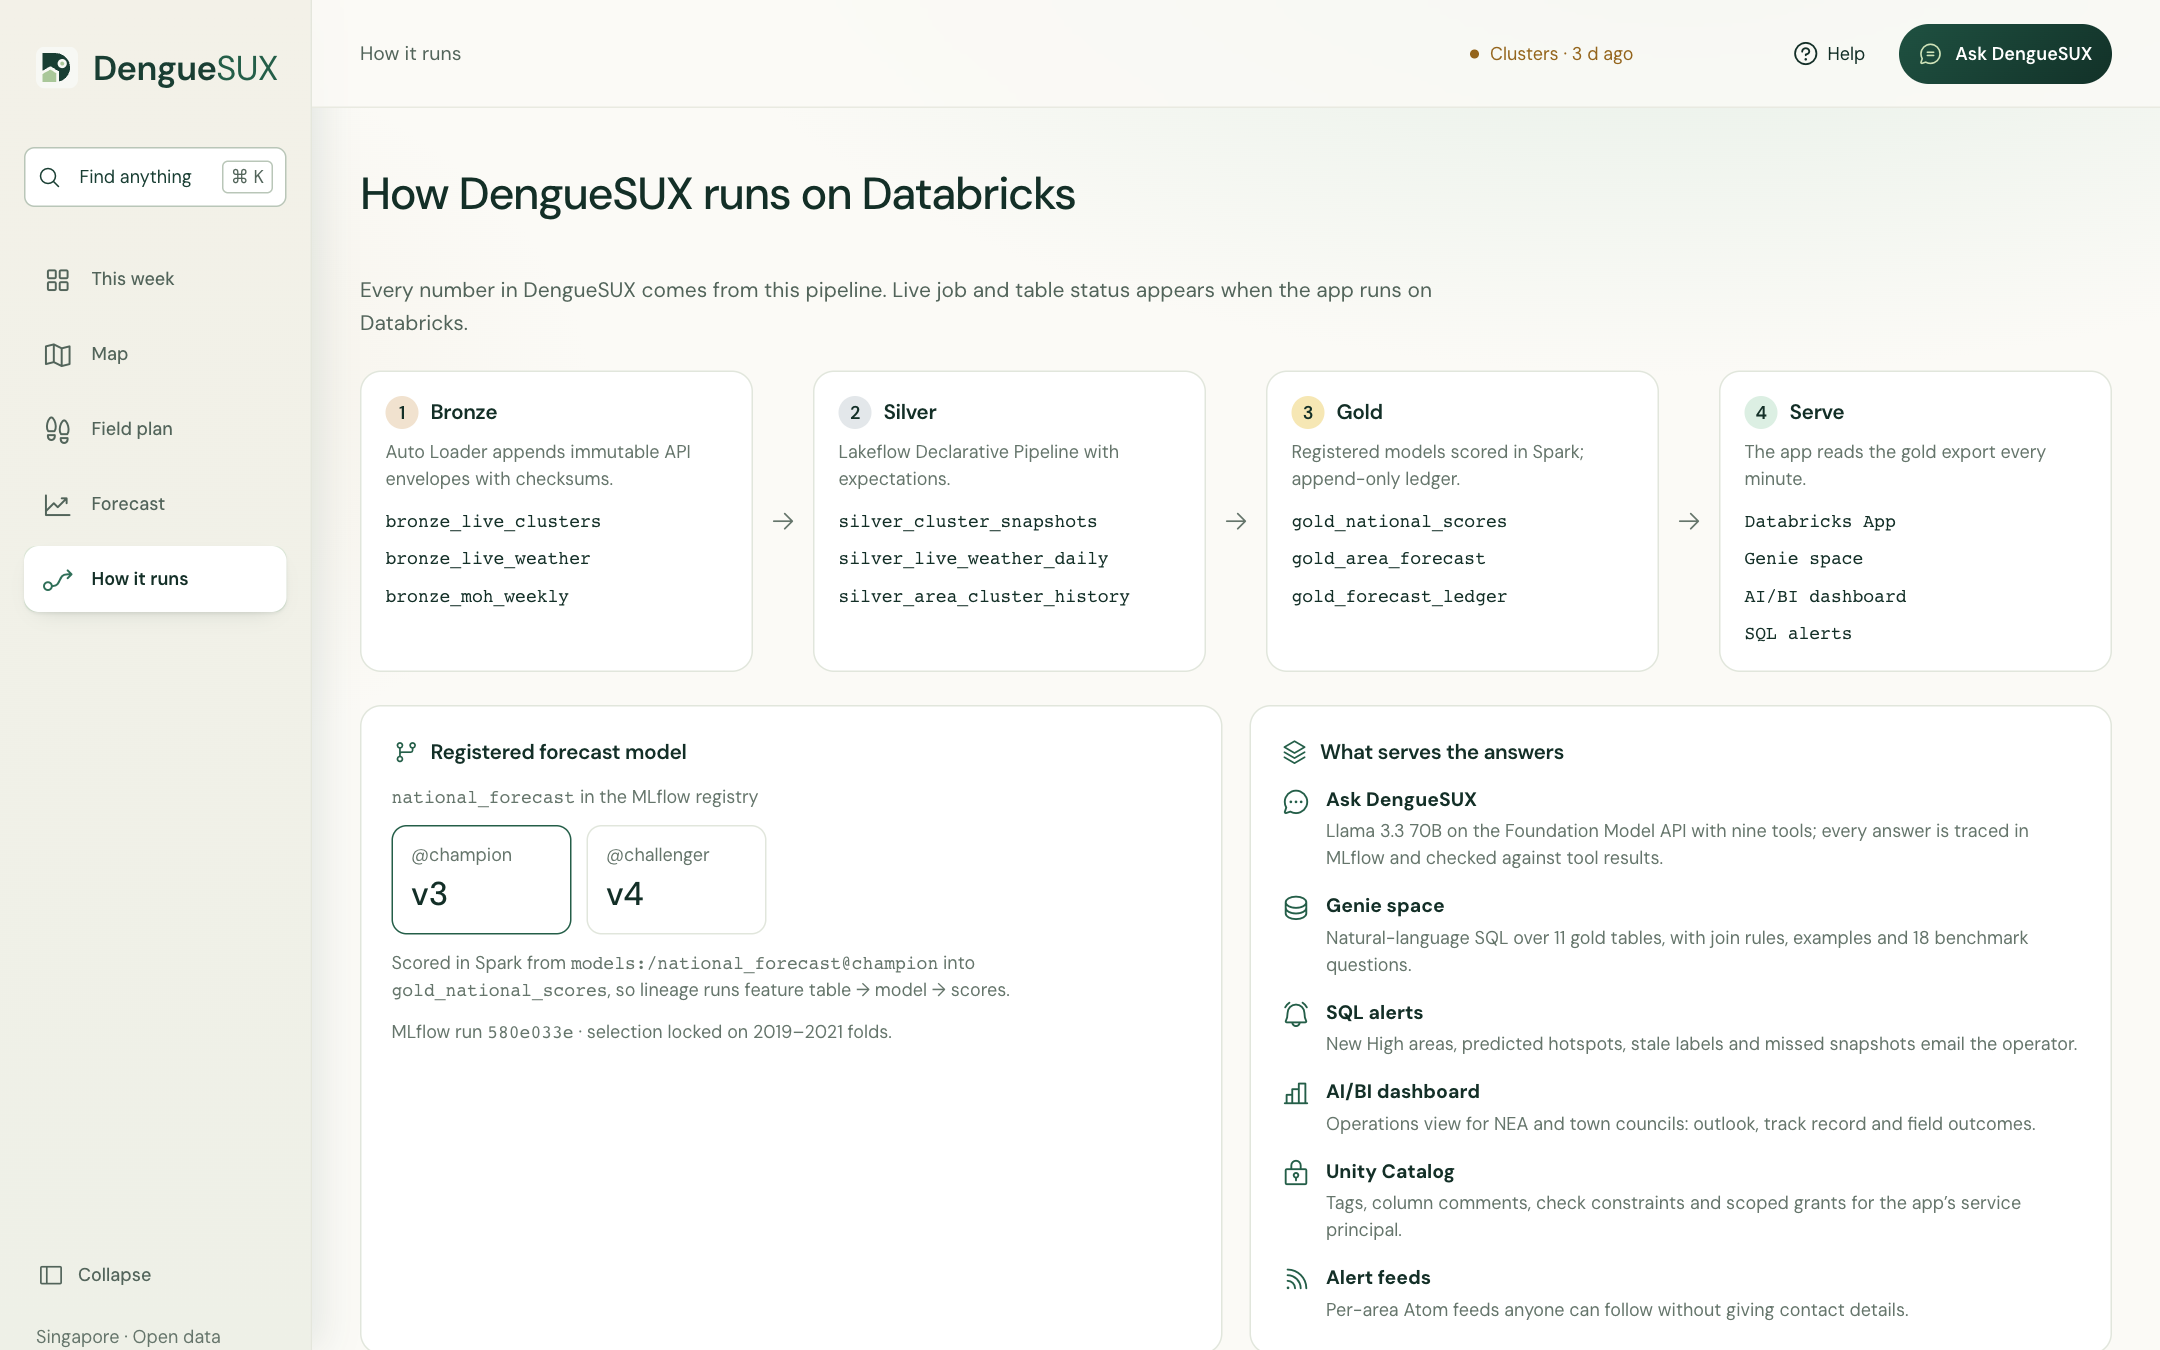
- Ingest: a daily job snapshots NEA's clusters and lands official weather in a Volume; Auto Loader appends to bronze Delta tables with receipts and checksums. A Lakeflow Declarative Pipeline checks every live reading and cluster row with expectations.
- Transform (PySpark → Delta): 5-minute weather rolls up into MOH's Sunday–Saturday weeks; gaps are flagged, never zero-filled; clusters join to planning areas, HDB blocks and nearby places.
- Govern (Unity Catalog): gold tables carry check constraints, tags and Change Data Feed; the forecast ledger is append-only; a metric view sits over it; lineage and 30-day cost are read from system tables and shown in the app.
- Model (MLflow): three fixed candidates (four-week average, Ridge, gradient boosting) competed across 39 rolling windows in 2019–2021. Models are registered in Unity Catalog with
@championand@challenger, and a promotion gate stops a worse retrain from going live. The area outlook is registered asarea_outlook@champion. - AI Functions:
ai_translateback-translates every non-English notice andai_similarityscores it against the English draft;ai_classifythemes field-report notes;ai_forecastis benchmarked against our model in one SQL query. - Serve: a Databricks App (FastAPI, MapLibre, three.js), a Genie space, an AI/BI dashboard, four SQL alerts and a Telegram bot. An in-app "How it runs" page reads job runs, table history, the pipeline event log and the model registry live.
Evidence, honestly
- National, 196 weeks since 2023: 28.7 people a week of error vs 31.9 for a four-week average. A Diebold–Mariano test says that 10% edge could be chance (p = 0.26). Against the same week last year: 29 vs 213. The 80% range held 79% of the time.
- One-query benchmark, 89 weeks of 2025–26: DengueSUX 14.4, four-week average 14.7,
ai_forecaston log counts 33.1, rawai_forecast81.8. - Area outlook, 1,100 examples (leave one year out): Brier 0.110 vs 0.136 for "stays the same" and 0.111 for a fair probabilistic persistence, so about level on calibration. The edge is ranking (AUC 0.96 vs 0.92) and new hotspots: 12 of 44 areas that newly turned High were flagged ahead, at the cost of 20 false alarms.
- Assistant: a 28-case MLflow genai evaluation scored 100% grounded, 93% on behaviour, 96% on not giving diagnoses and 86% on honest uncertainty.
Challenges we ran into
- No local case history. data.gov.sg keeps only today's cluster file. We rebuilt area history from Internet Archive captures of NEA's own listing page, parsing two page layouts and placing each listed block on official HDB footprints or exact OneMap road names.
- Weekly counts that stop in 2022. We continued the series with official MOH/CDA workbooks and checked the overlap: within 4 people a week.
- Weather mattered less than we expected. 2023-onward error is 28.7 with weather and 28.5 without it. We report that instead of overselling weather.
- Making 3D honest. HDB footprints use street codes while storey counts use street names. We resolved 625 of 660 codes with exact checks; blocks we could not verify stay flat.
- Residents can't sign in to a workspace app. Posters, share cards and Telegram point to a static public site instead.
Accomplishments that we're proud of
- An end-to-end platform on real data: open data → Delta → MLflow and Unity Catalog → a doorstep route, a resident notice and a Telegram alert
- Every planning area covered: 55 of 55 with a walk or flyover, 311 places to check, about 32,400 HDB flats along the routes, 220 checked notices
- A tool that says what it knows and what it doesn't, which is what a public-health tool needs to be trusted
What we learned
- Recent cases carry most of the early-warning signal; weather adds context but did not improve later-period error
- Most of the work is data engineering: calendars, gaps, addresses and duplicates
- For non-technical users, one clear sentence ("Check Jurong West first") beats ten charts
What's next for DengueSUX
- A four-week pilot with one town council: plans, posters and field reports, measured against the previous month, with the ledger scoring every outlook
- Native-speaker review of every translation before any notice is posted
- Keep collecting daily snapshots so the area outlook trains on more history each week
Built With
- data.gov.sg
- databricks
- delta-lake
- duckdb
- fastapi
- genie
- leaflet.js
- mlflow
- onemap
- pyspark
- python
- scikit-learn
- shap
- unity-catalog

Log in or sign up for Devpost to join the conversation.