-
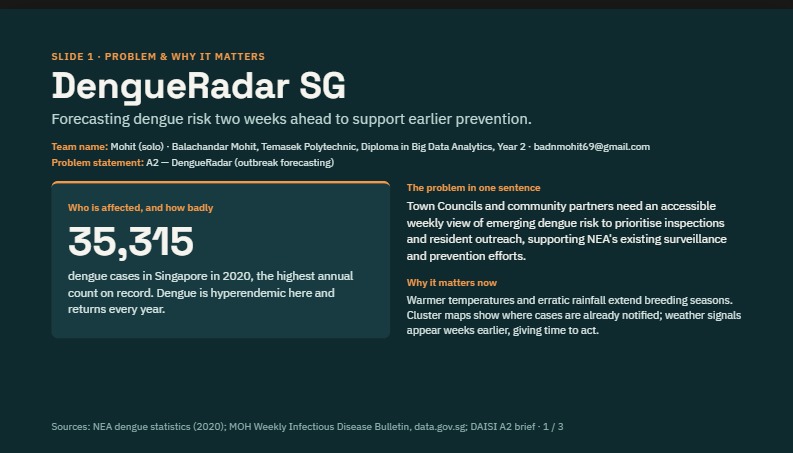
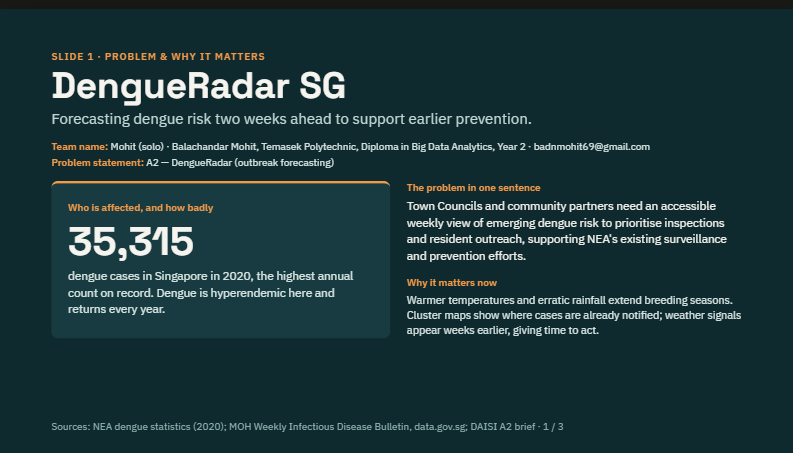
DengueRadar SG: a two-week dengue risk forecast that helps Town Councils decide where to inspect and do outreach first.
Inspiration
Dengue is hyperendemic in Singapore. In 2020, there were 35,315 cases, the highest on record. Today's response is mostly reactive: dengue clusters appear on the map only after cases are notified, when mosquitoes have already been breeding for weeks. Rain and heat affect case counts weeks later, and that lag is an early-warning signal we can use.
What it does (proposed)
DengueRadar SG gives Town Councils and community partners a ranked weekly action list, supporting NEA's existing surveillance and prevention efforts.
- Forecast: estimates dengue risk two weeks ahead using past case counts, weather lags and seasonality, at the geographic level that verified data supports.
- Prioritise: combines forecast risk with population exposure and a senior-outreach weighting.
- Explain & act: shows what is driving each risk score and produces a ranked list of areas for human review.
Intended impact: help Town Councils identify their five highest-priority inspection or outreach areas each Monday.
Data (data.gov.sg / SingStat)
- MOH Weekly Infectious Disease Bulletin: national weekly case counts, 2012–2022
- NEA Dengue Clusters (GeoJSON): live clusters, snapshotted daily
- NEA Rainfall and Air Temperature: real-time APIs and historical records
- NEA Dengue Cases by Region (GeoJSON): historical coverage still to be verified
- URA Master Plan 2019 planning areas and SingStat residents by planning area and age
How we will build it on Databricks
Lakeflow Jobs for scheduled ingestion → Delta tables in Unity Catalog (bronze/silver/gold) → PySpark feature engineering → a four-week moving-average baseline compared with LightGBM, tracked in MLflow → an AI/BI dashboard with a risk map and the weekly action list. Stretch goals: Genie Q&A and LLM-written briefs.
Validation plan
Rolling chronological back-tests against a four-week moving-average baseline, measuring MAE, high-risk recall and false-alarm rate, using only data available at each forecast date.
Challenges
Area-level historical case data may be limited. If so, the prototype will pair a back-tested national forecast with a clearly labelled local prioritisation index, without claiming validated local forecasts.
What I learned
How to scope a real public-health problem around the data that is actually available, and how to plan an end-to-end Databricks pipeline from raw open data to a decision.
Built With
- data.gov.sg
- databricks
- delta-lake
- lightbgm
- mlflow
- pyspark
- python
- unity-catalog

Log in or sign up for Devpost to join the conversation.