-
-
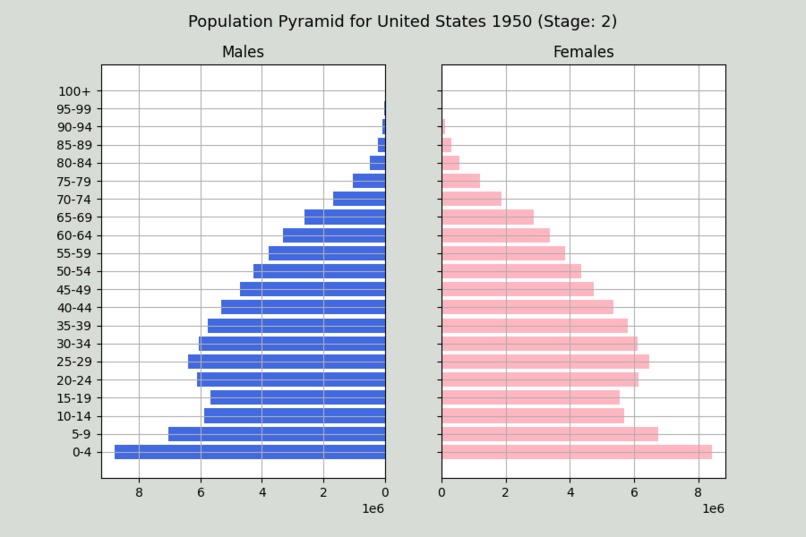
USA in Stage 2
-
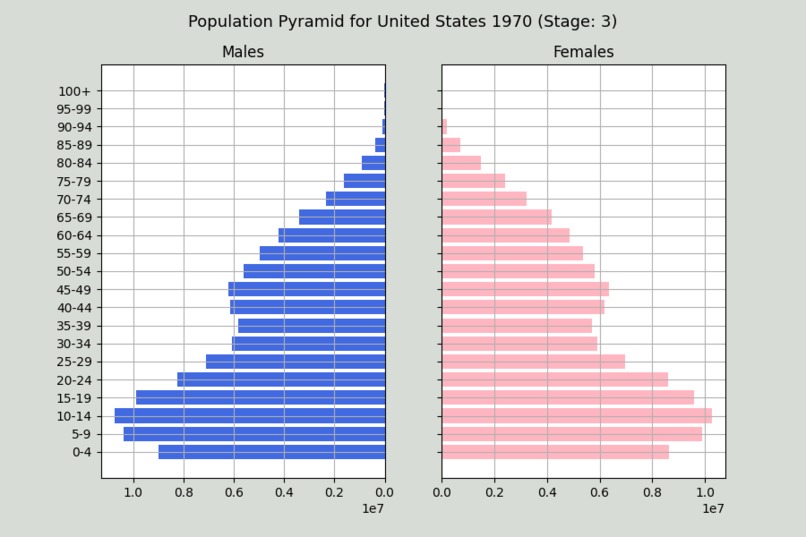
USA in Stage 3
-
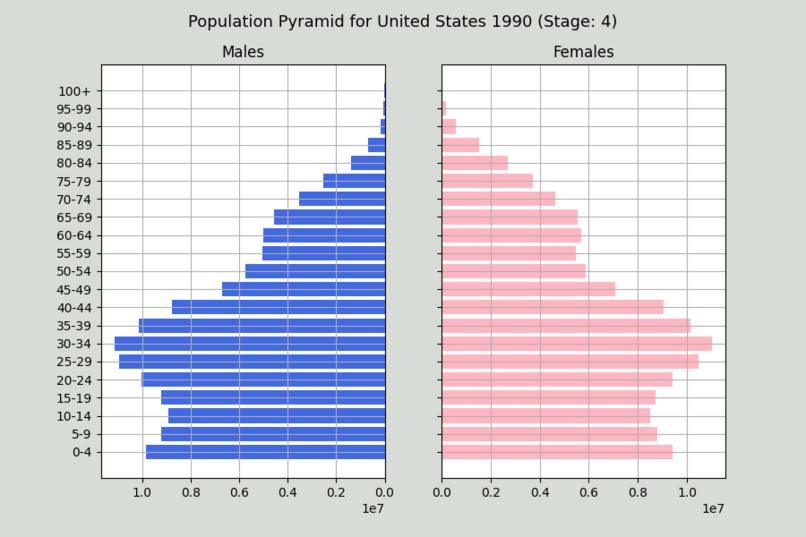
USA in Stage 4
-

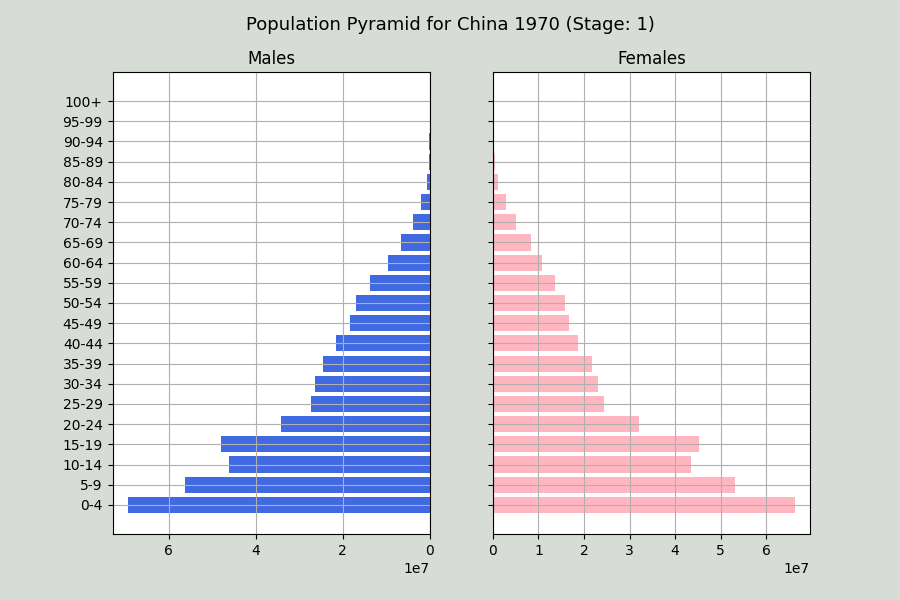
China in Stage 1
-

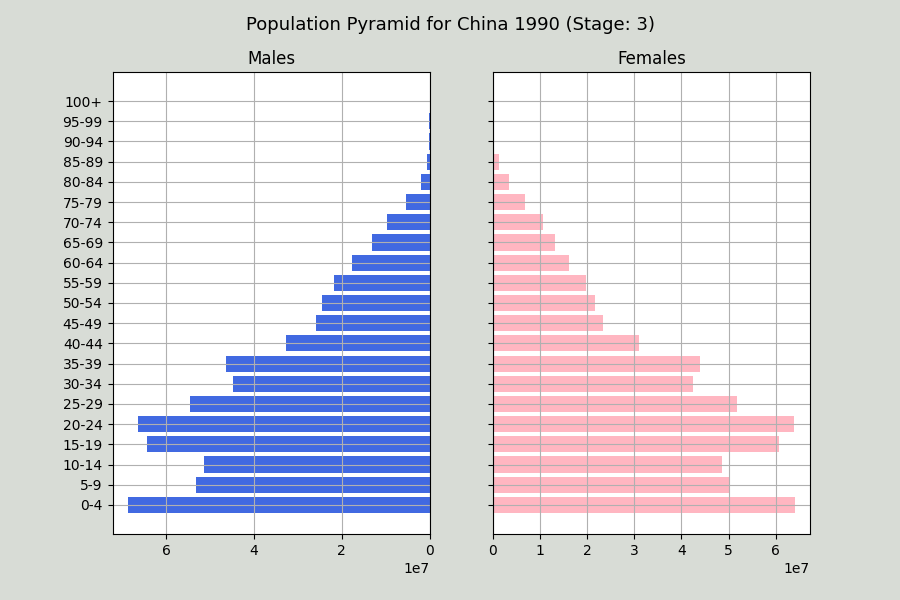
China in Stage 3


Inspiration
Our inspiration for creating a Demographic Transition Model visualizer is to show the impact of what industrial development does for a country. If it were not for the advancements in medicine, agriculture, and other technologies, the projected life expectancy of an average adult would be much lower than what it is today. Instead of taking these advancements for granted, we wanted to highlight the drastic impact they have played in shaping a country's past, present, and future.
What it does
The program provides the users with demographic transition models of five chosen countries (Russia, USA, UK, India, and China) in the years 1950-2020. Users are also able to see which stage (pre-industrial, transition, industrial, and post-industrial) of population development the chosen country is experiencing during a certain year in the range.
How we built it
We used PyCharm by JetBrains to create a Python GUI interactive model.
Challenges we ran into
We ran into a couple of issues with the GUI. We had trouble updating it after we change the input values: the year and country. However, after researching more on this issue, we were able to fix it and generate new graphs as the user submits a change. We also had some issues determining an algorithm to use to classify the stages. However, after some statistical work and recollection of mathematical algorithms, we found an algorithm to best predict the stage of a country.
Accomplishments that we're proud of
We are proud of everything that we worked on throughout the course of this Hackathon, but the most important aspect of our program that we would like to shed some light on is our data analysis algorithm. The algorithm is able to parse the demographic transition model of a country in a certain year and calculate which stage of population development the country is in.
What we learned
Hackathons are a great way to reinforce one's technical skills and gain hands on experience with several aspects of programming. During our time at Boilermake IX, we were able to advance our skills in Python and the several Python packages that we used. Furthermore, our understanding of algorithmic and mathematical logic was put to the test when we worked on the functions that calculated the population development stage of a country.
What's next for Demographic Transition Model Visualizer
The next step for our project is to expand the selection of country case studies available from the current five of USA, India, UK, Russia, and China to more countries around the world in order to give our users a more complete picture of demographic transitions occurring around the world. We also plan on refining our data analysis to be able to handle more complex DTMs.
Built With
- pycharm
- python


Log in or sign up for Devpost to join the conversation.