-
-
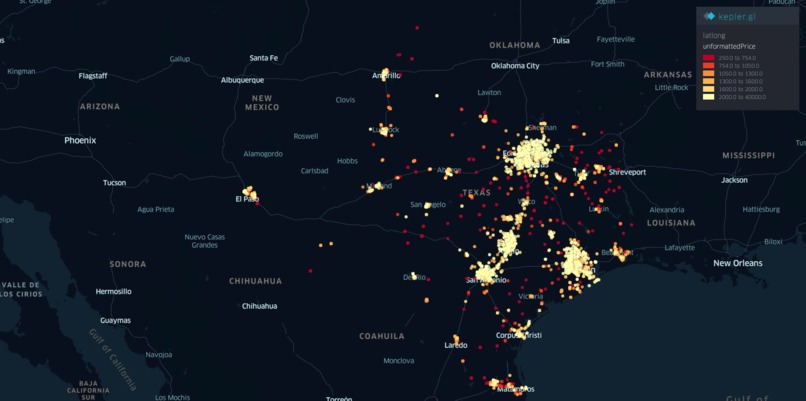
Figure 1. Full Map of Texas and its Current Rental Listings on Zillow
-
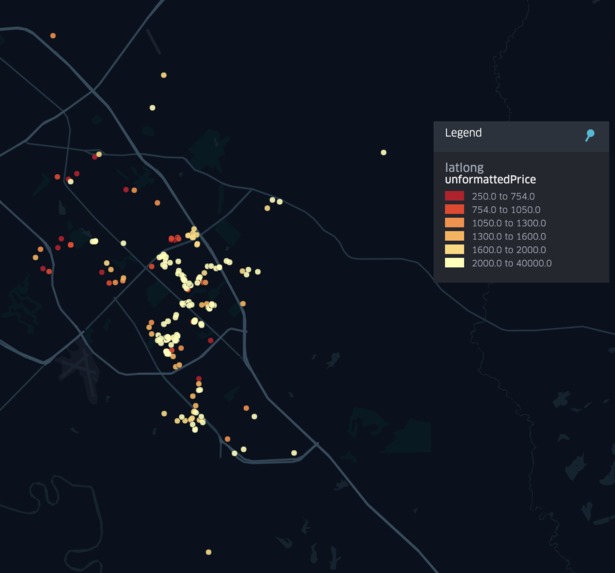
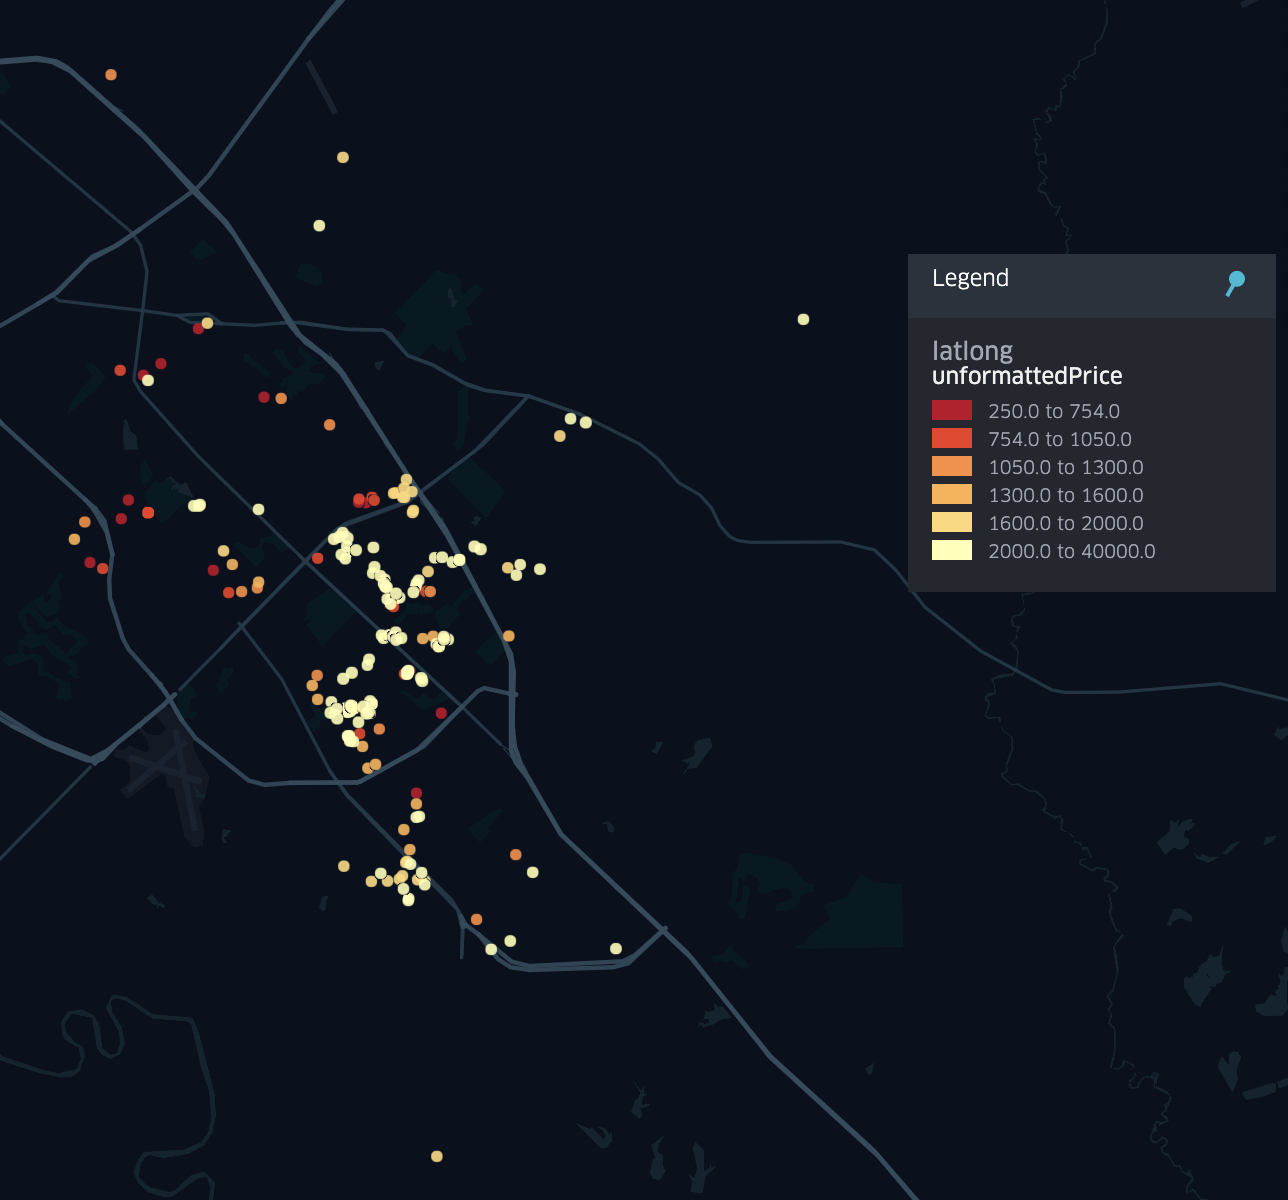
Figure 2. Zoomed-in Zillow Rental Prices for Bryan-College Station
-
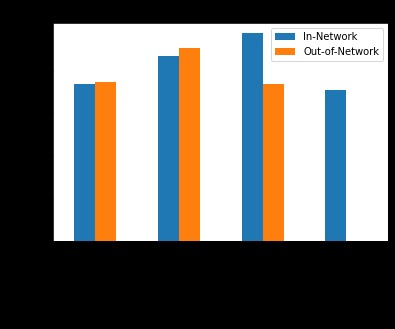
Figure 3. Comparison of ER Visit Costs in Metropolitan Cities
-
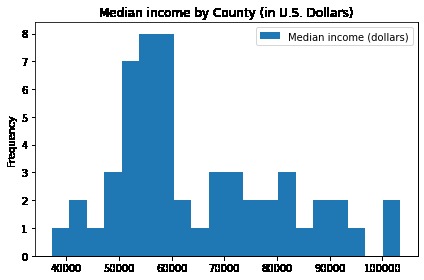
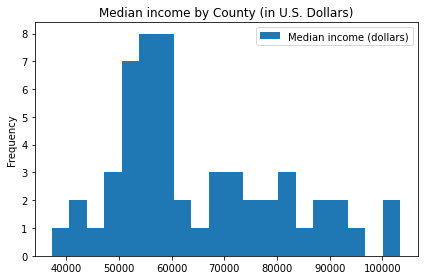
Figure 4. Median Income by County for Texas
-
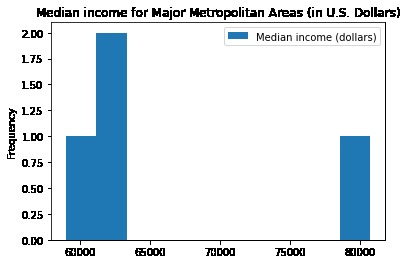
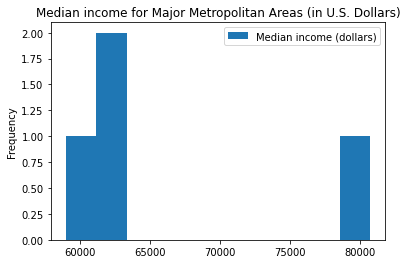
Figure 5. Comparison Median Income by the Four Major Metropolitan Areas Highlighted in figure 3


Demo-GRAPH-ics
Elaine Mo, Ylan Nguyen, Sophia Stutes, Melissa Zhang
Approach to the Problem
Taking TAMU Datathon’s Data Synthesis Challenge into consideration, we wanted to use our knowledge of API calls and web scraping to collect recent data related to the Cost of Living across the state of Texas during COVID times. The three considerations for Cost of Living we wanted to gather data for include recent rental prices for current rental listings, established demographics of location from the census, and known healthcare costs. Our focus on gathering more recent data related to rentals is due to the fact that these prices are easily accessible and are able to reflect changes quicker than healthcare and demographics alone.
Data Gathering
Throughout our data gathering process, we made sure each data set included zip codes which we (and others) could potentially use as keys to connect all the data sets together.
Rental Prices (Zillow)
Zillow is the leading real estate and rental website in the United States, with 36 million visits a month as of October 2021 [1]. Due to this, we chose Zillow as the platform to grab information from due to the large quantity of data and information provided with its reputation as the leading real estate website.
Initial Approach
Initially, our strategy was to use Zillow’s official API to retrieve data. However, we realized quickly that even though the documentation and sign up for this API were still available, the actual service was actually deprecated. From there, we then planned to instead web scrape the Zillow web page. This method eventually also led to a roadblock as Zillow uses JavaScript to update their site information. This means that typical web scraping libraries are unable to scrape Zillow with the information we need.
Final Methodology
For gathering data on housing in Texas, we decided to reverse-engineer the Zillow API utilized by the Zillow web page. Using a list of 3-character geohashes encompassing Texas, we looped through each one. In each loop, we utilized the python-geohash Python library to convert the geohashes into longitude and latitude coordinates for the cardinal directions, creating the bounding box parameter we needed. This bounding box was then passed into the Zillow API GET request we found, returning with the JSON response we needed. Looking in the listResults section with all the rental listings on Zillow, we then extracted the data we found, concatenated all data with the pandas Python library, dropped unnecessary columns normalized by pandas, and exported everything as a csv. This csv was then used as our final dataset result for rental prices.
Reasoning behind the Data
The columns we decided to use were based on information which related to price, location, and housing descriptions (such as number of bedrooms, bathrooms, area, housing type, and apartment unit descriptions).
Demographic Data (Census)
Methodology
The US Census Bureau has the most complete and accurate information about demographics. That is why we chose to collect data from the US Census. The Census data contains many thousands of columns worth of data, across all the US, so we had to isolate the columns and locations that were useful to us. Through the Census site, we were able to download .csv files for data on counties in Texas. Selecting columns involved manually reading through the columns of each .csv we downloaded from the Census site, and extracting the columns that we needed. The Census data is organized by county, so we would also have to approximate this data into ZIP codes to line up with the rest of our data.
Reasoning behind the Data
We chose columns that reflected general demographic data, such as age, sex, and race, to allow us to do analyses that may involve this data. We also chose columns that are relevant to a person’s quality of life, such as income, health insurance, and employment.
Healthcare Costs
Methodology
We extracted from the Texas Department of Insurance. We selected a few charges that would be comparable across different locations, and took the average to create an aggregate value. We also split the charges by In-Network insurance and Out-Of-Network insurance where the data was available, since costs for the same operation or procedure in the same location could vary depending on this. The data was given by Geo ZIPs, which were groupings of ZIP codes, so we had to remap this data accordingly.
Reasoning behind the Data
We focused on ER visit costs, since it is a medical service that was needed universally across the state. This would give us the most data and be comparable across ZIP codes.
Meaning of Data Visualization, its Usage, and its Interpretation

Figure 1. Full Map of Texas and its Current Rental Listings on Zillow

Figure 2. Zoomed-in Zillow Rental Prices for Bryan-College Station
With the maps shown above, Kepler.gl was used to take the Zillow rental data set, which was formatted into a csv, and map out the data in a visible map of Texas. Provided in our submission is also the interactive map of the state with this data, in which the user can zoom in and out and scroll through the map to find rental prices in certain areas, along with the other details provided per data point.

Figure 3. Comparison of ER Visit Costs in Metropolitan Cities
With our data, it’s possible to make comparisons between factors affecting cost of living across various cities, such as this comparison between ER Visit costs shown between the 4 major metropolitan cities in Texas.

Figure 4. Median Income by County for Texas

Figure 5. Comparison Median Income by the Four Major Metropolitan Areas Highlighted in figure 3
Additionally, the high rental prices seen in figure 1 and high healthcare in figure 3 can clearly be correlated to the high income in these areas.
Reflection
Challenges
There were several challenges during our time trying to extract the data necessary. Many of them will be bulleted and summarized below:
Zillow
- Due to Zillow’s public API being deprecated, we had to manually figure out how the API used by Zillow’s website worked. This involved a lot of challenges including figuring out how the API handled pagination, getting around CAPTCHA requirements, and making sure that Zillow actually returned all the listings they counted in their total (since the list results given as a response is dependent on the map parameters).
Demographic Data
- The Census Bureau data site was somewhat difficult to navigate. We could not find a way to download a complete dataset at once or automate accessing the data we needed, so we had to dedicate some time to manually clicking through the site and downloading each .csv that contained data we needed, as well as combining these files later on.
- Initially, we found a Beta feature where it was possible to select specific data points and put them into a single table. This seemed extremely promising, but we found that this site was very limiting and slow to navigate. There was a cap on the number of rows and columns allowed in a single table download, so we could only get a few data points at each download. Selecting the geographic location did not have a select all option, so someone had to manually click to select all 200+ counties in Texas. Ultimately we abandoned this approach since it caused us too much frustration.
- We ended up using the premade tables that the Census Bureau had already created. This involved trying to find tables that contained the data we needed and downloading the .csv. Then we had to extract the relevant columns, and combine them into a single .csv file with only the columns we needed.
Healthcare Costs
- A significant amount of the data was incomplete or not available for whatever reason. This created some difficulty in determining a useful metric for comparing healthcare costs.
Restaurant Price Data
- We attempted to also retrieve restaurant price data from GrubHub. However, we ran into issues when it came to retrieving all the restaurant data from multiple cities. As such, we didn’t have enough time to present a complete data set for this.
Given More than 24 Hours
If given more time, we would expand our data to include rental, demographic, and healthcare information for all US locations, not just within Texas. Additionally, we would have more time to scrape data for restaurant food prices from services such as Doordash, Ubereats, and GrubHub.
Work Cited
[1] Statista Research Department. (2021, October 4). Most popular real estate websites in the U.S. By Visits, 2021. Statista. Retrieved October 17, 2021, from https://www.statista.com/statistics/381468/most-popular-real-estate-websites-by-monthly-visits-usa/


Log in or sign up for Devpost to join the conversation.