-

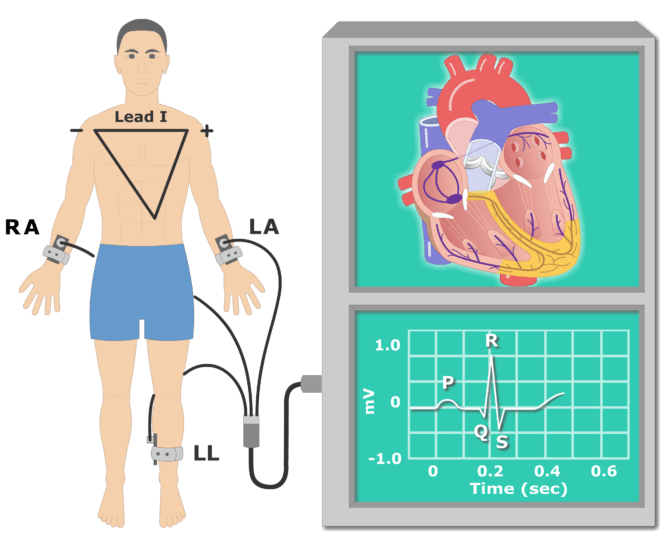
ecg monitoring
-

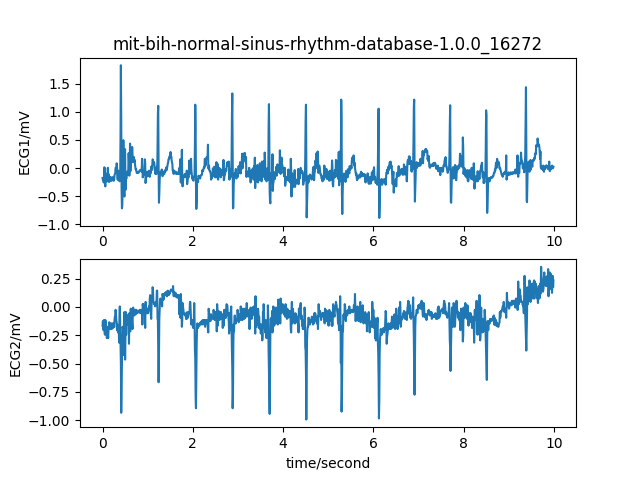
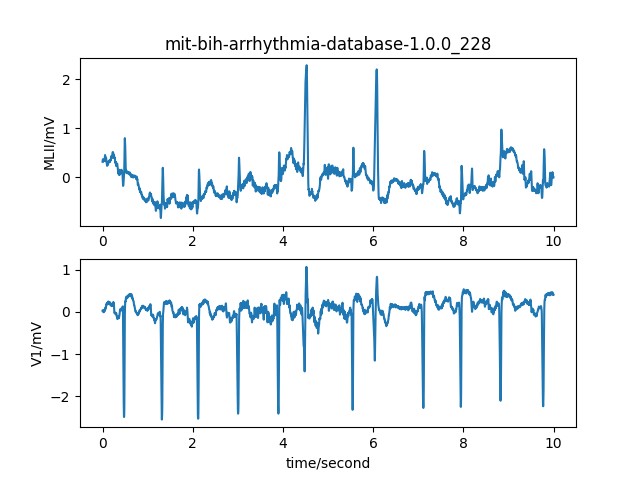
a sample of ECG signals
-

a sample of ECG signals
-
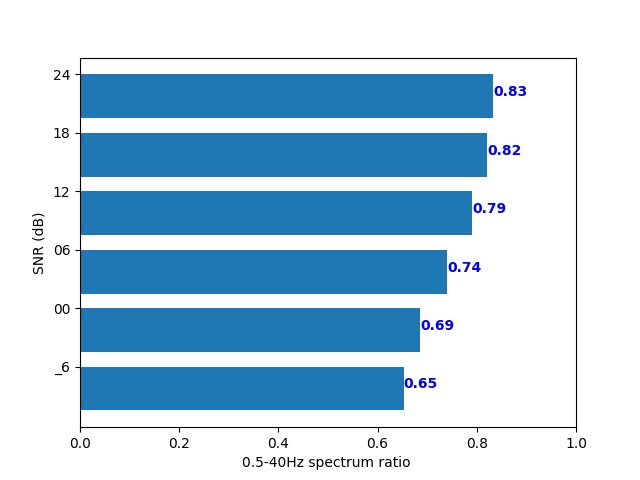
The spectral energy ratio as signal quality index shows positive correlations with SNR.

Inspiration
- ECG signals are important for health status assessment, however, it is susceptible to motion artifacts and noise and interference from the background.
- We observe that ECG signals of good quality show continuity and sinusoidal patterns in time domain, thus condensed energy distribution in frequency domain.
- With a simple heuristic, we can design an effective signal quality index, based on the ECG signal patterns.
What it does
- After loading the datasets from PhysioNet, we automate the preprocessing and spectral analysis to produce intermediate data for observation and understanding the patterns of ECG signals.
- We use the ratio of the spectral energy of the spectrum of heart rate and its harmonics (0.5-40Hz) to the total spectral energy as the quality index.
- We demonstrate the effectiveness of this quality index by showing correlations with the SNR.
How we built it
- We write the end-to-end pipeline with Python. Libraries being used include 'numpy', 'os', 'wfdb', 'time', 'matplotlib'.
- 'os' library is used to automate accessing different data sessions;
- 'time' library is used to measure time elapsed for each processing step, thus identifying the bottleneck of efficiency.
- 'wfdb' library is used to access and analyze ECG data from PhysioNet;
- 'numpy' library is used to implement signal processing pipeline;
- 'matplotlib' library is used for visualization, which is important for collecting observations and understanding the signal patterns before we can devise heuristics.
Challenges we ran into
- No domain expertise about how to interpret ECG signals.
- Need to read through data description to find out parameters, such as sampling rate, for further processing.
- No experience with PhysioNet datasets. Need to find a way to decipher the data before we can analyze the signal patterns.
- Data size is huge. It takes so much time to wait for completing before I can make observations and take further steps to process ECG signals.
Accomplishments that we're proud of
- We systematically examined ECG signals from different time scales.
- We developed automated end-to-end pipeline to process ECG data from PhysioNet database.
- We verified the hypothesis that spectral energy ratio is indicative of signal quality, which shows positive correlation with SNR of respective signals with difference levels of motion artifacts.
- We delved deep into the pipeline to understand the bottleneck of efficiency in addition to visualization of signal patterns and the effectiveness of signal quality index.
What we learned
- We learned how to load and analyze datasets from PhysioNet;
- We learned how to interpret and analyze ECG signals;
- We learned how the motion artifacts would disturb ecg signals.
- We learned a simple but effective way to quantify quality of ECG signals based on a heuristic that ECG signals of good quality have condensed spectral energy distribution around the spectrum of heart rate and its harmonics.
What's next for Delving deep into ECG signal quality assessment
- Apply parallel computing with GPU to further improve efficiency;
- We can leverage DL models to achieve signal quality assessment and reconstruction, for example, autoencoder.
- We can further leverage DL models to detect and quantify health conditions.
- We will develop real-time prototype for demo and open source the design for wider benefits.
Built With
- physionet
- python


Log in or sign up for Devpost to join the conversation.