-
-
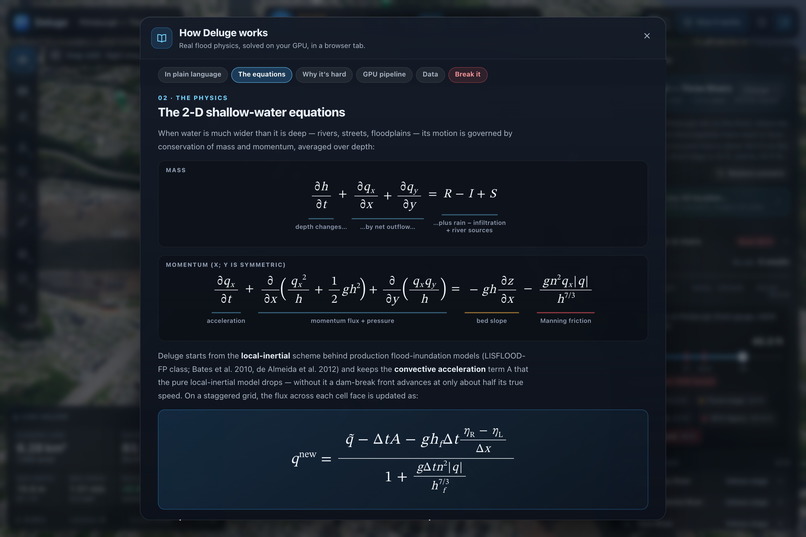
2-D shallow-water equations solved in WGSL: local-inertial scheme with momentum and flux updates.
-
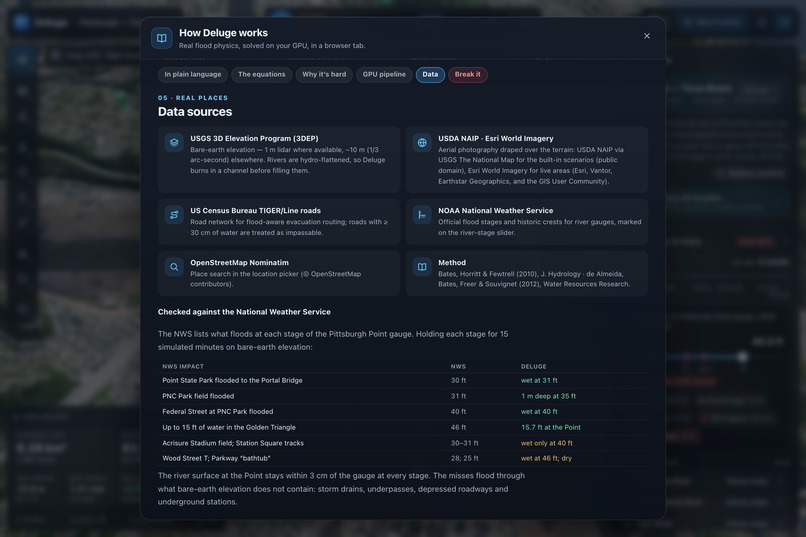
2-D shallow-water equations solved in WGSL: local-inertial scheme with momentum and flux updates.
-
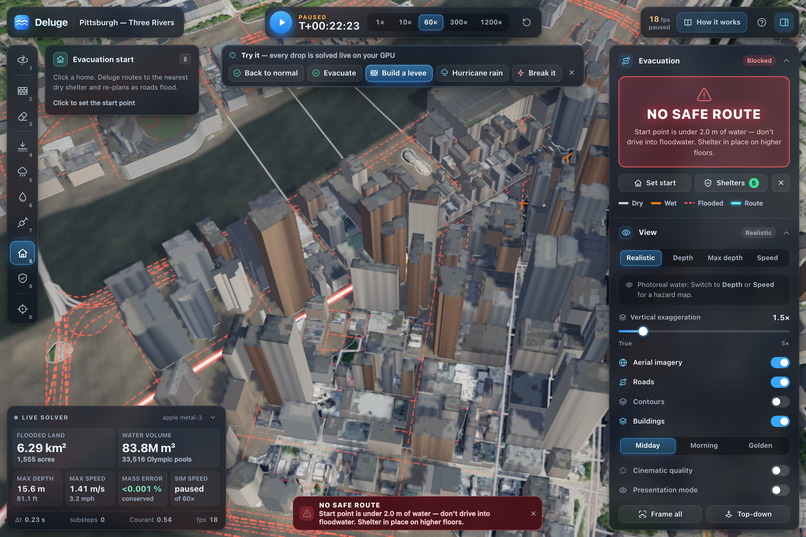
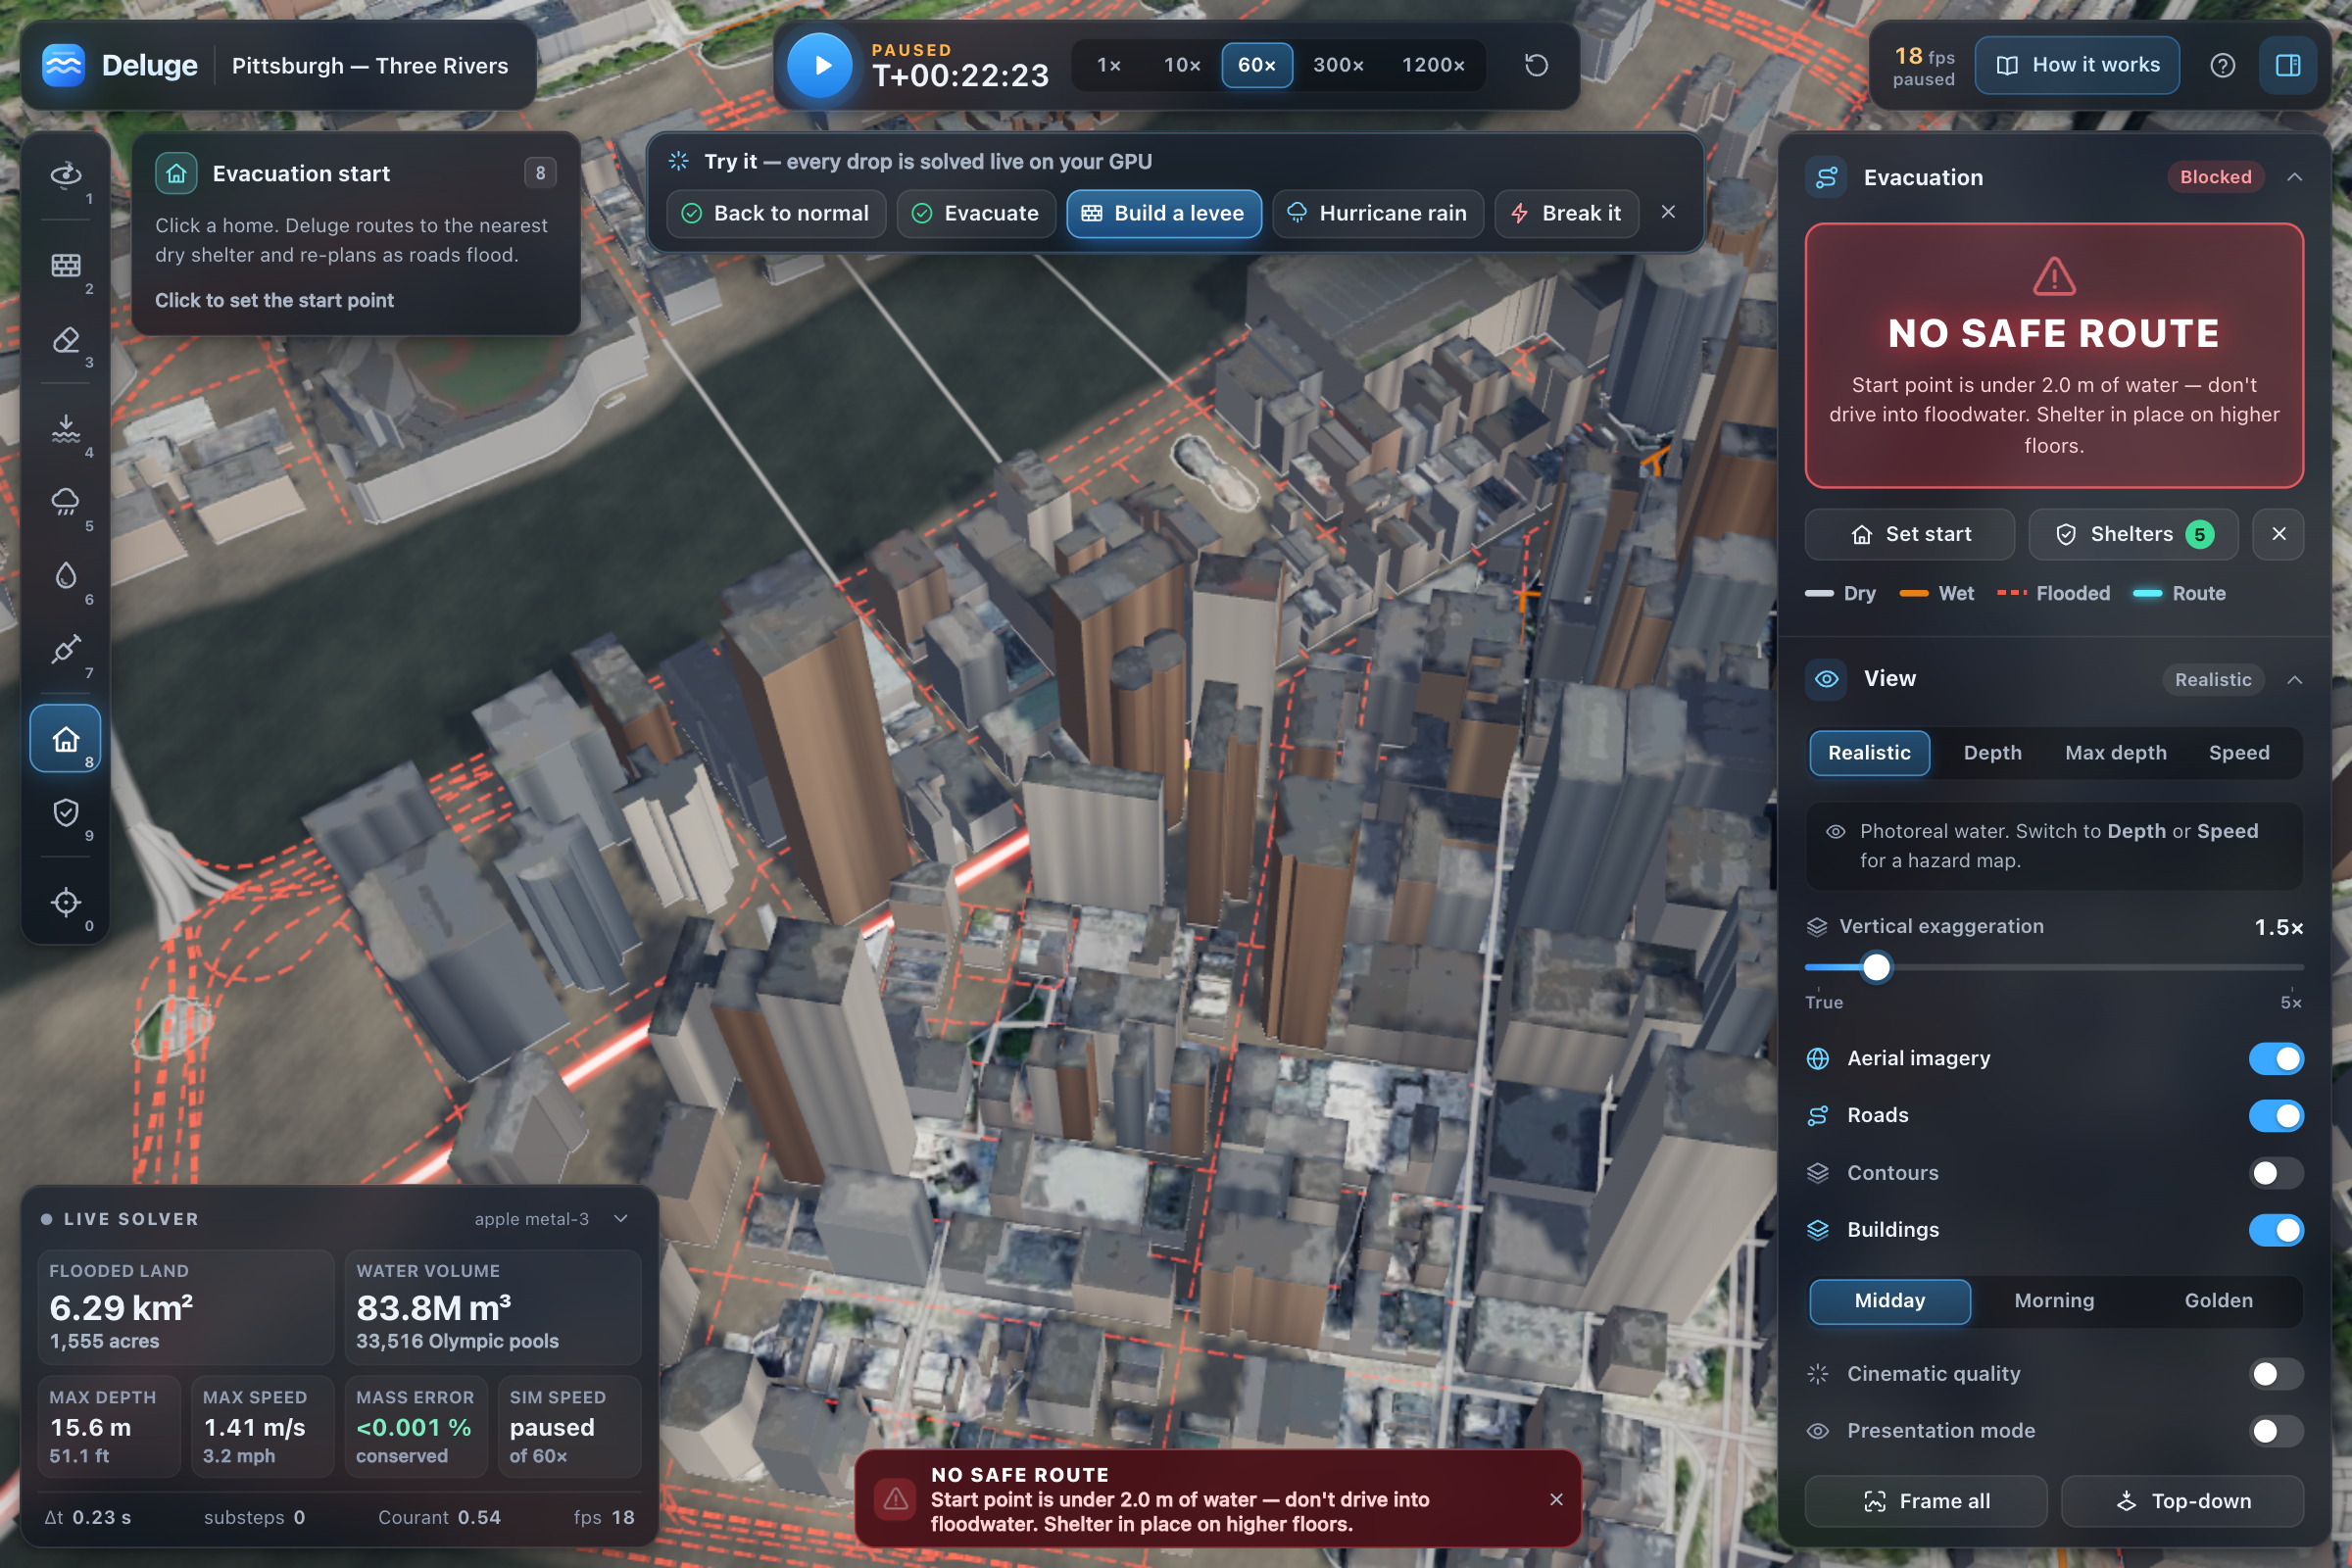
Underwater start point gets refused: no confident wrong answer here, just shelter-in-place advice.
-
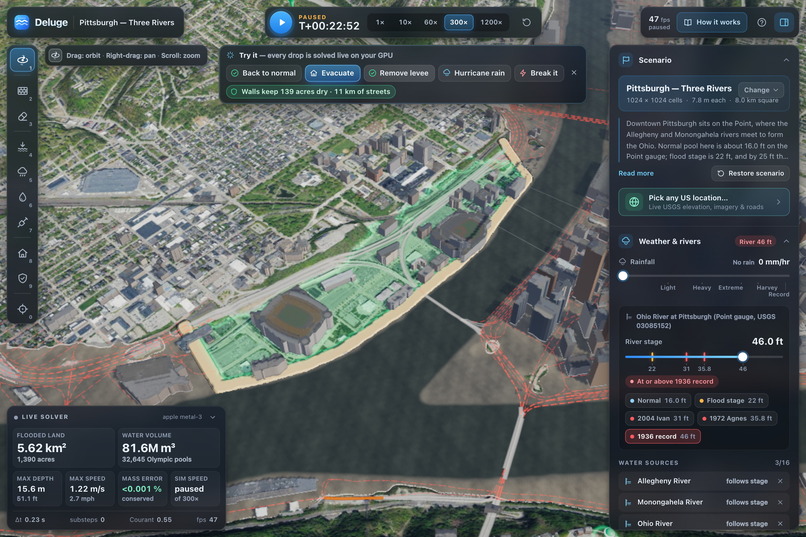
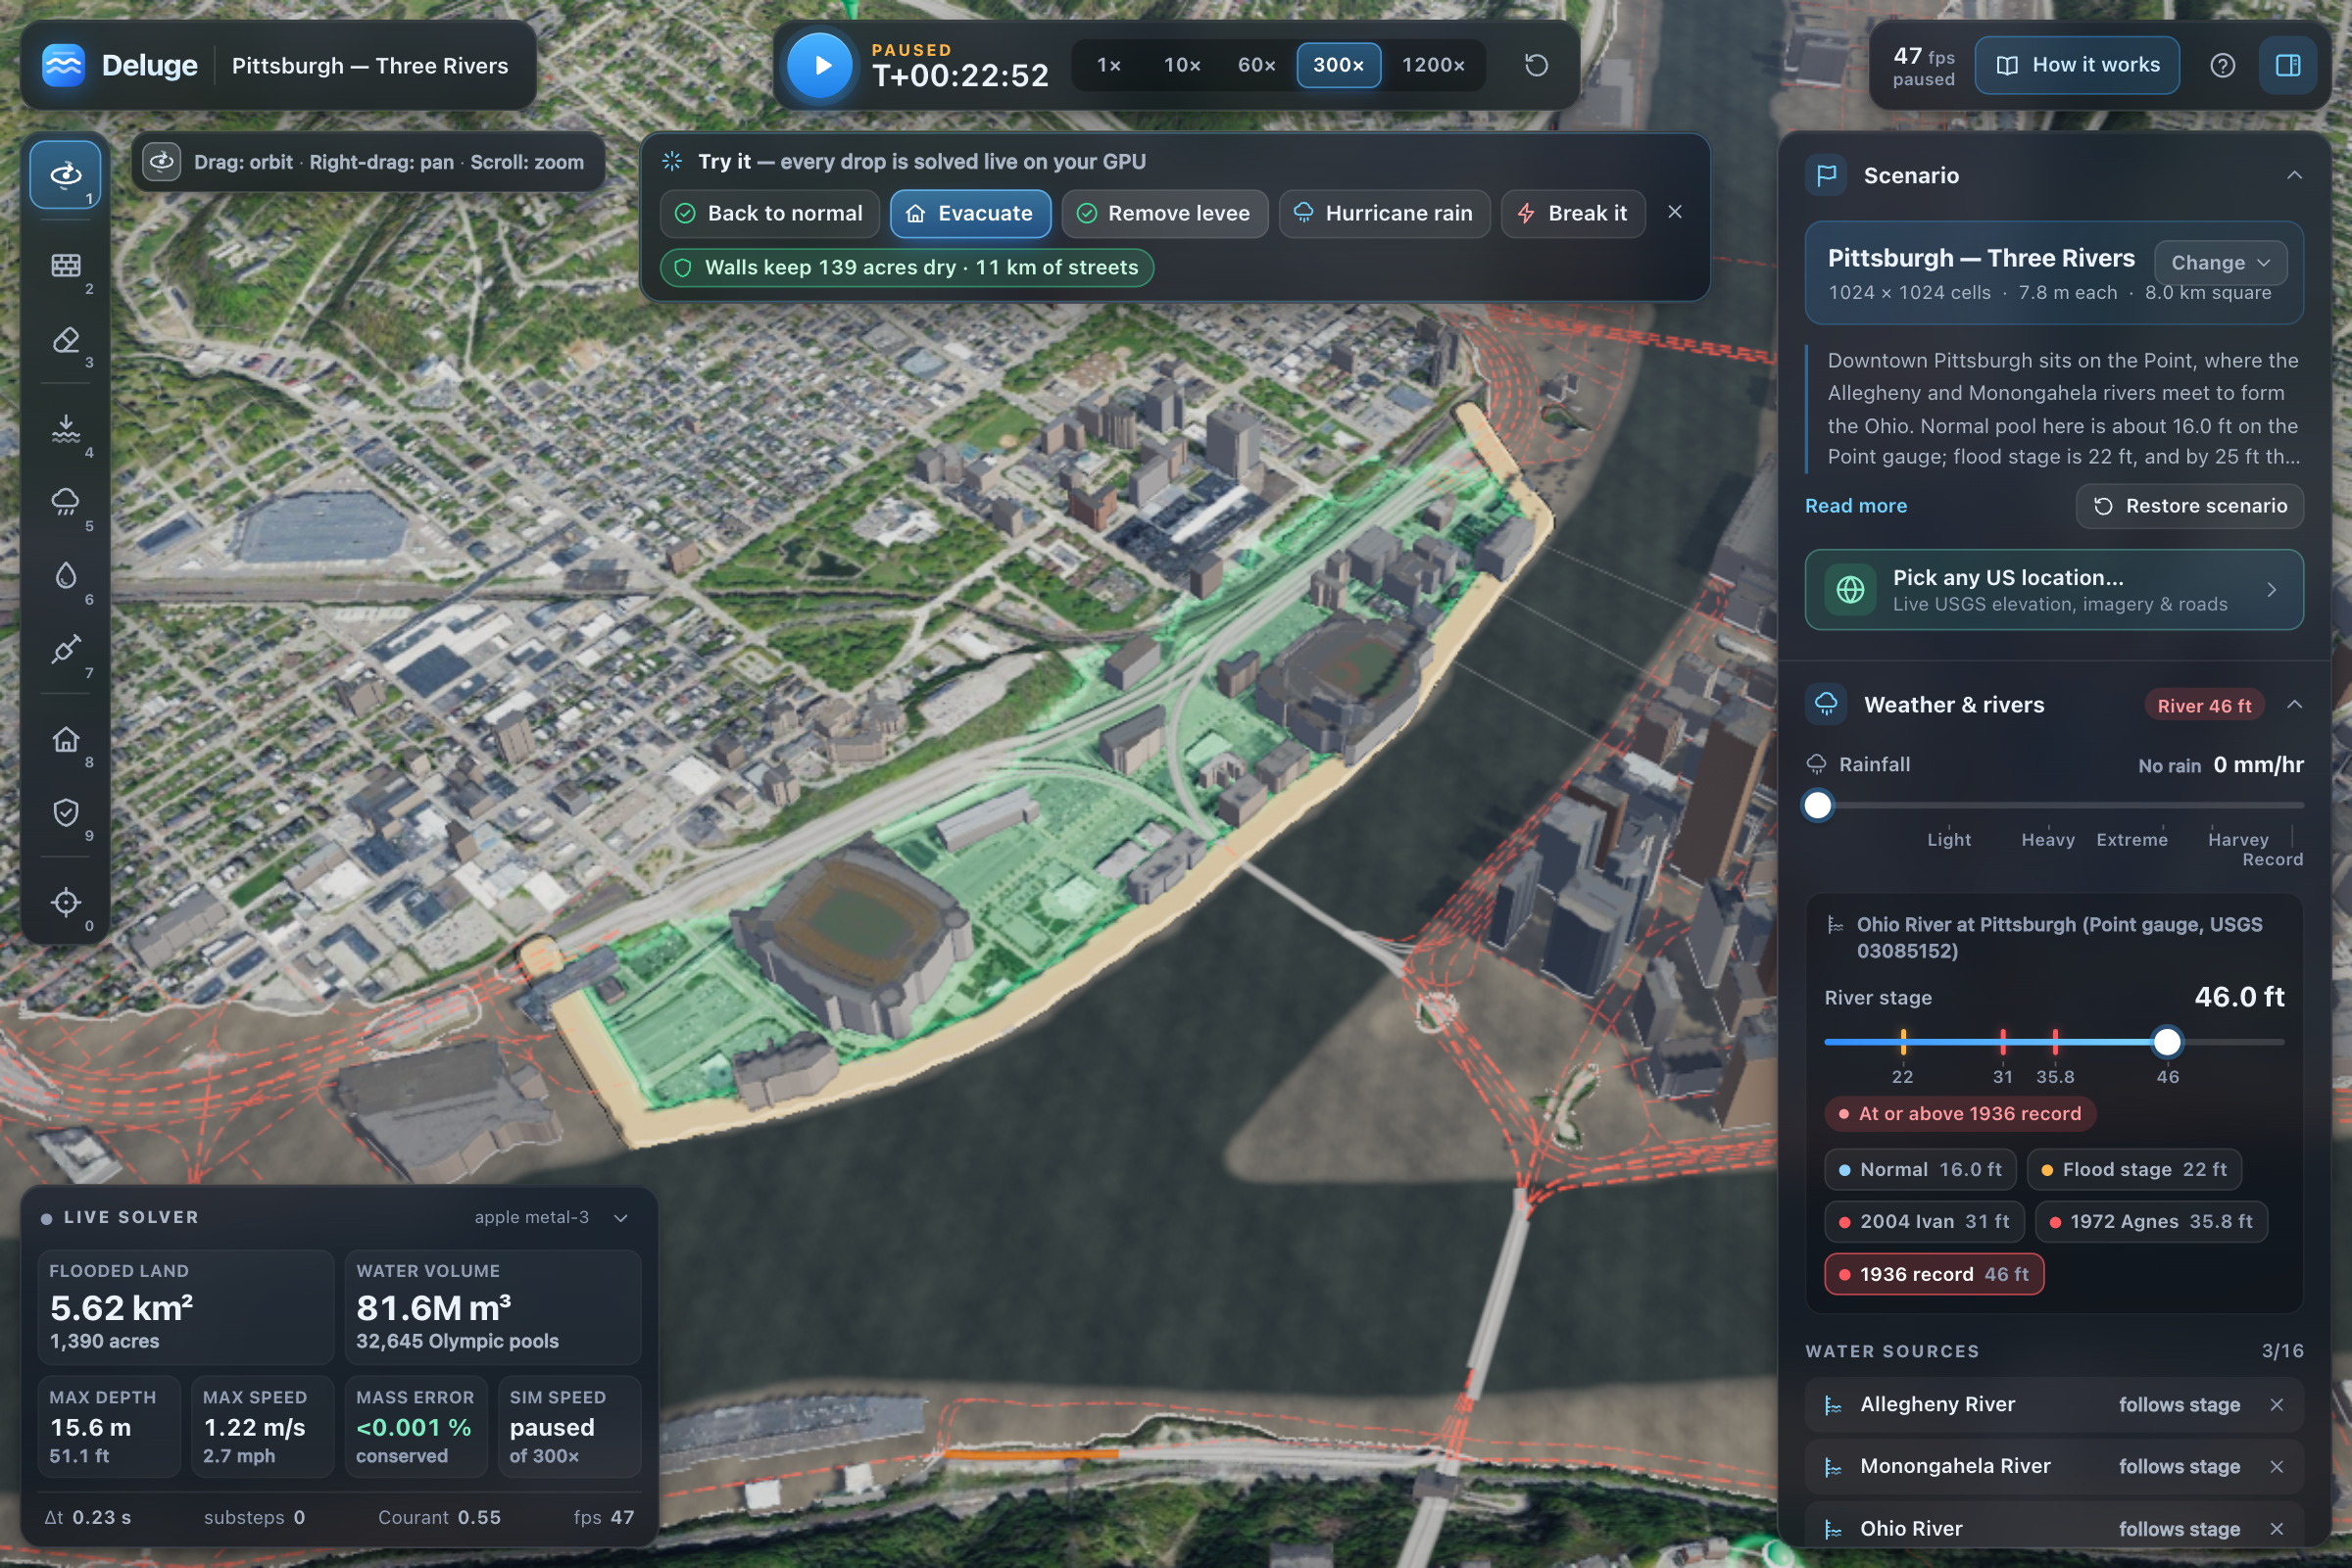
Click to build a levee. Replays 1936 against it. Saves 139 acres and 11 km of streets from water.
-
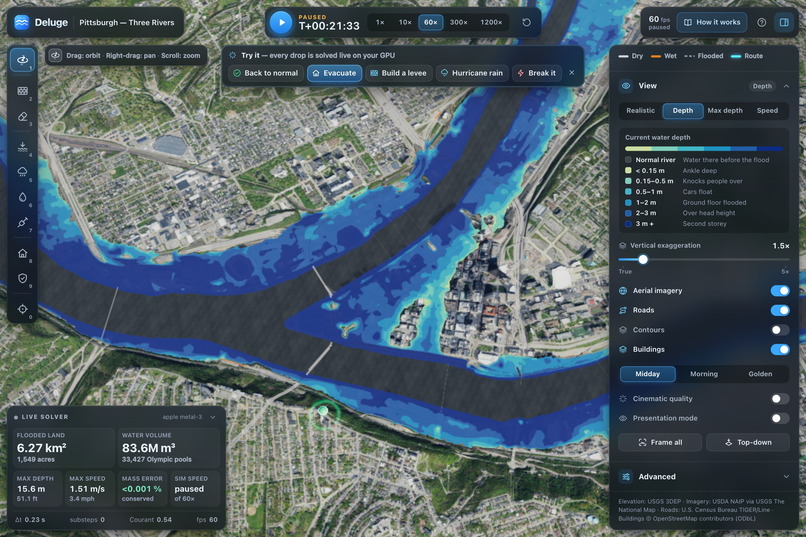
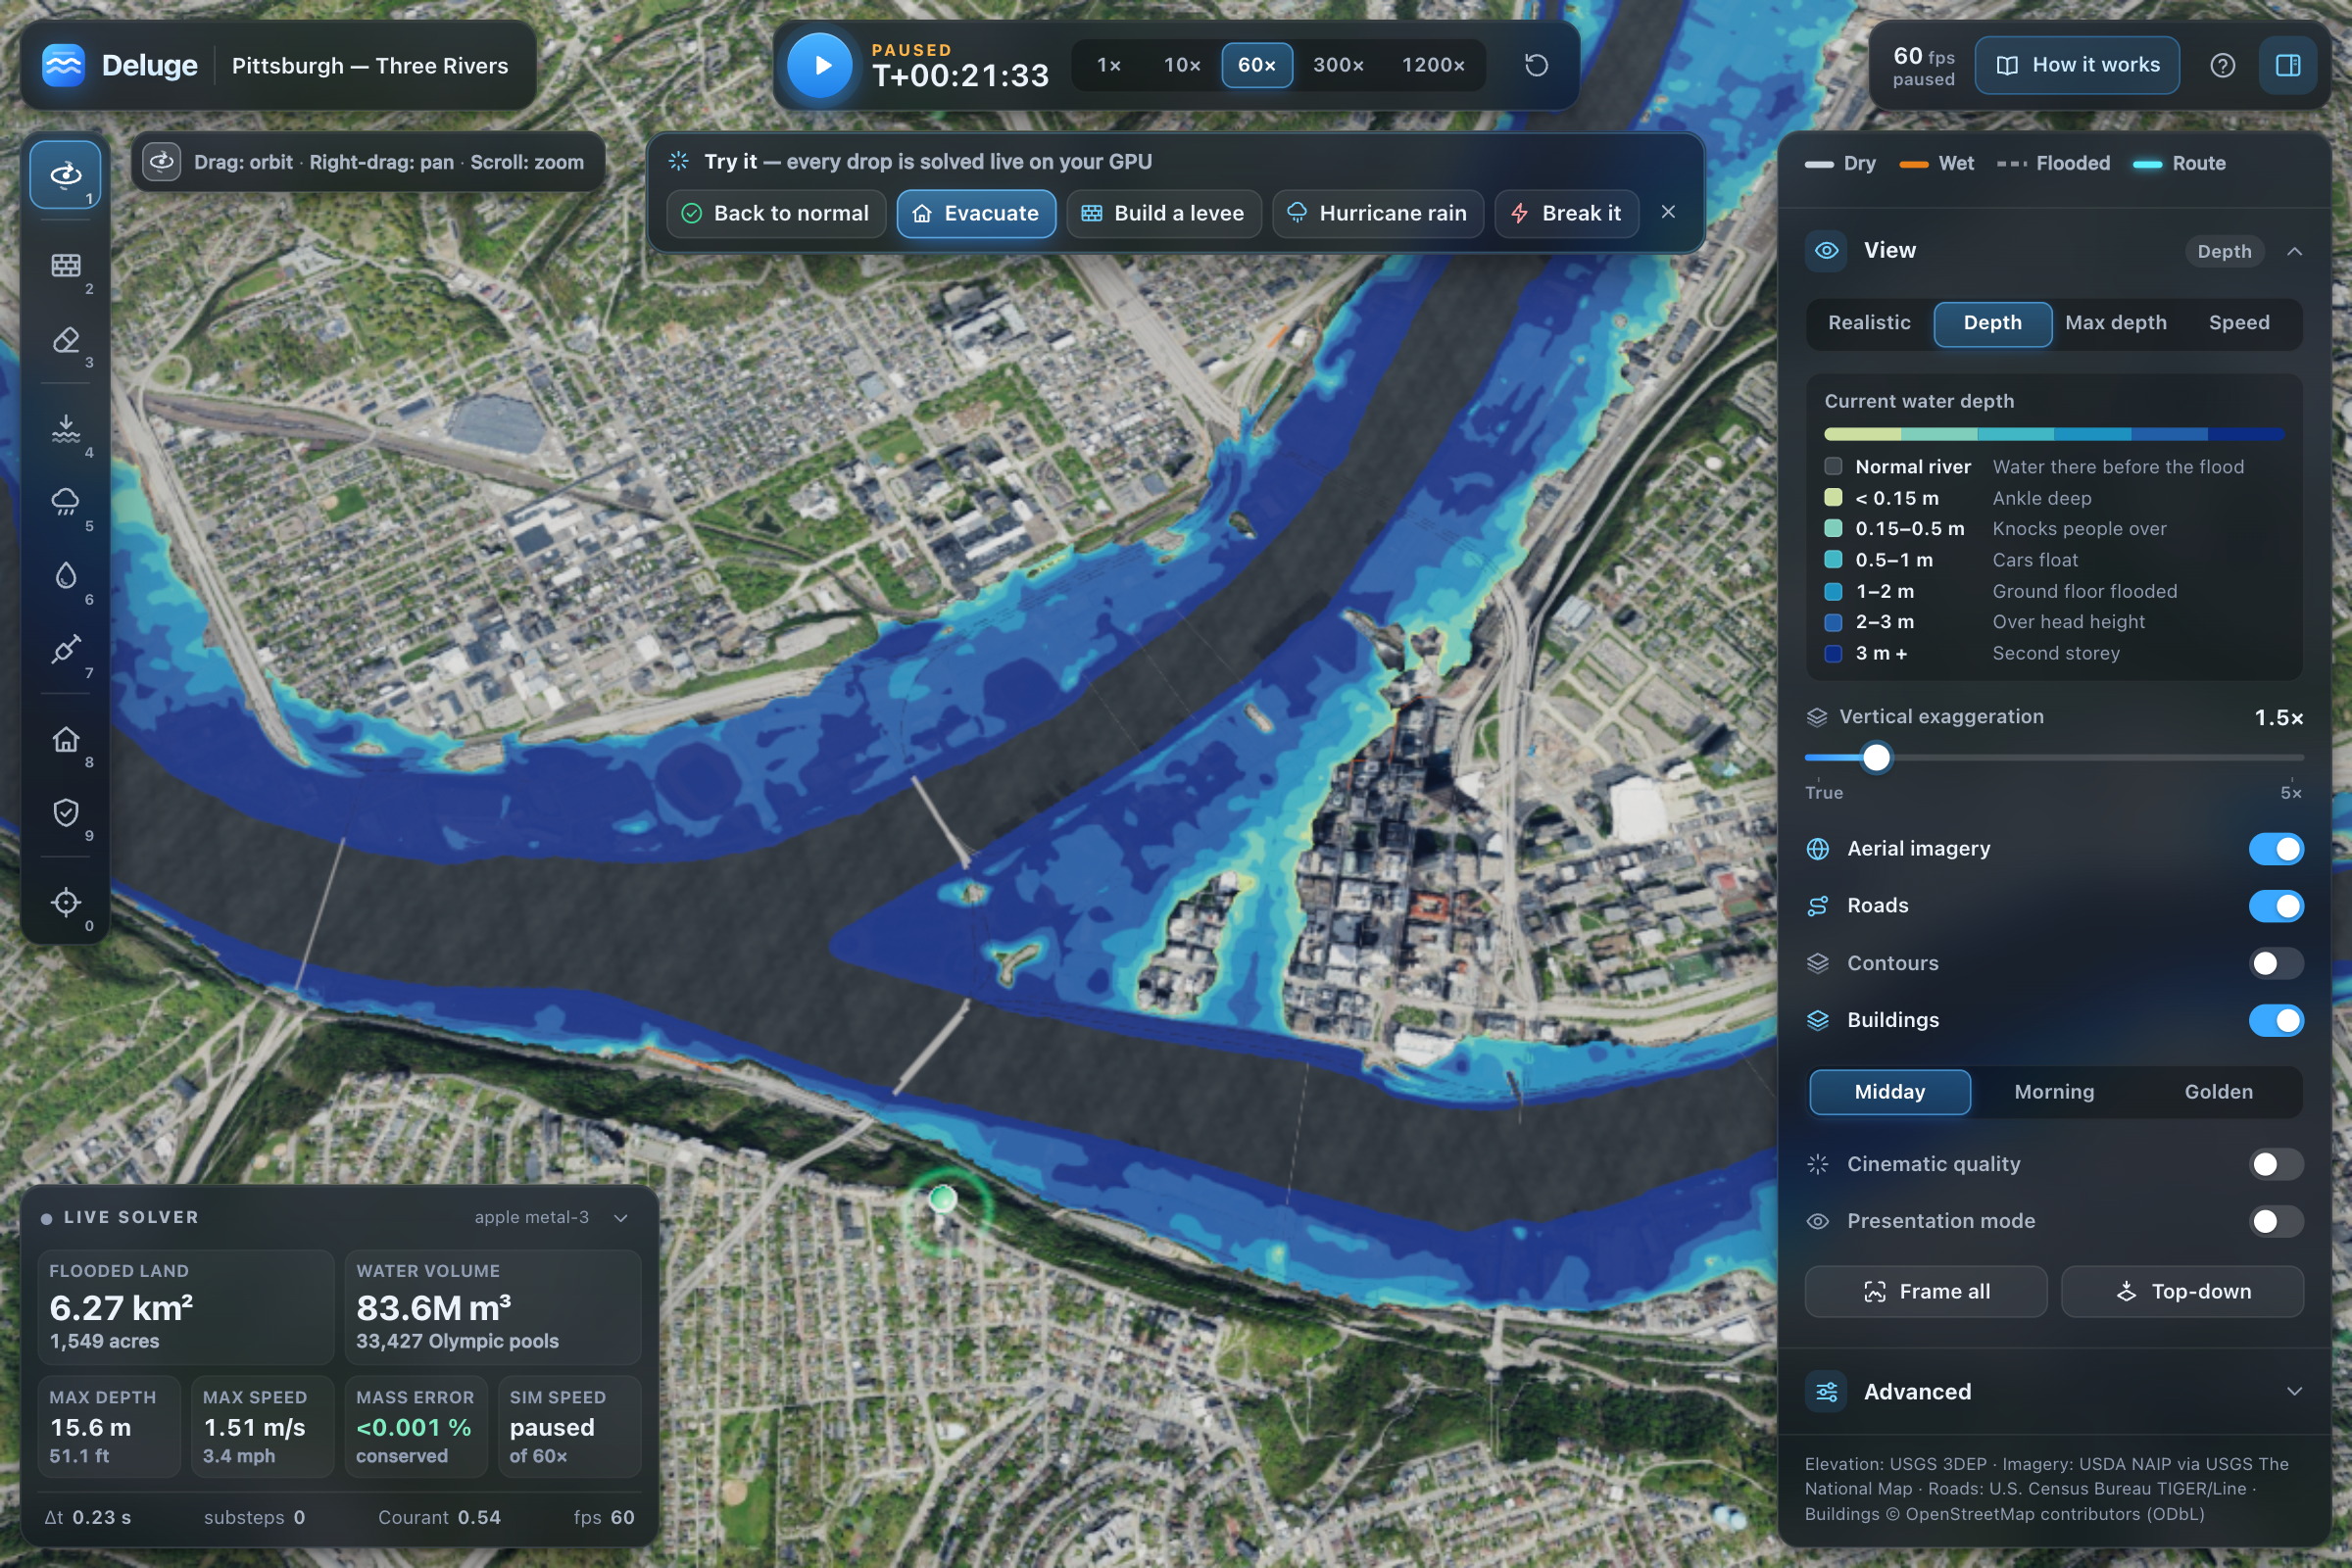
Pittsburgh 1936 crest at 46 feet: 6.27 km² flooded, 83.6 million m³, mass-balance error 0.001%.
-
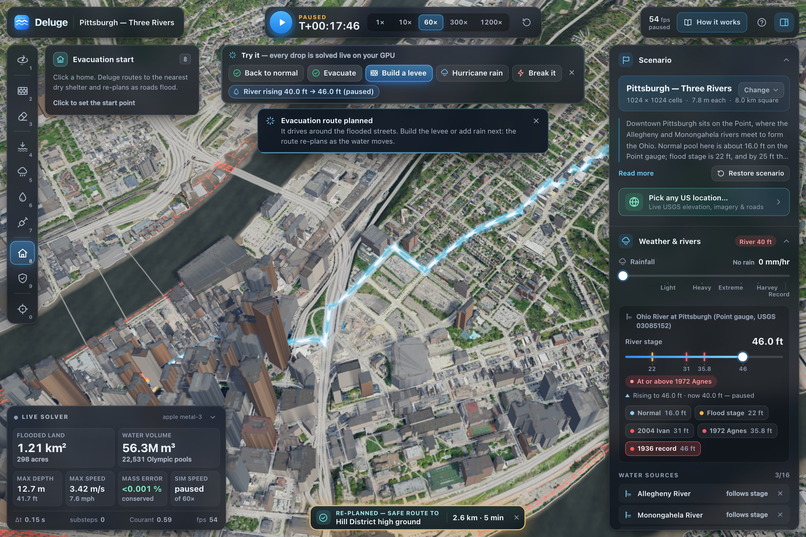
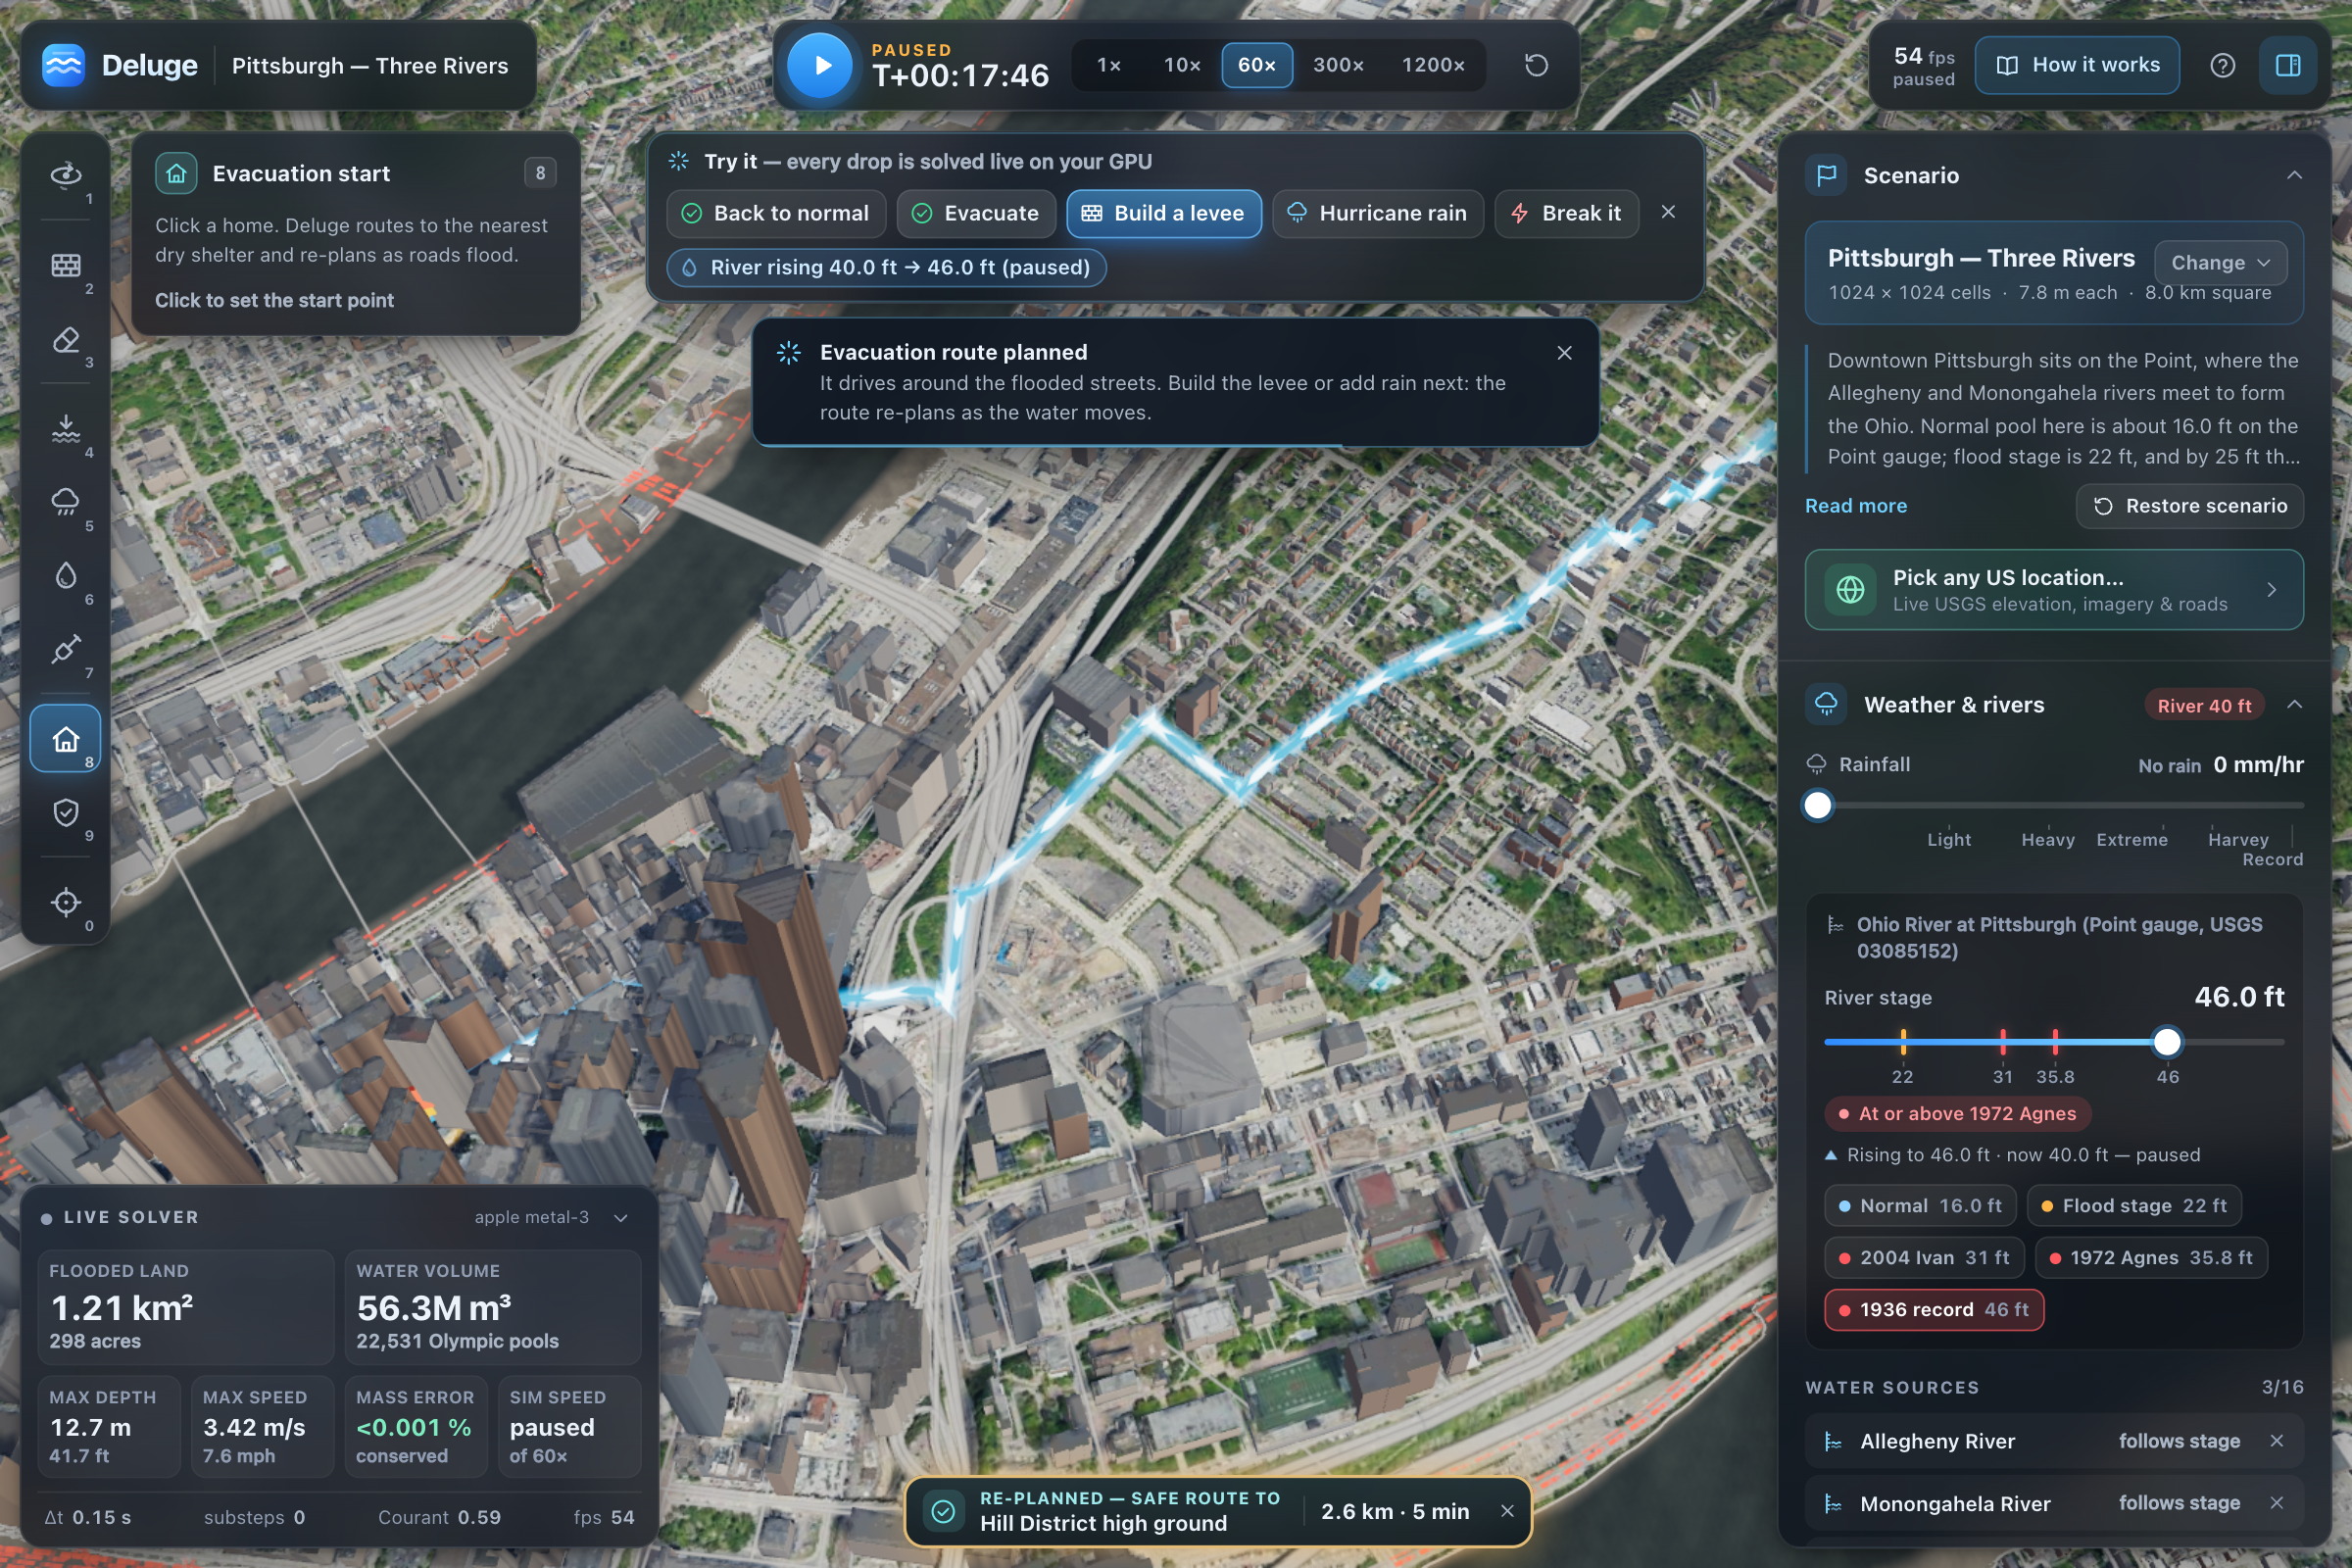
Evacuation re-plans live on Census roads: 2.6 km to Hill District high ground as floods rise.
-
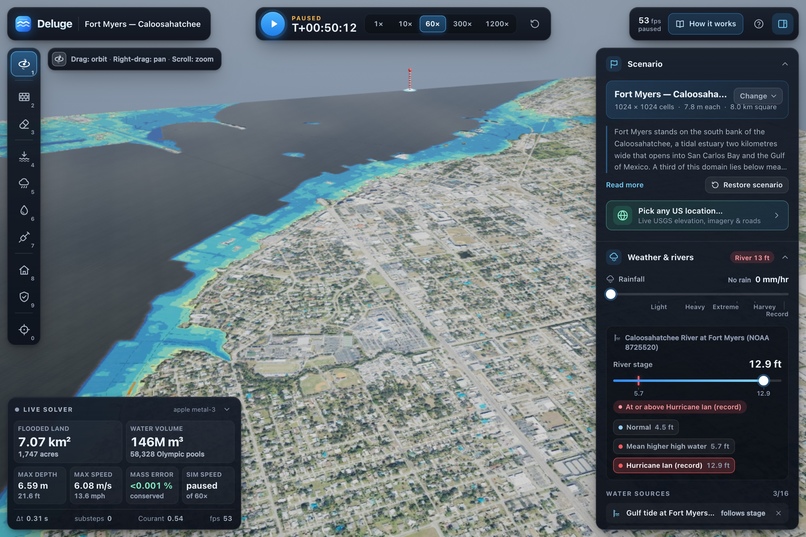
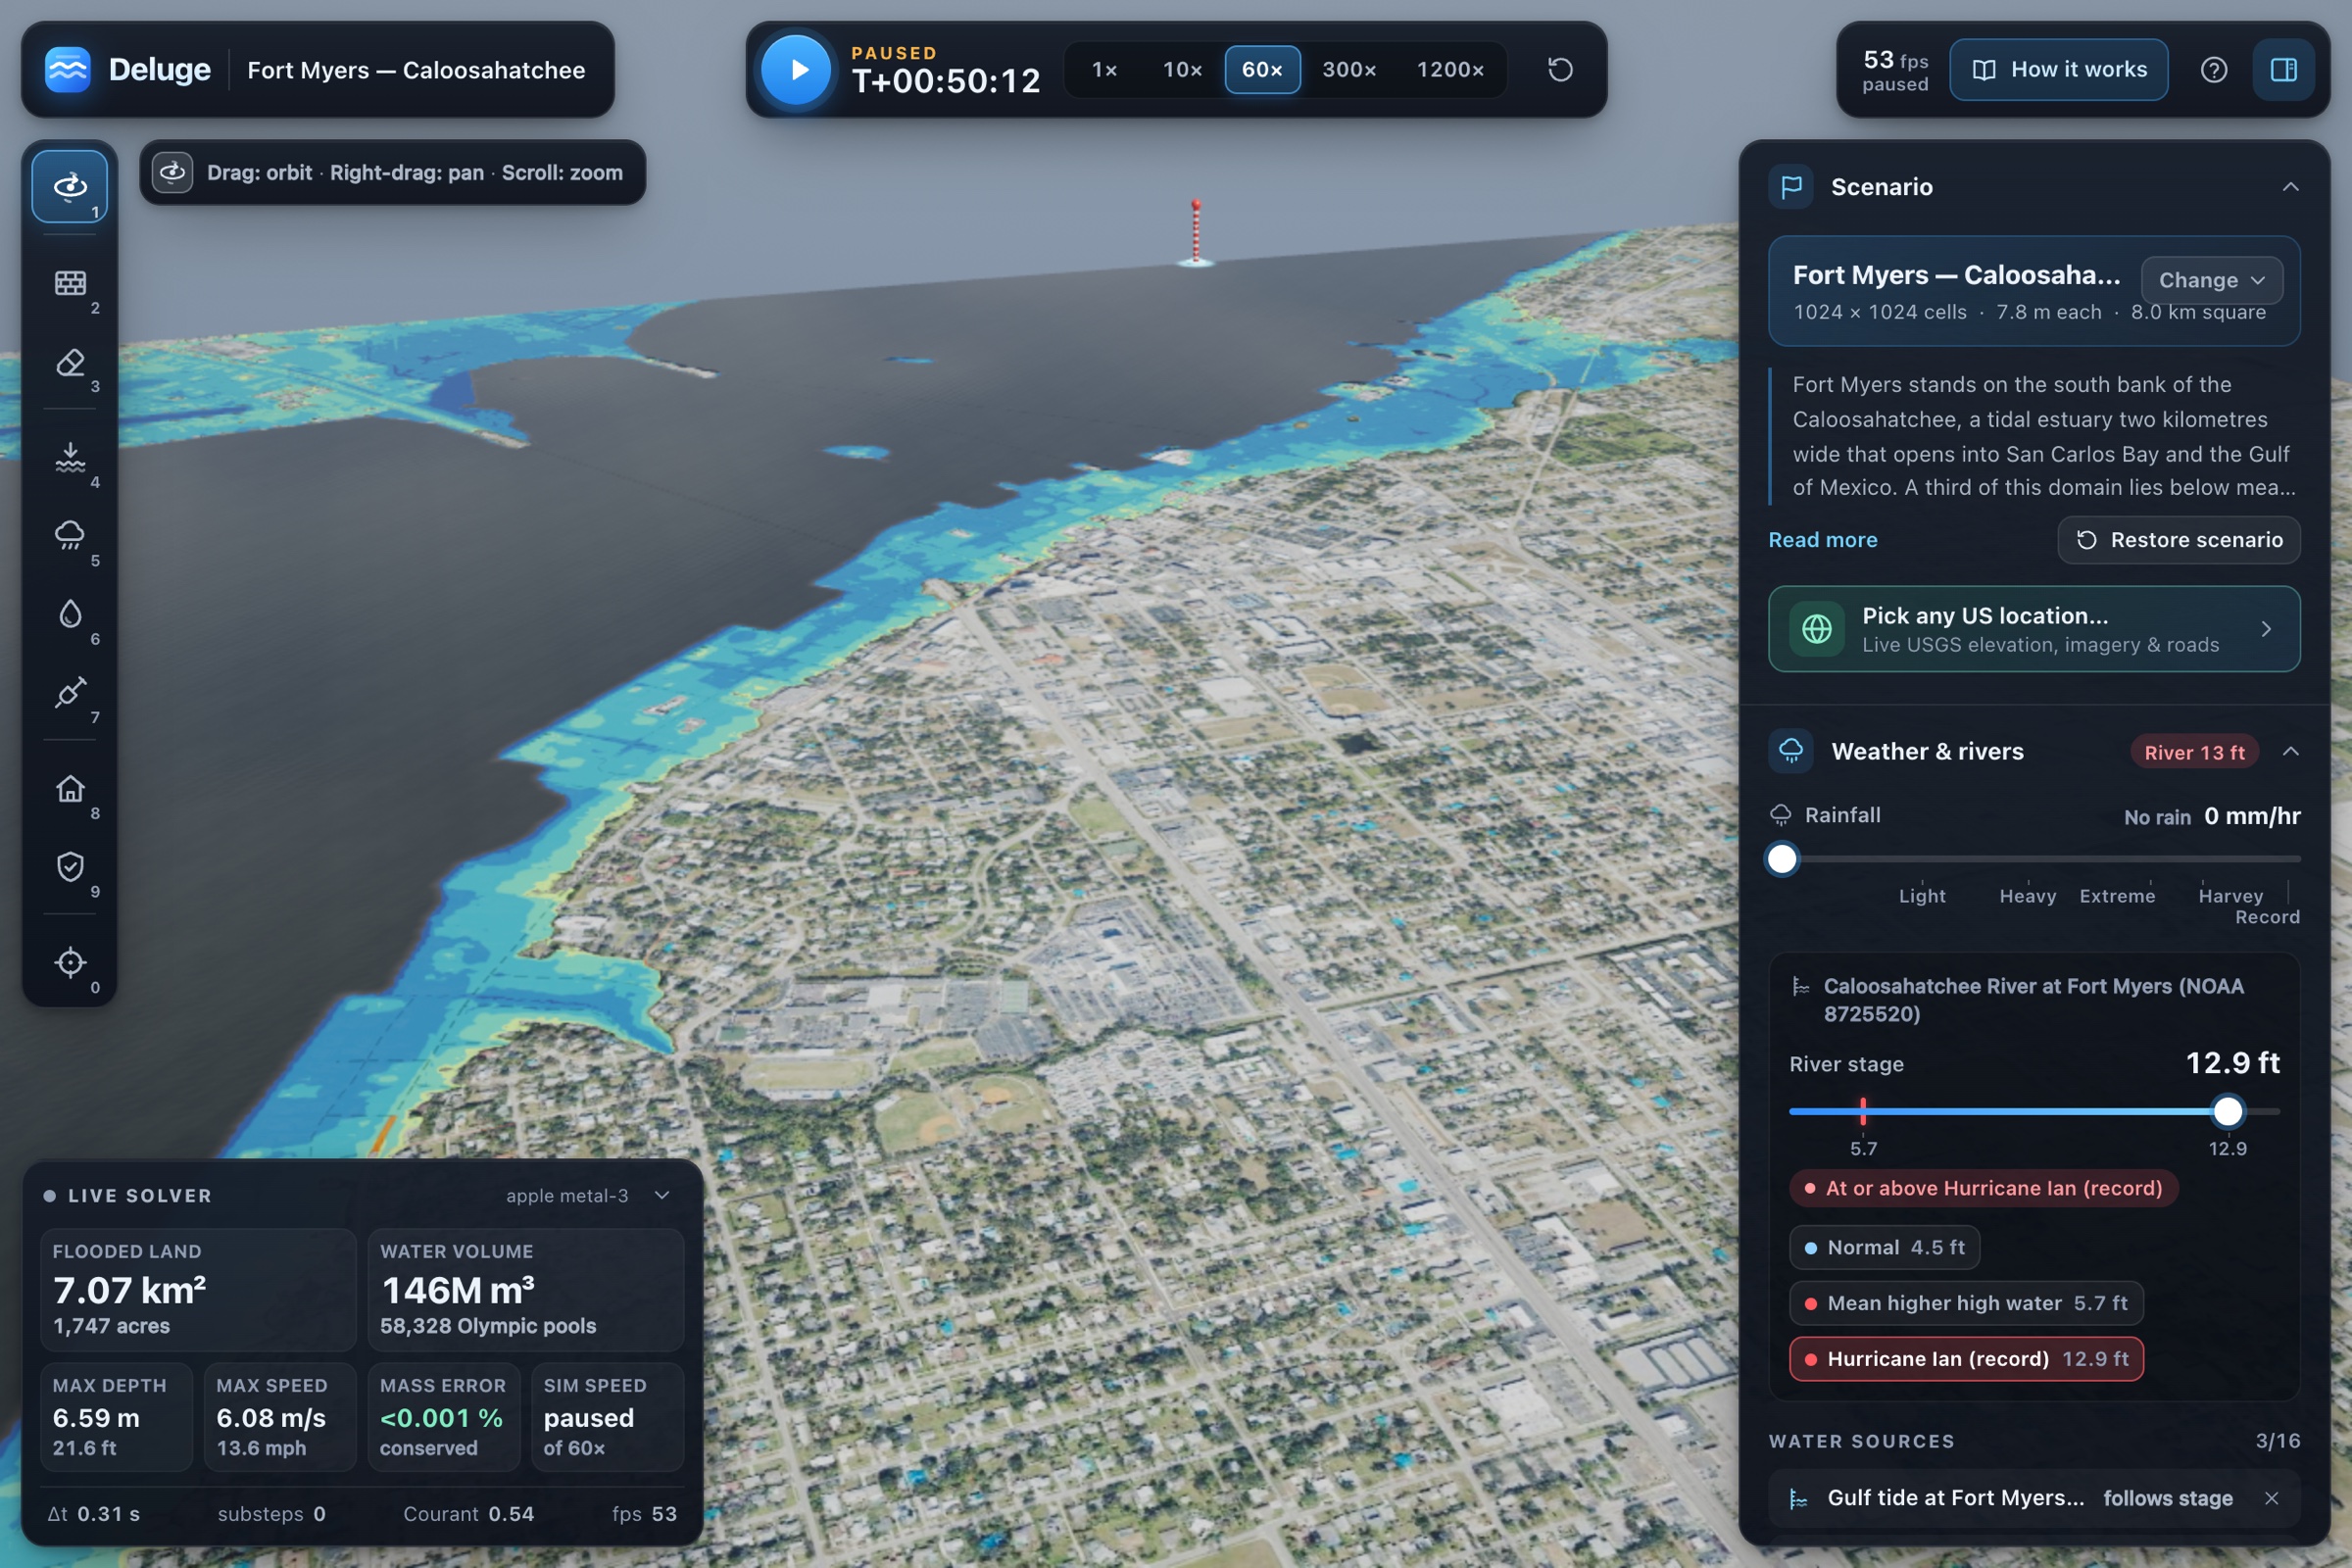
Ian's 12.9 ft surge pushes Gulf water up Caloosahatchee estuary to Fort Myers: 146 million m³.
-
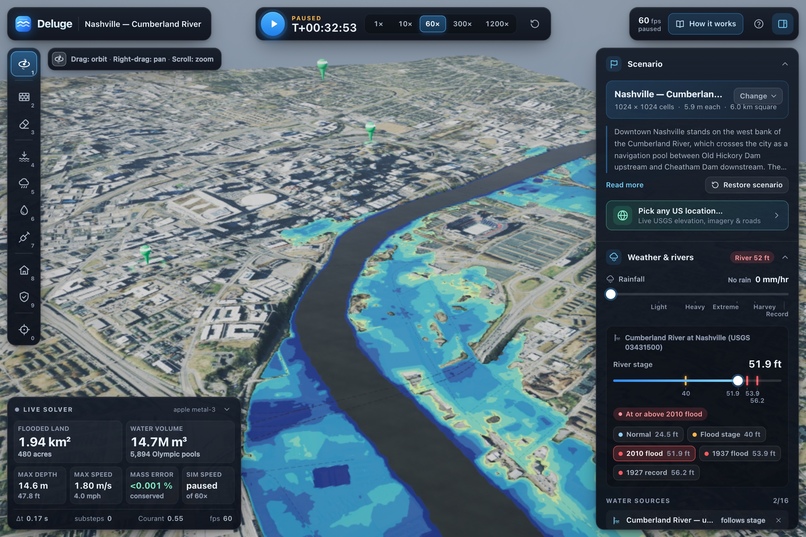
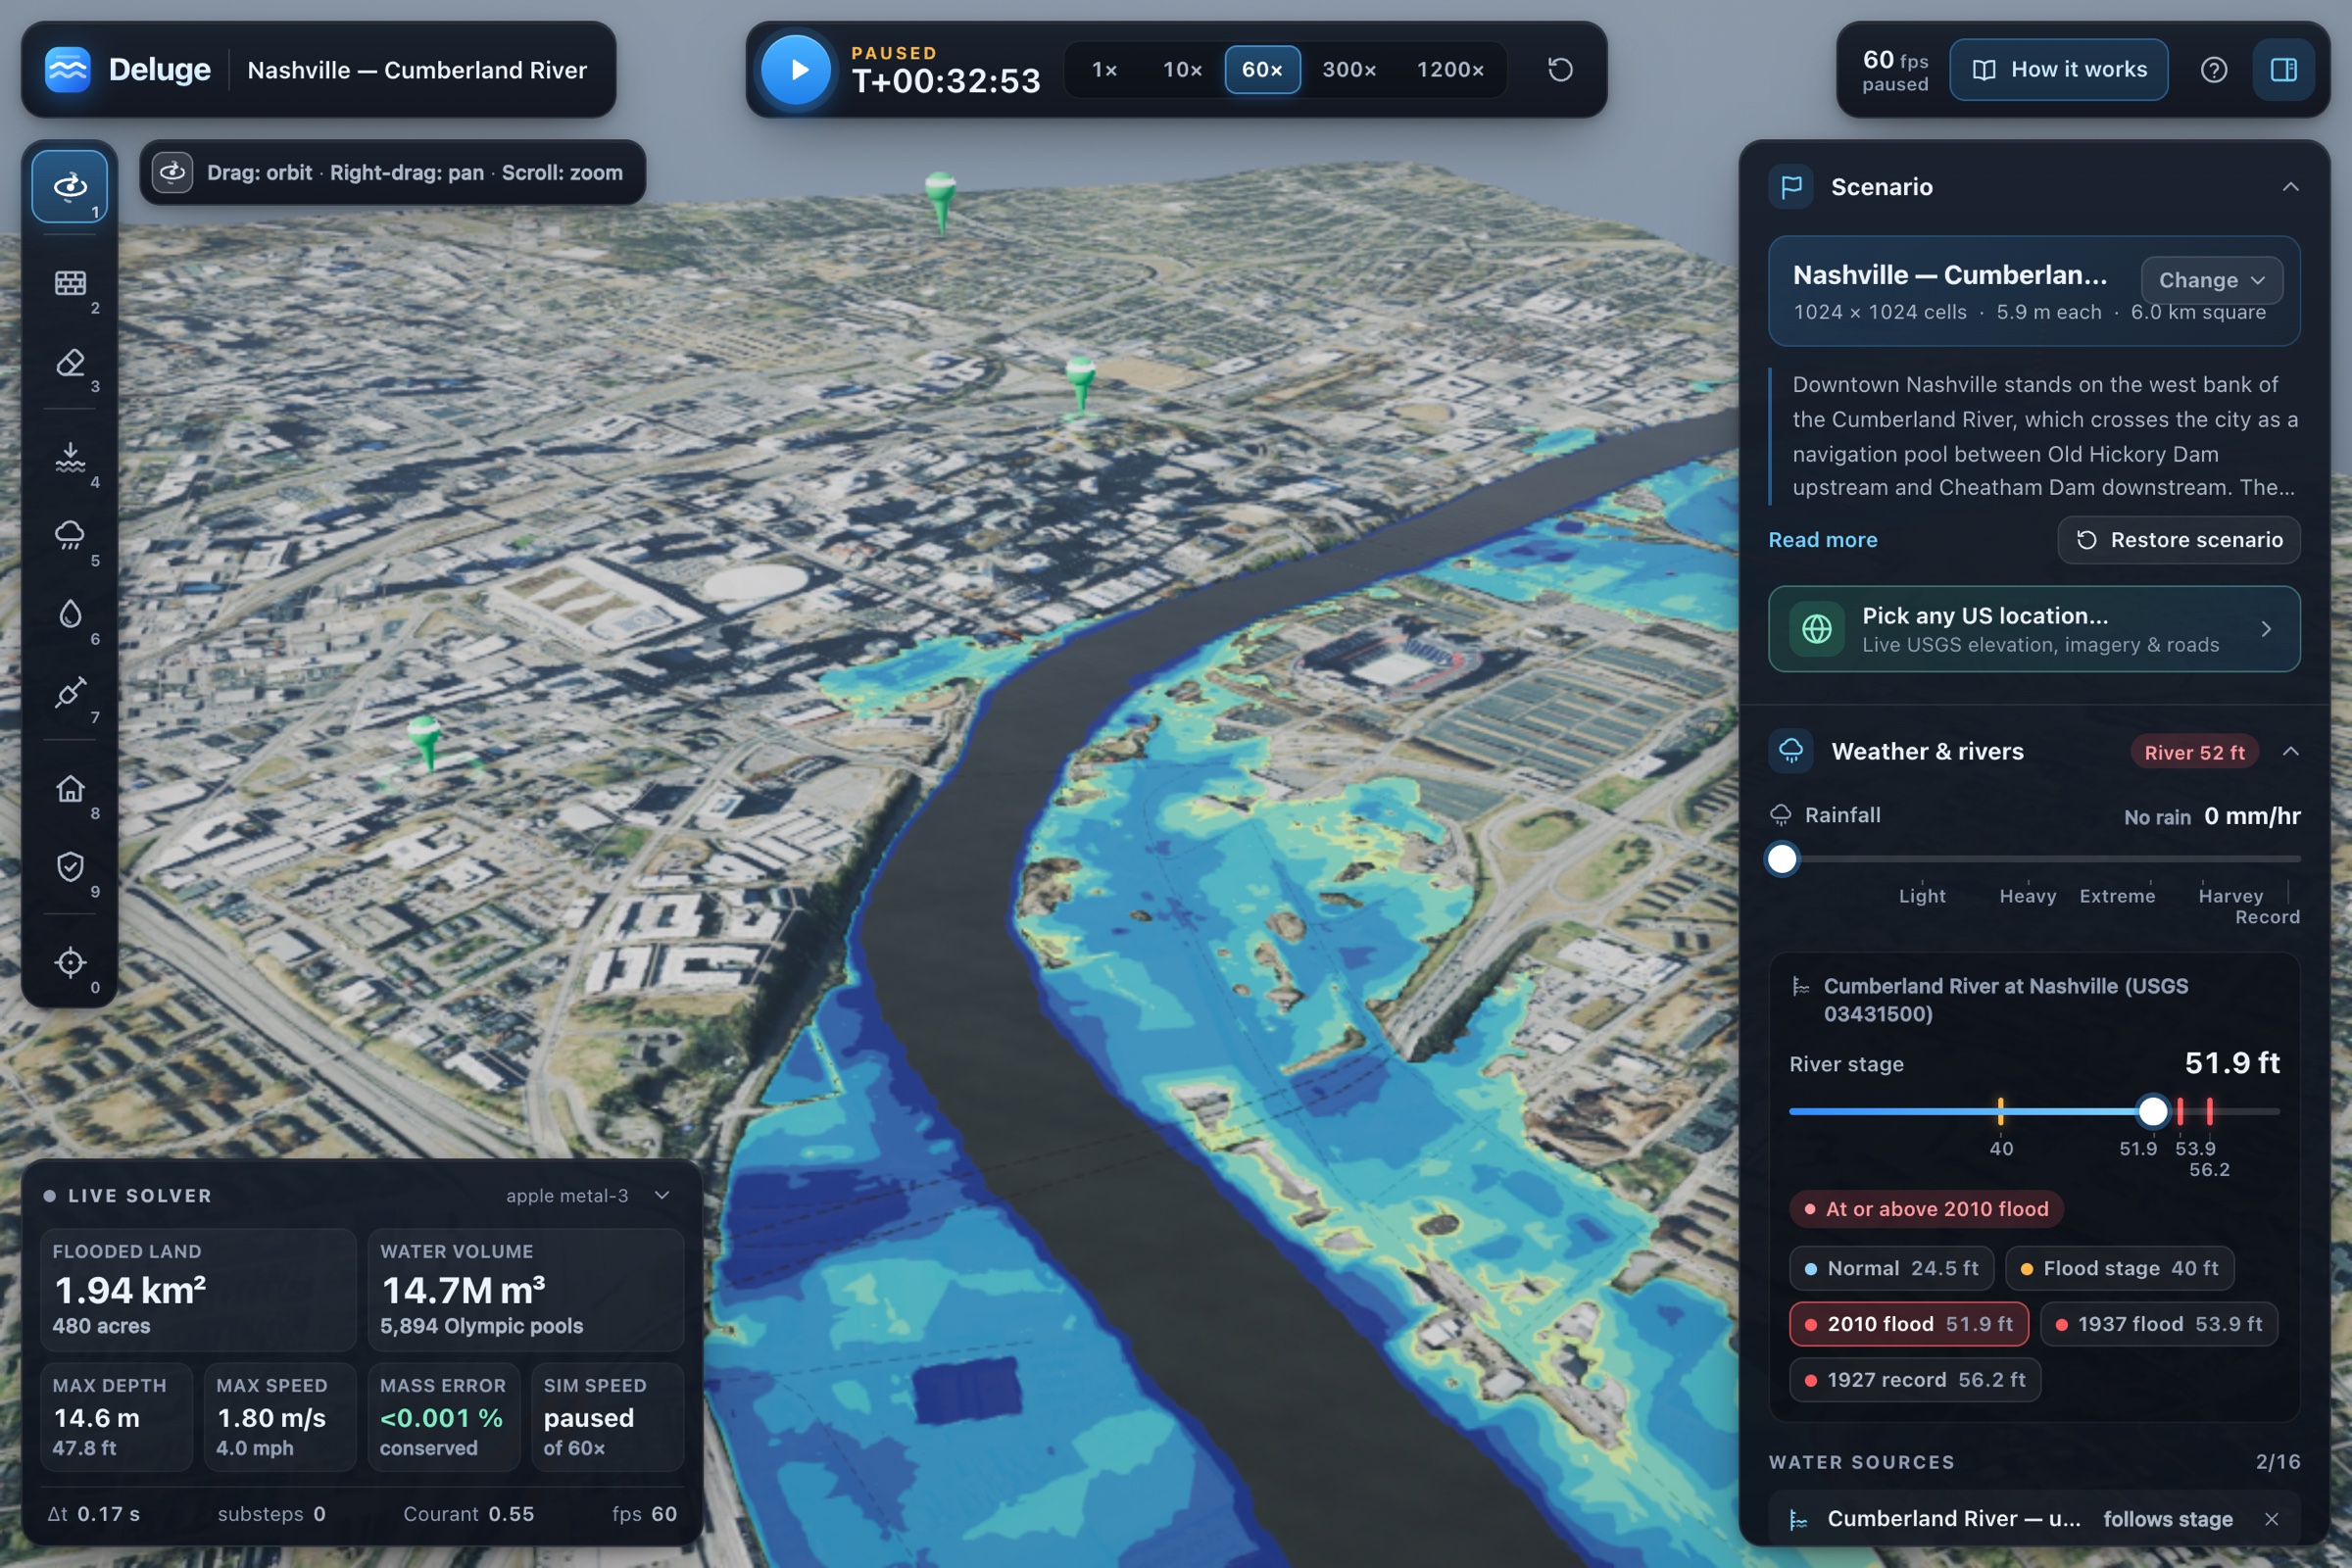
Cumberland at 51.9 ft (May 2010 peak): east bank floods, downtown's higher west bluff stays dry.
-
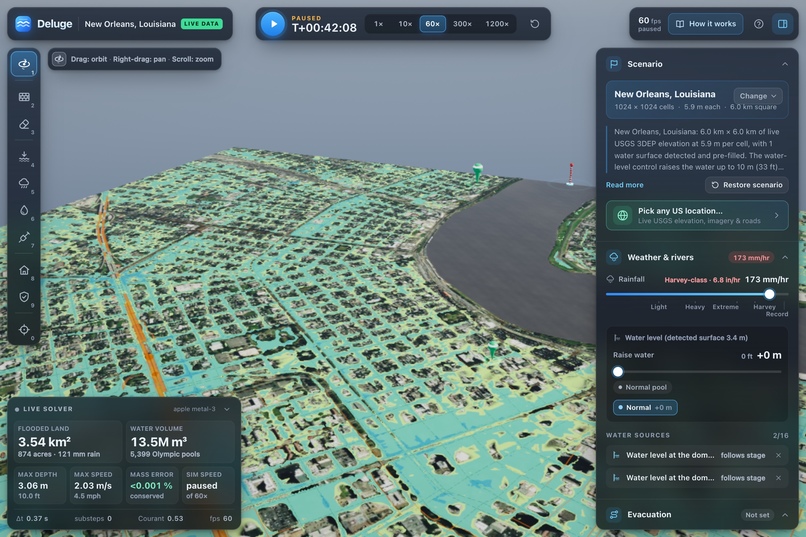
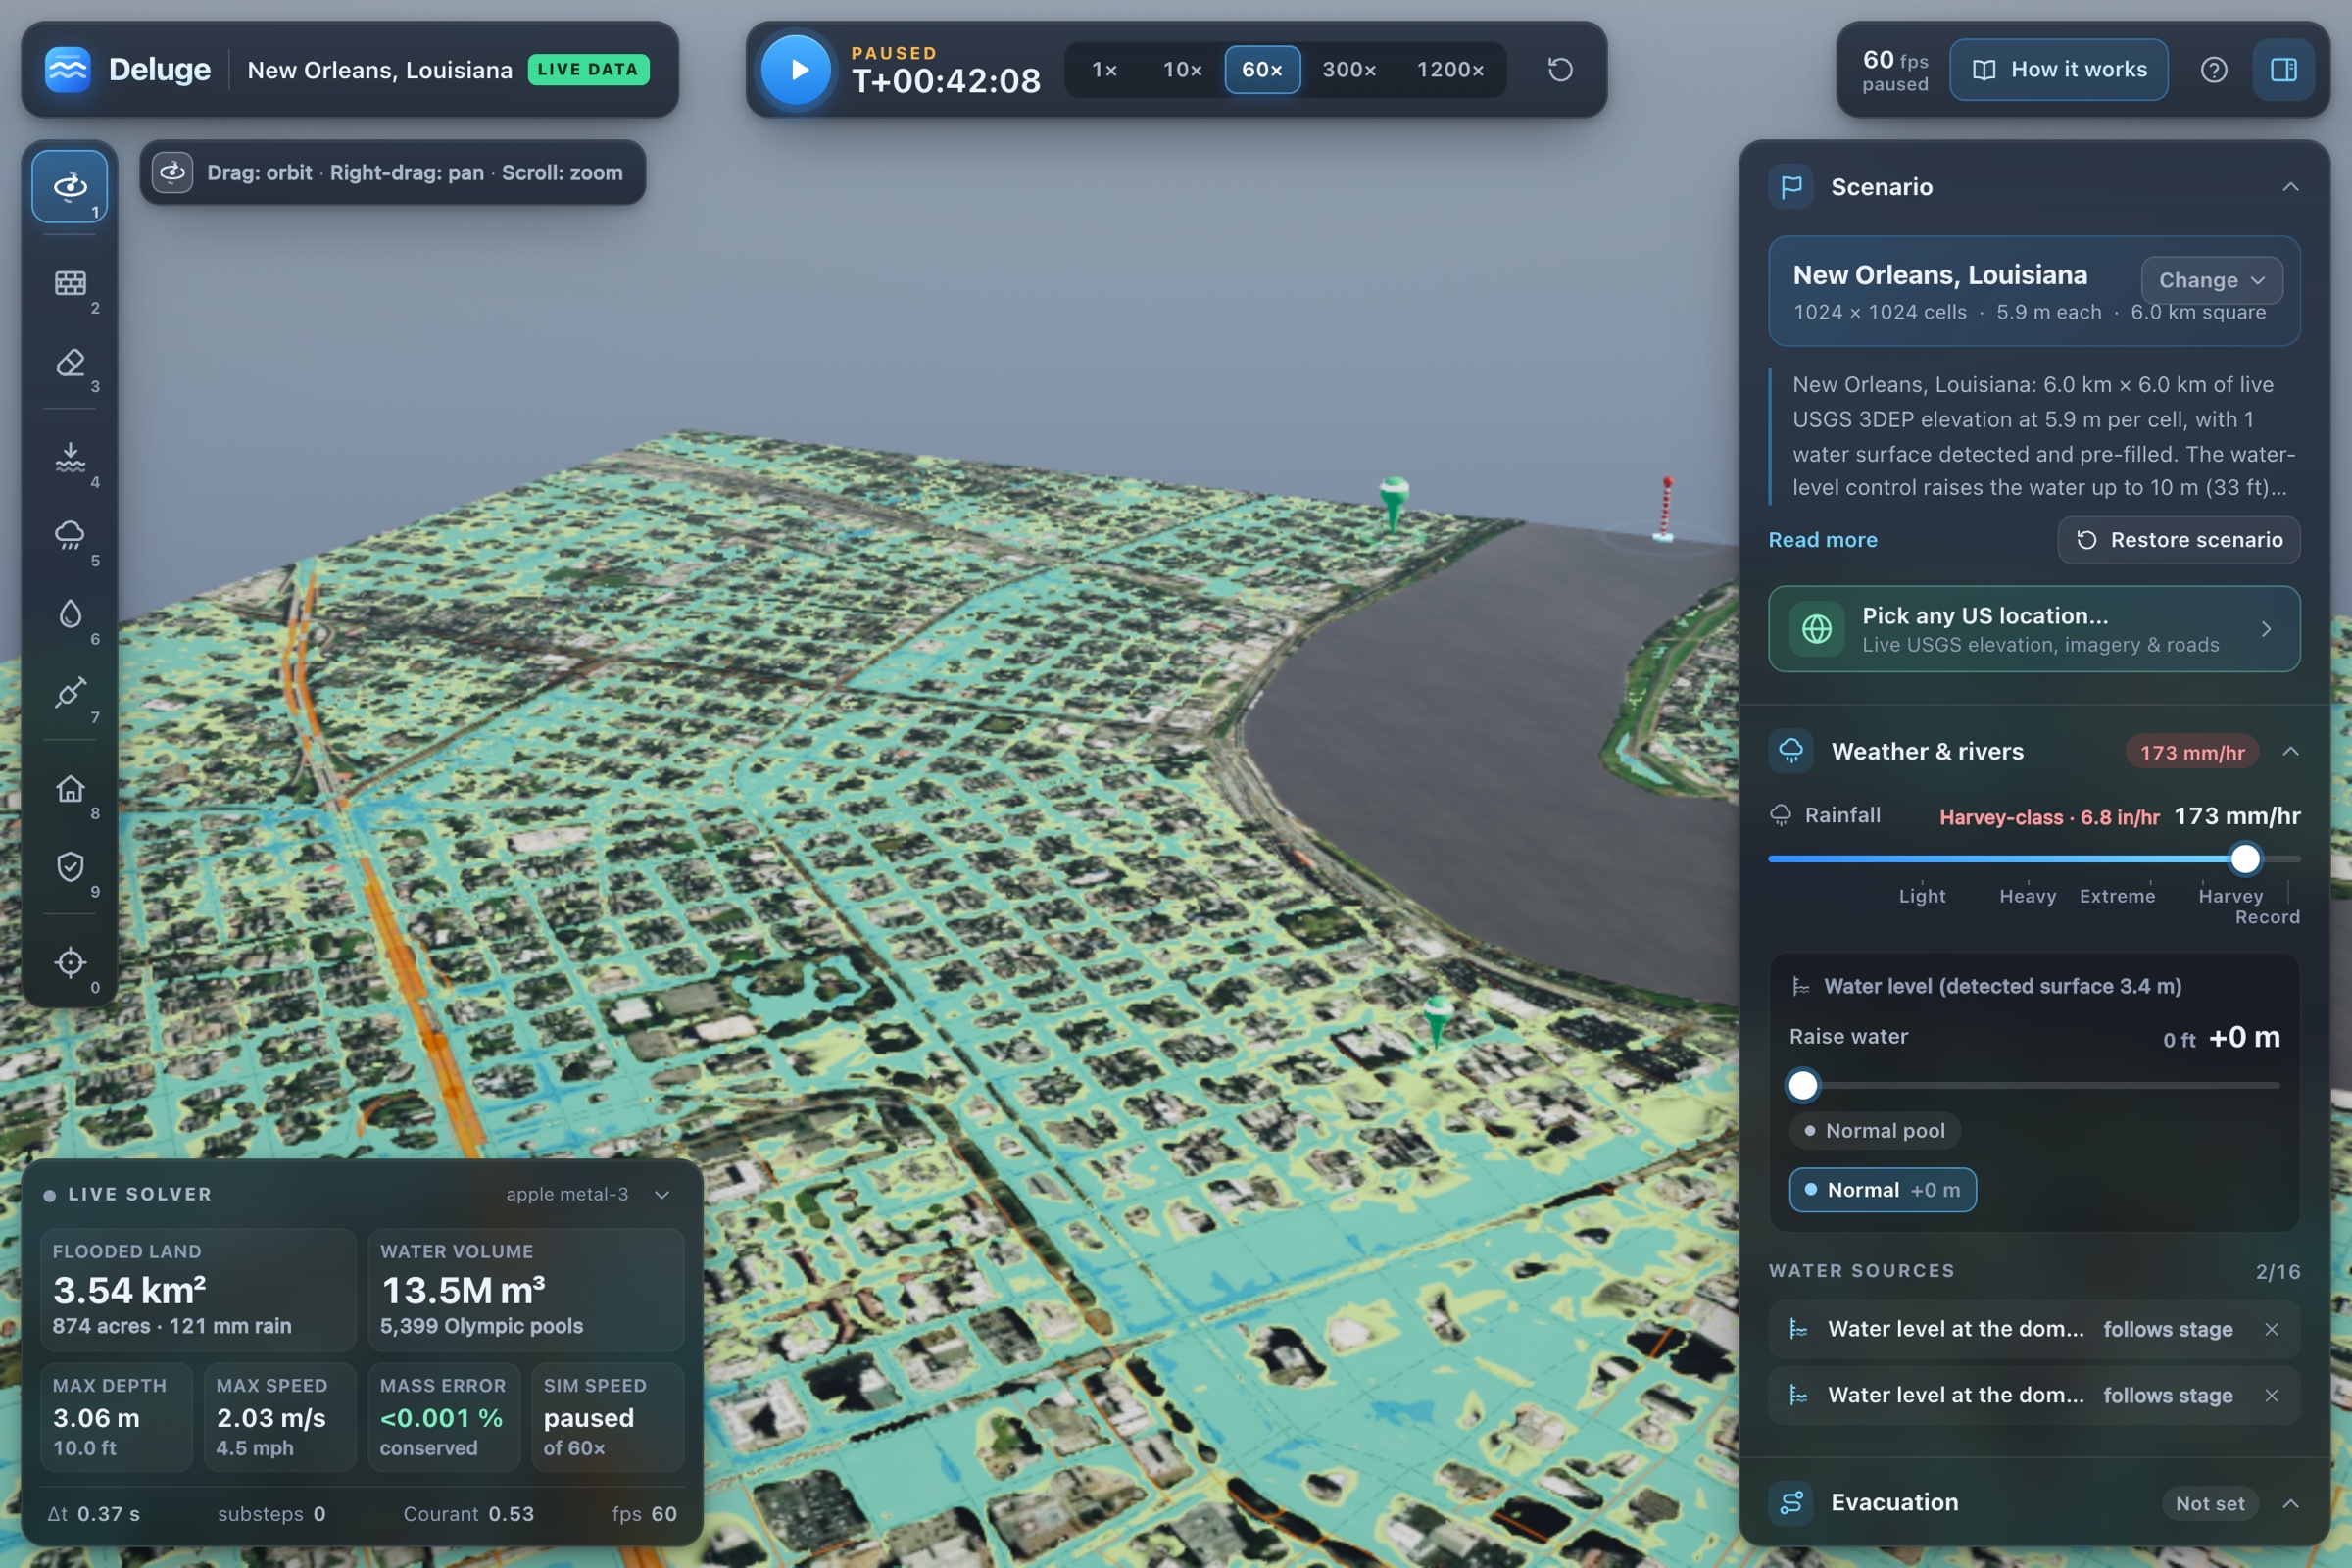
Live New Orleans pulled from USGS data: any US location pipeline live, Harvey rain, instant result.
-
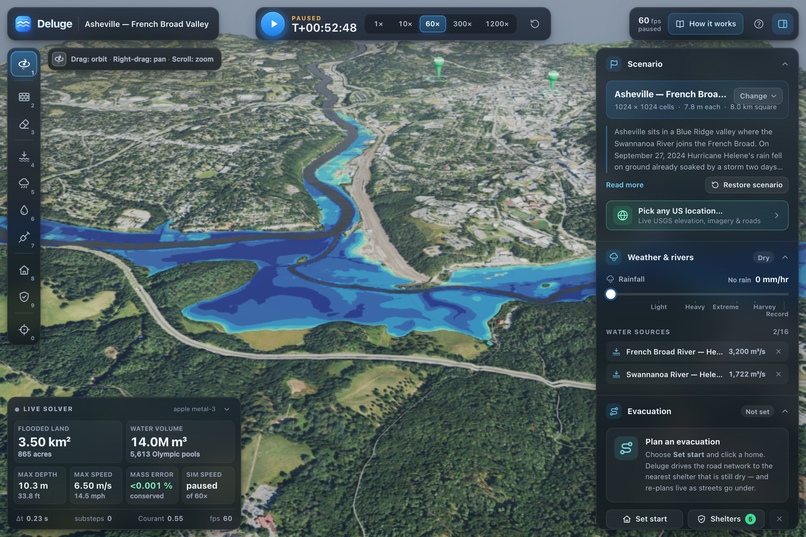
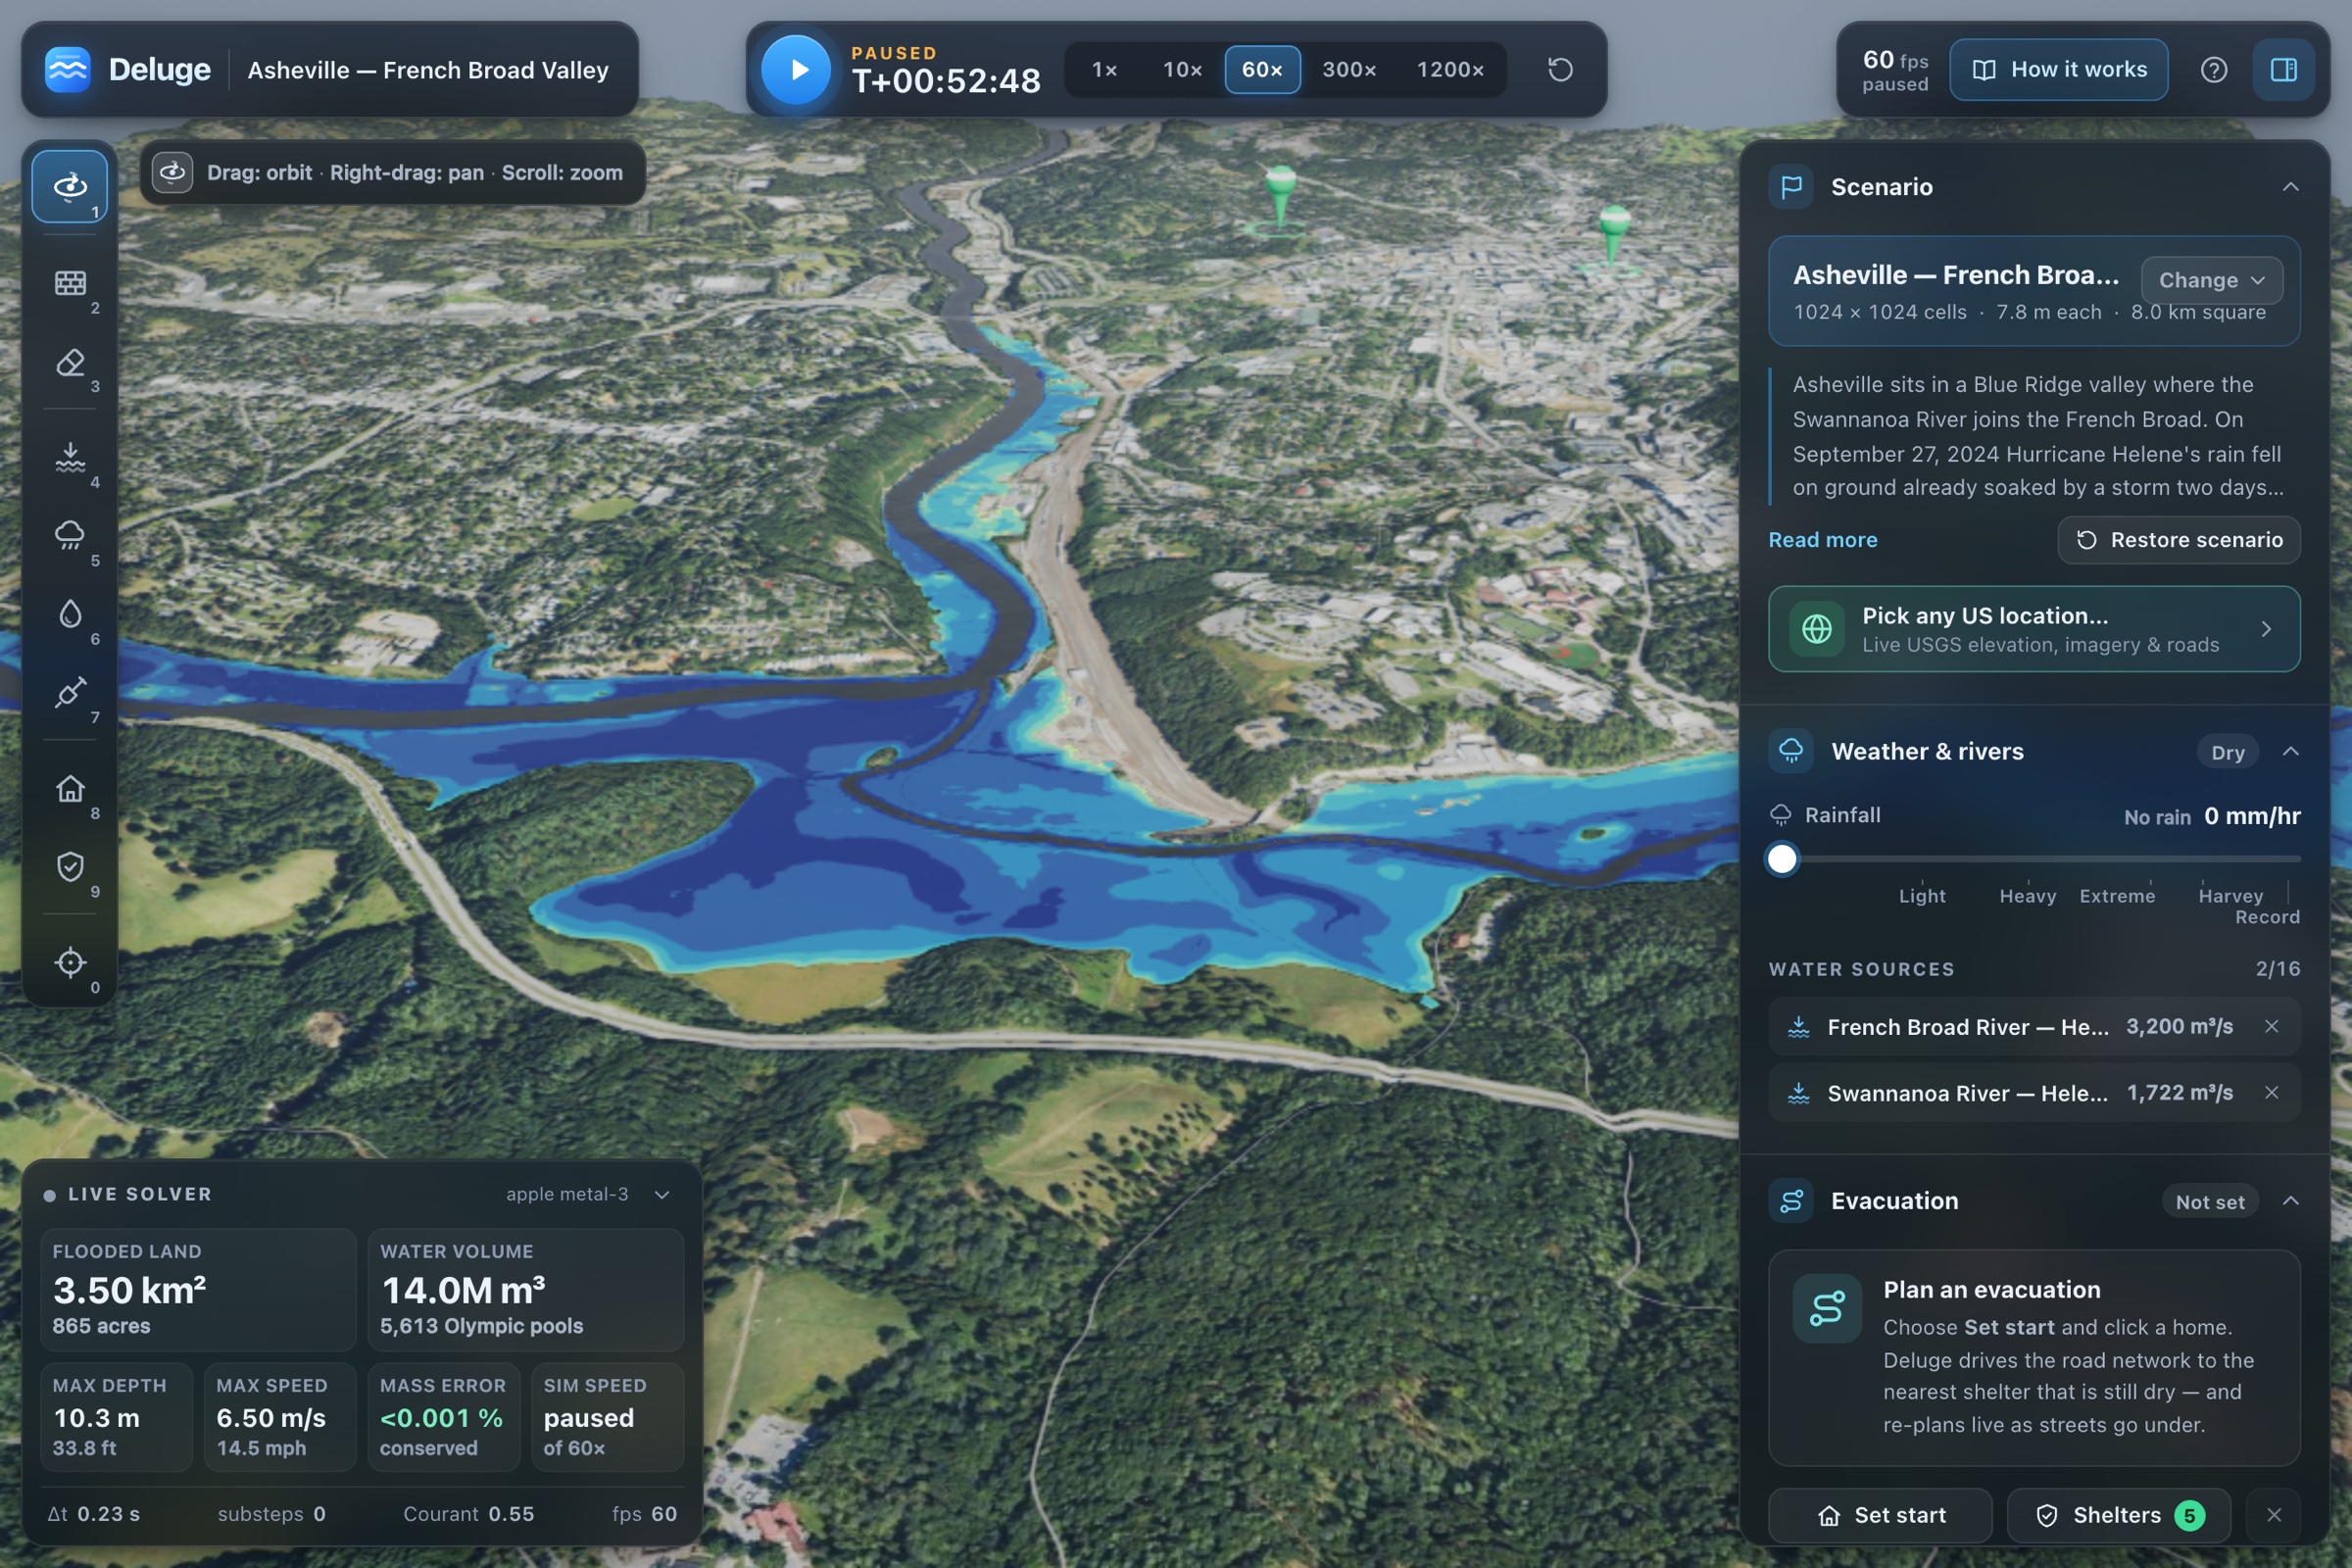
Hurricane Helene: French Broad and Swannanoa meet at Asheville, confluence drowns the river flats.
-
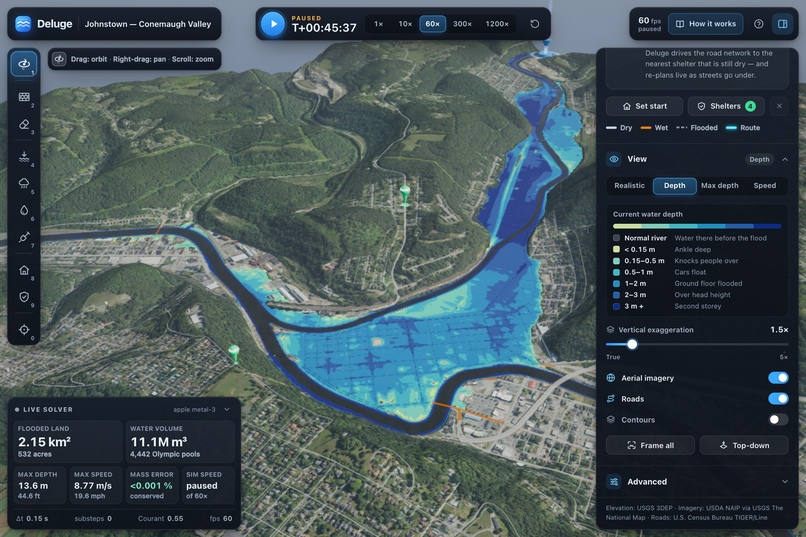
1889 Johnstown dam-break: 8,970 m³/s down Little Conemaugh, flat downtown fills between dry hills.
-
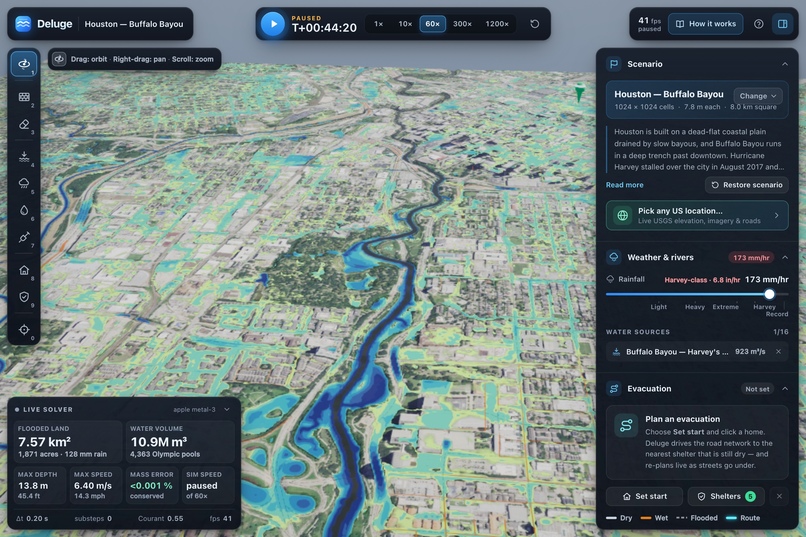
Harvey-class rain on flat Houston: Bayou fills, grid ponds, 7.57 km² underwater after 128 mm.
-
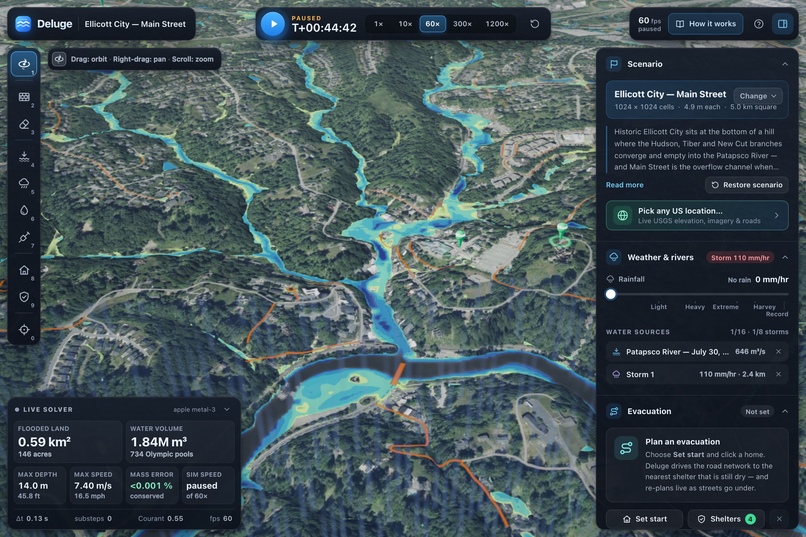
2016 Ellicott City: 110 mm/hr fills three creek branches that converge on Main Street and Patapsco.
-
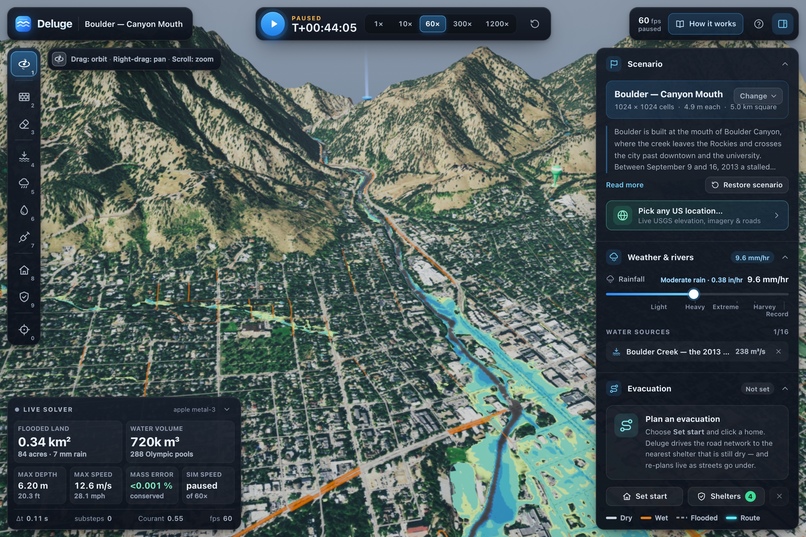
2013 Boulder Canyon flash flood: 238 m³/s creek crossing at 12.6 m/s. Momentum-driven, not ponding.
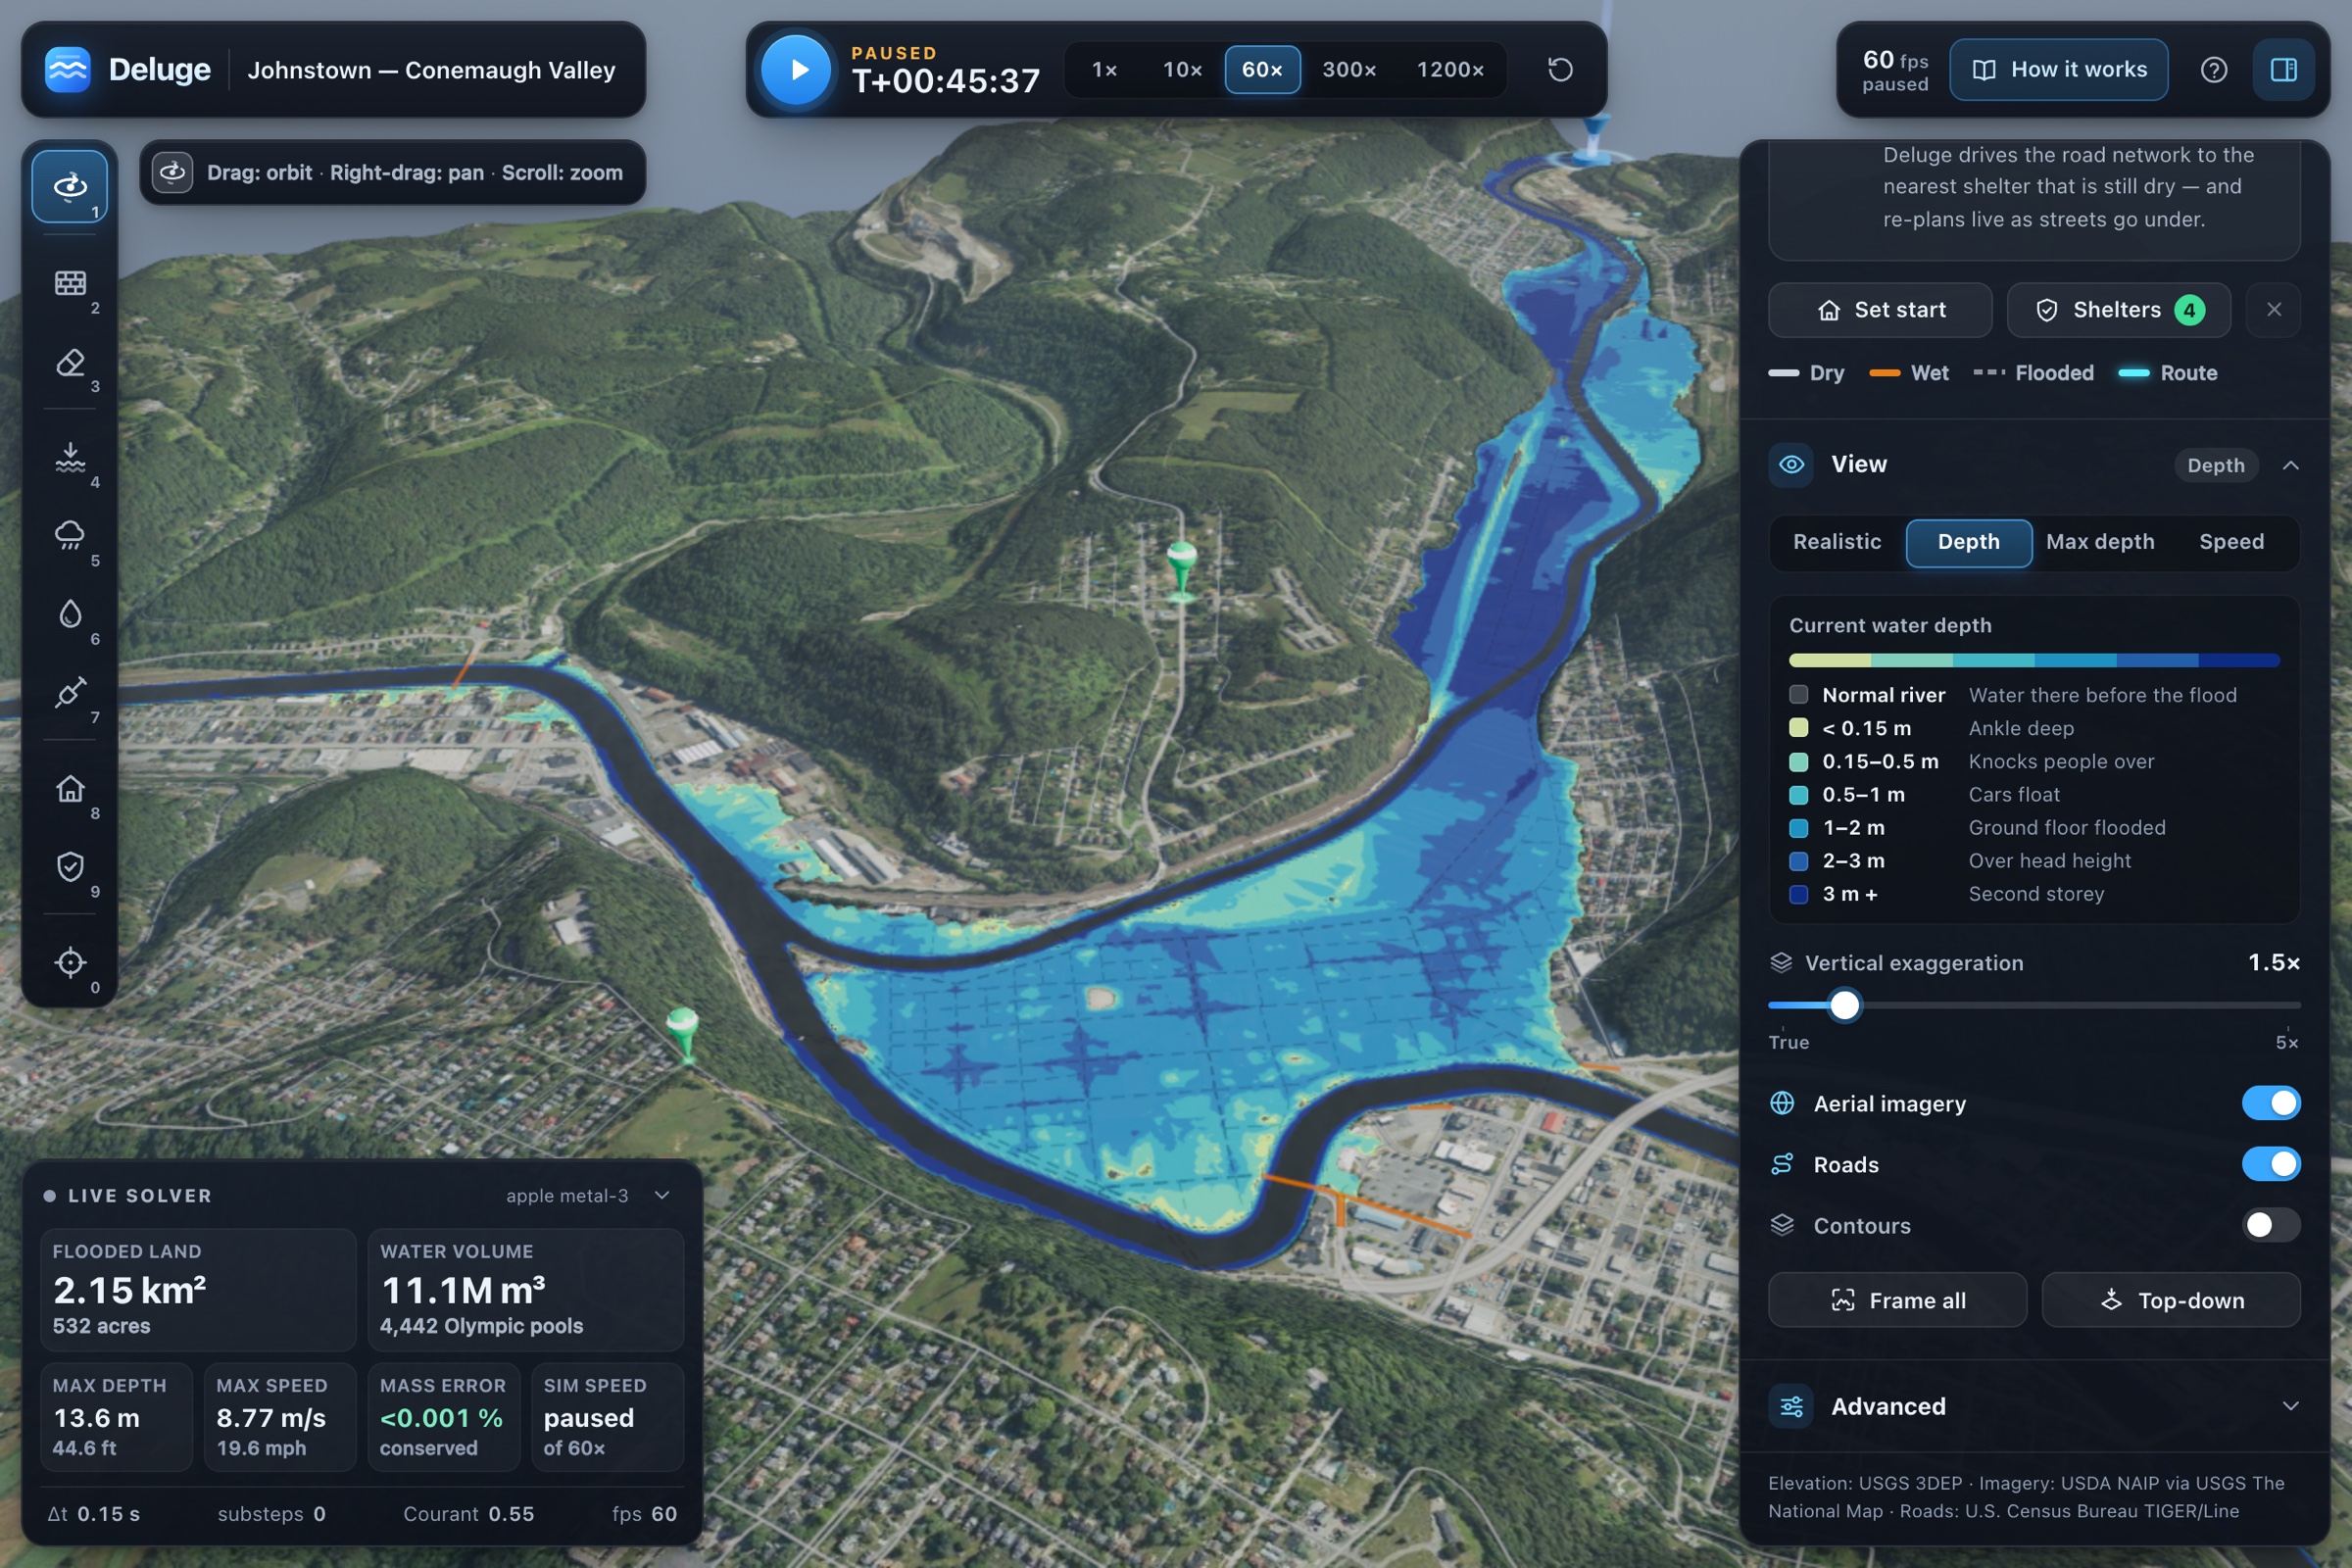
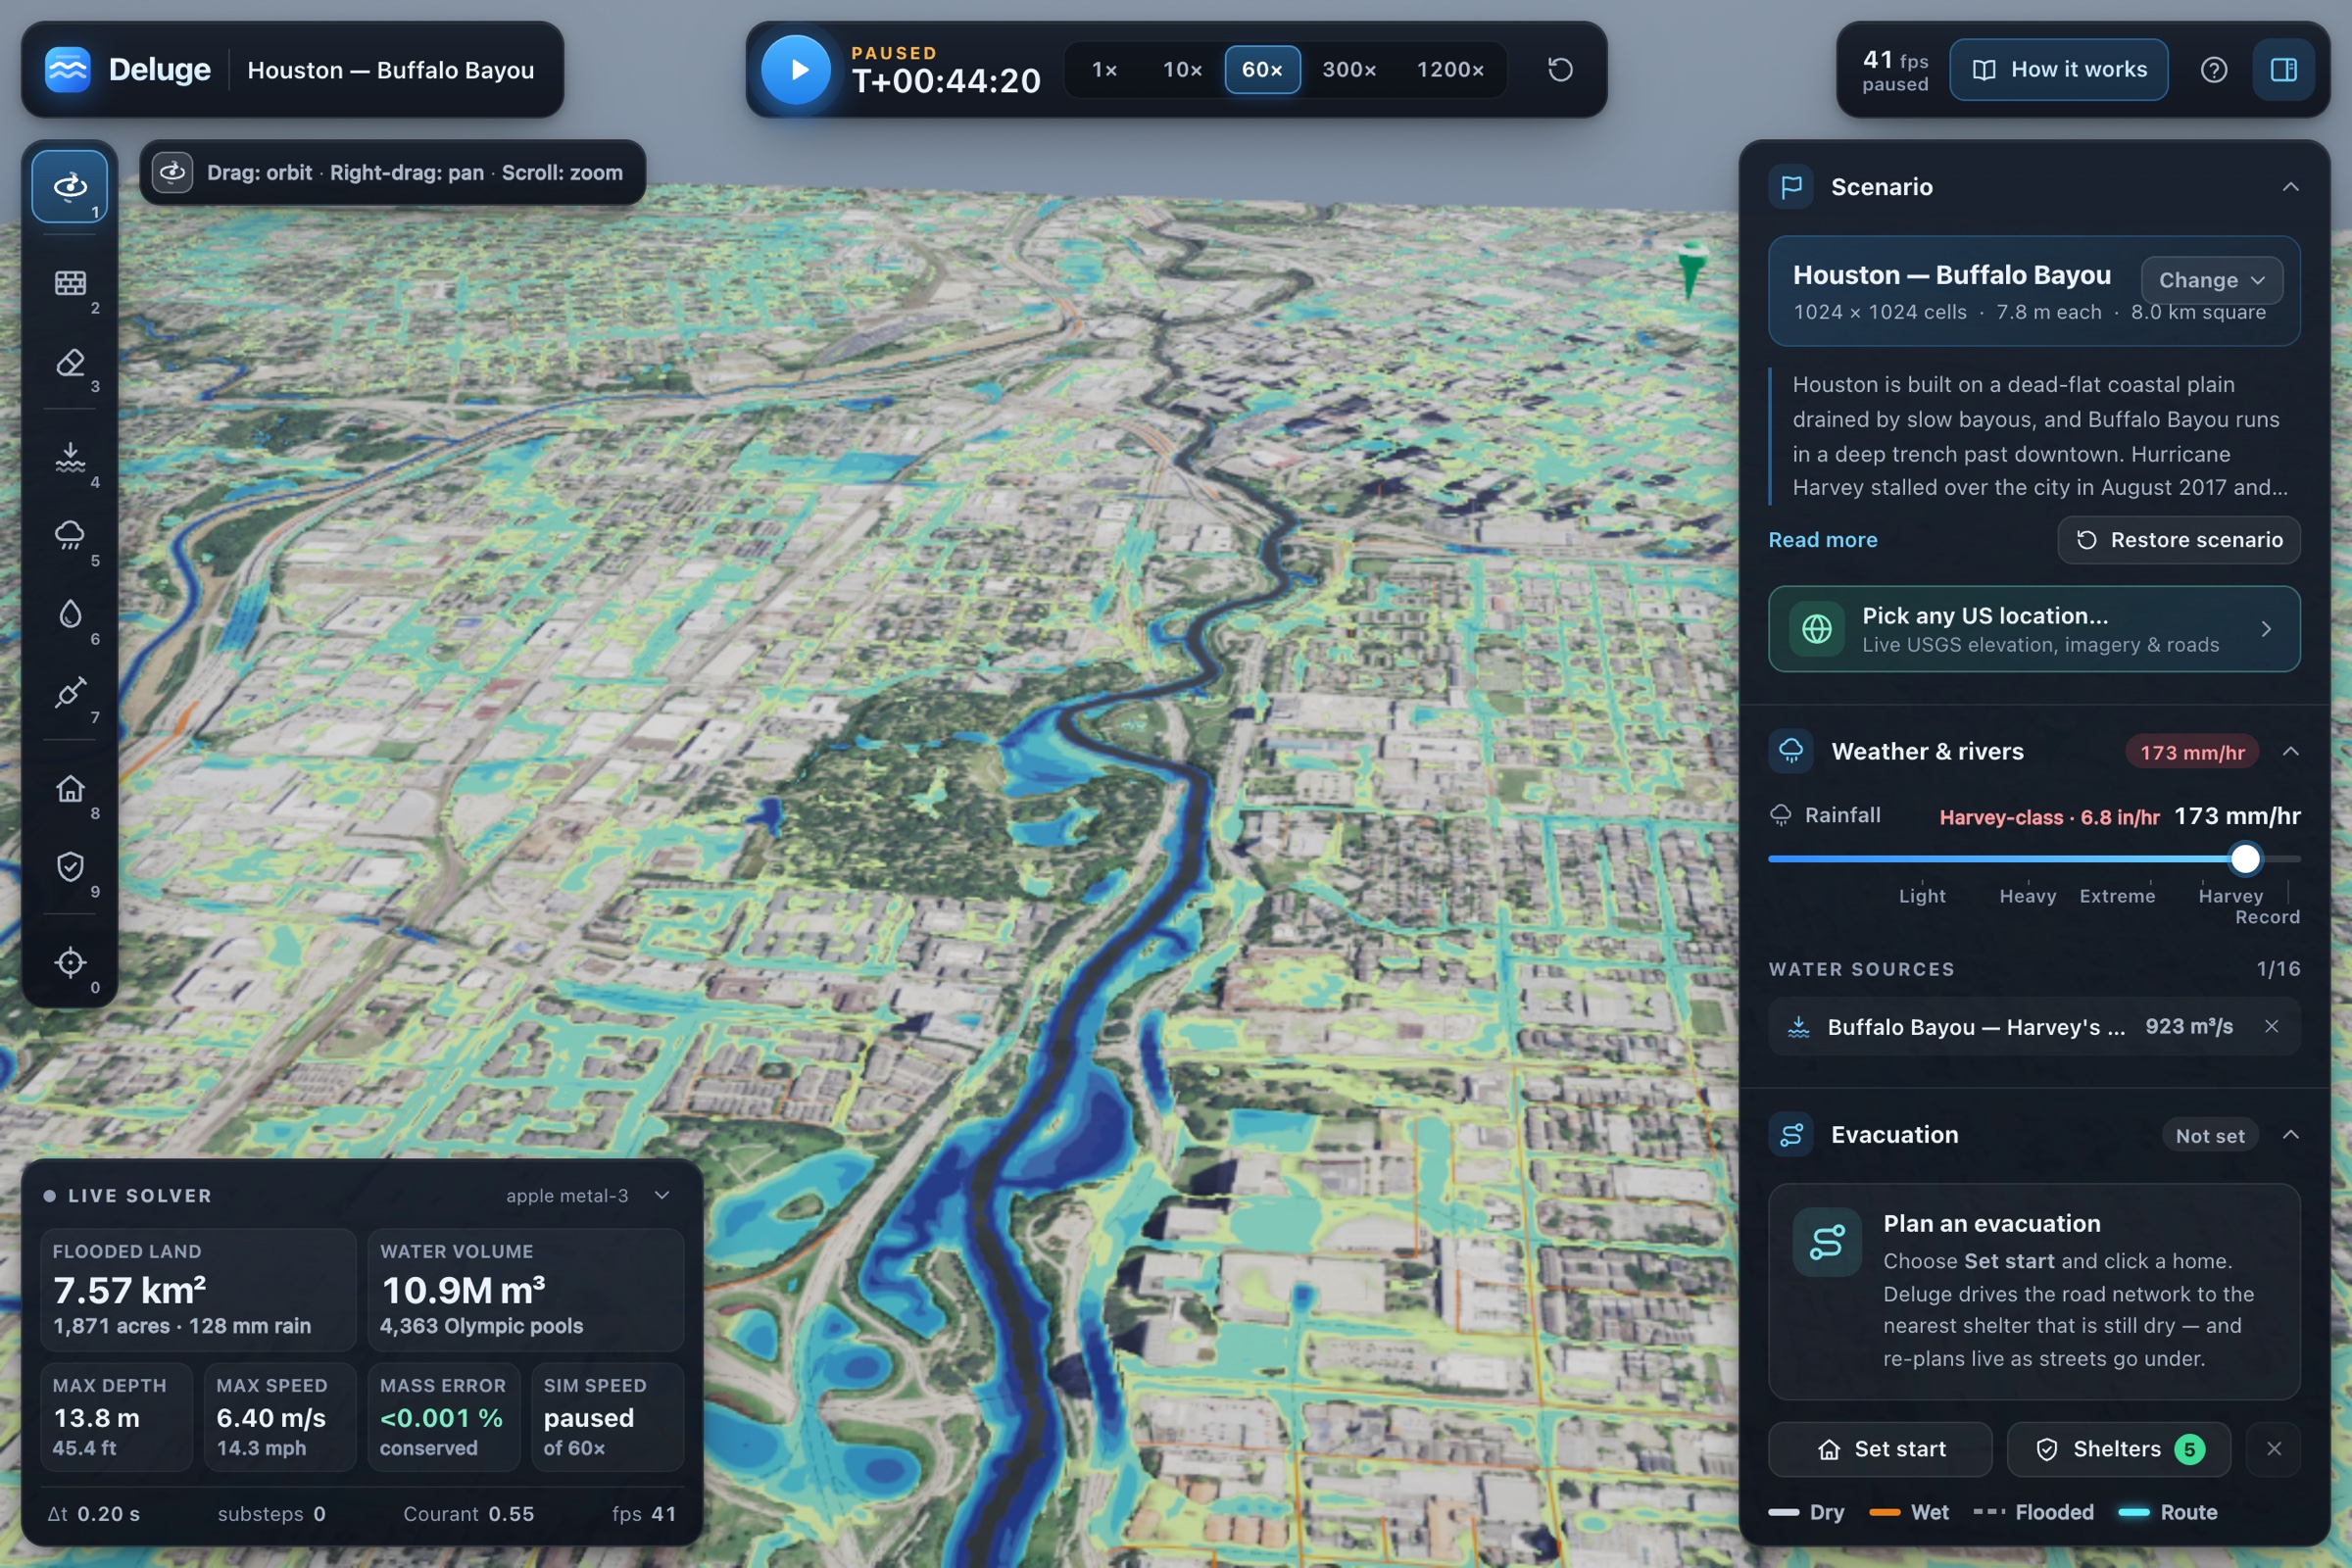
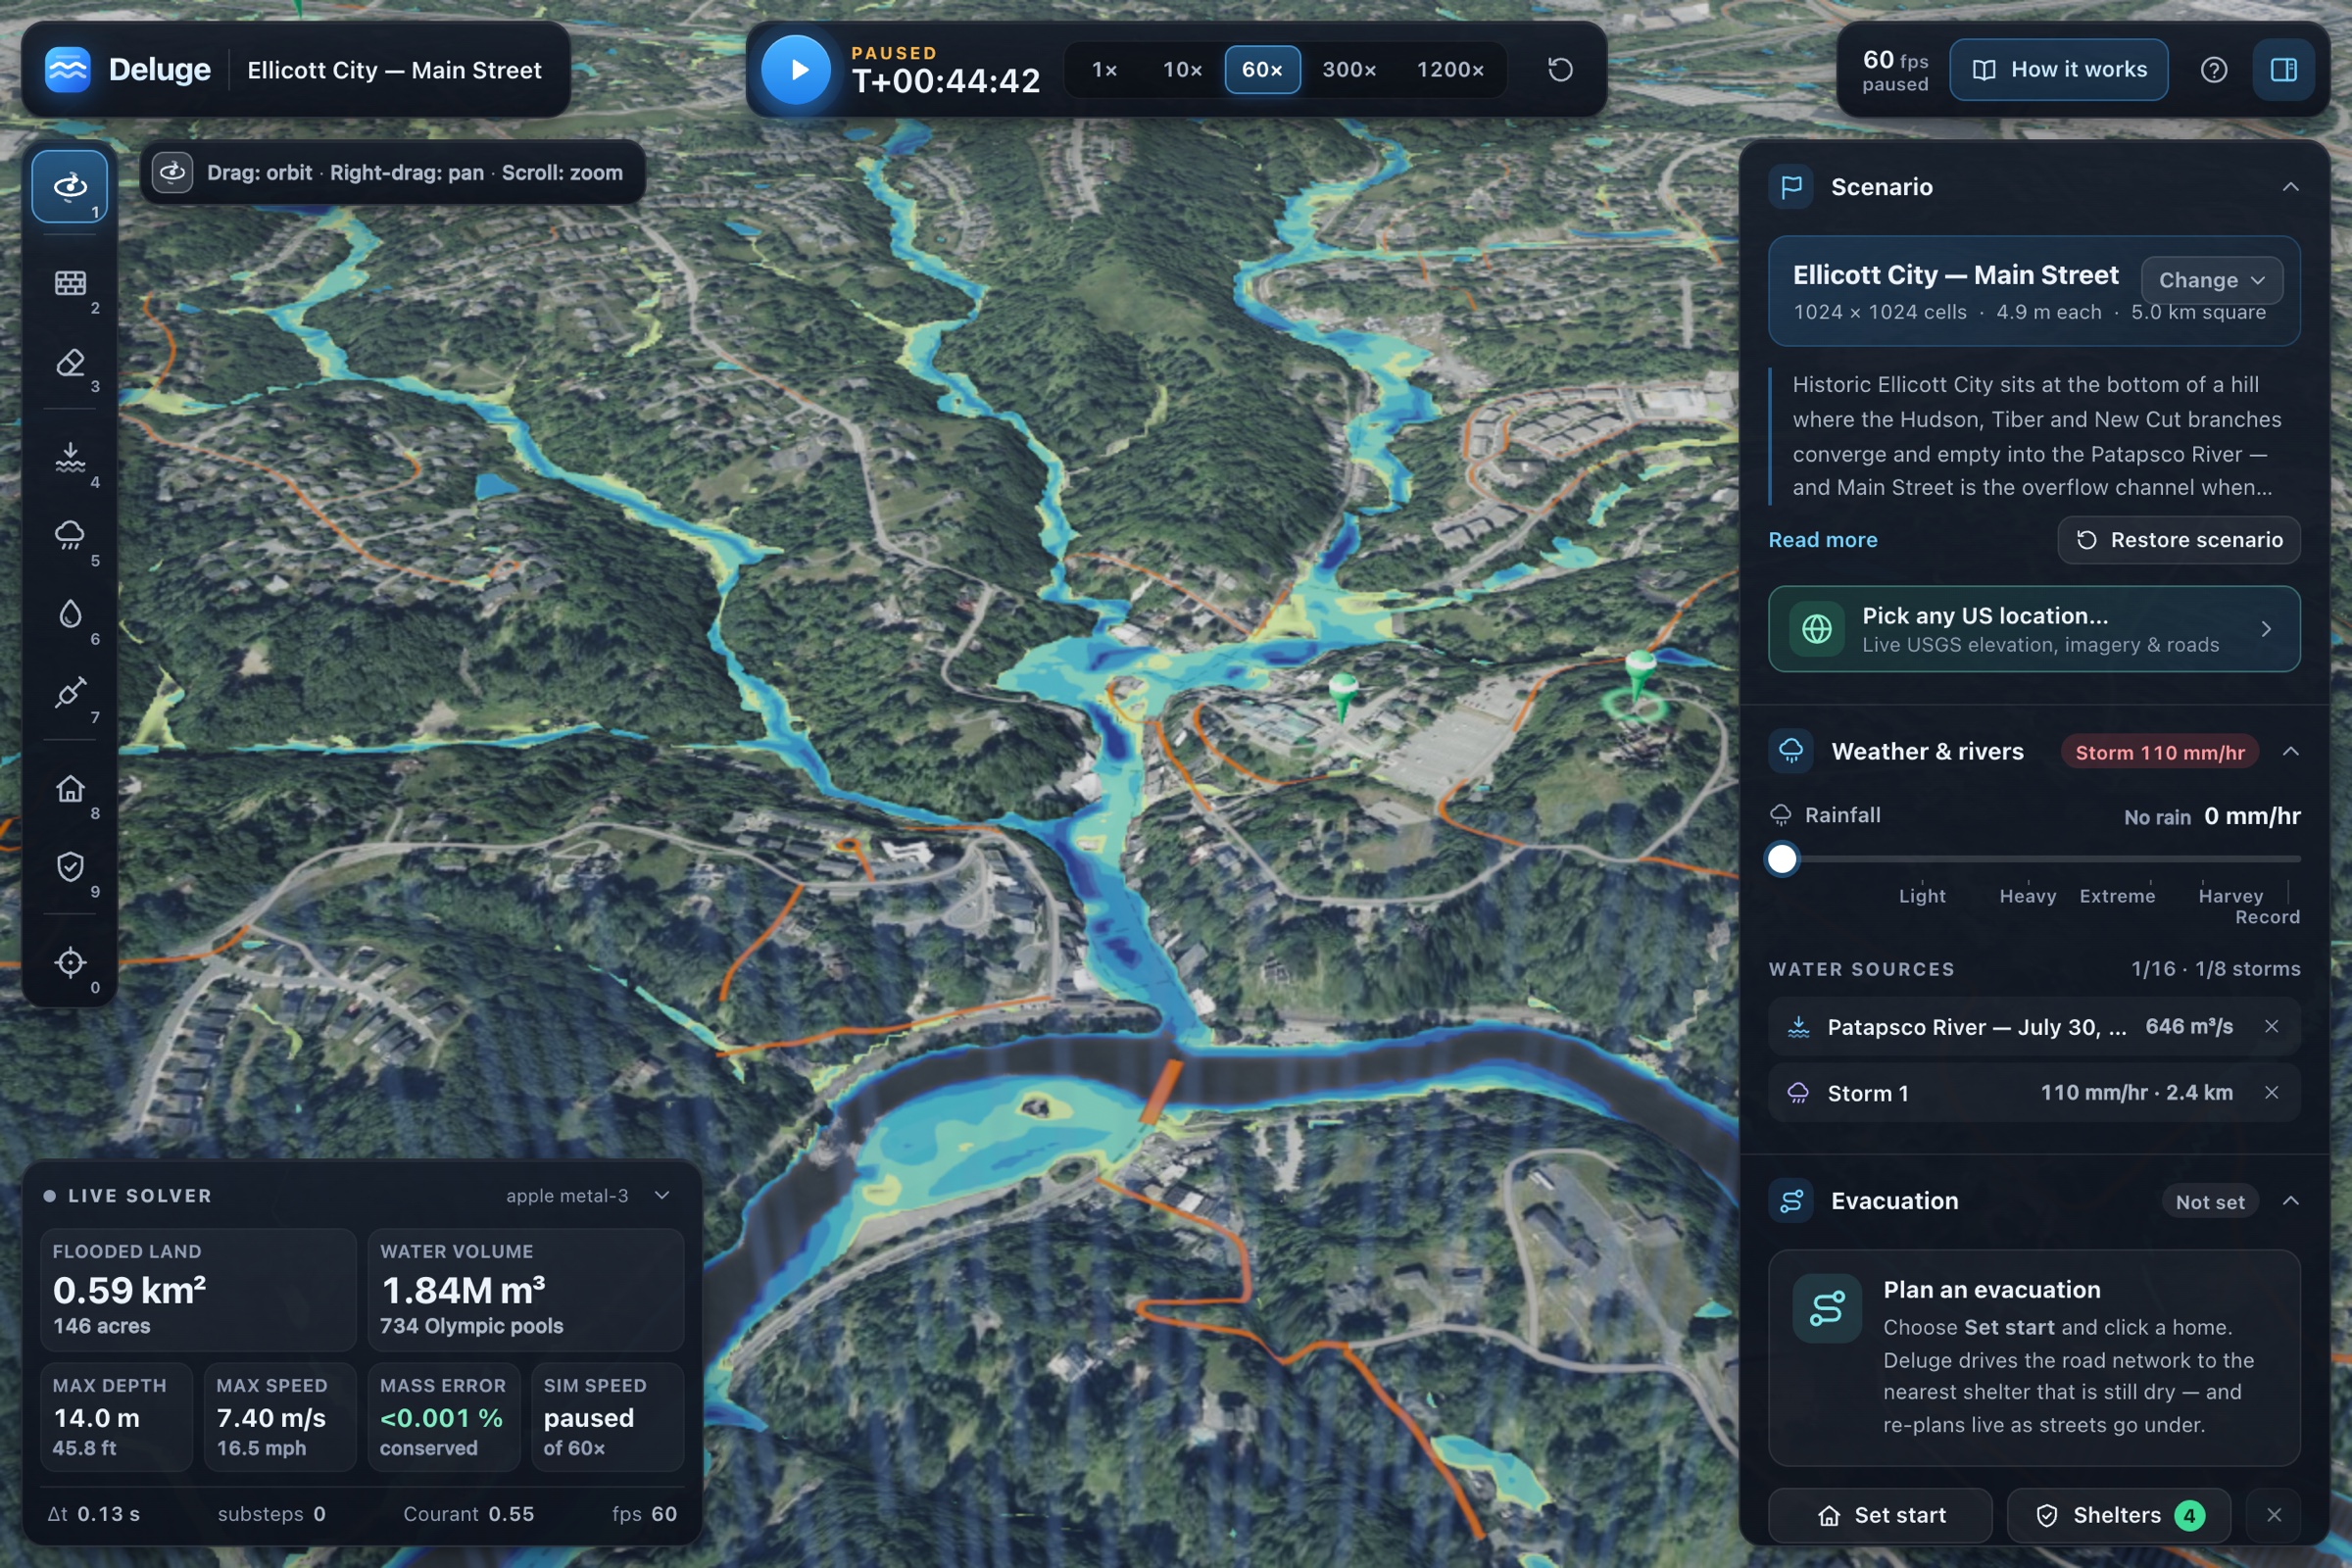
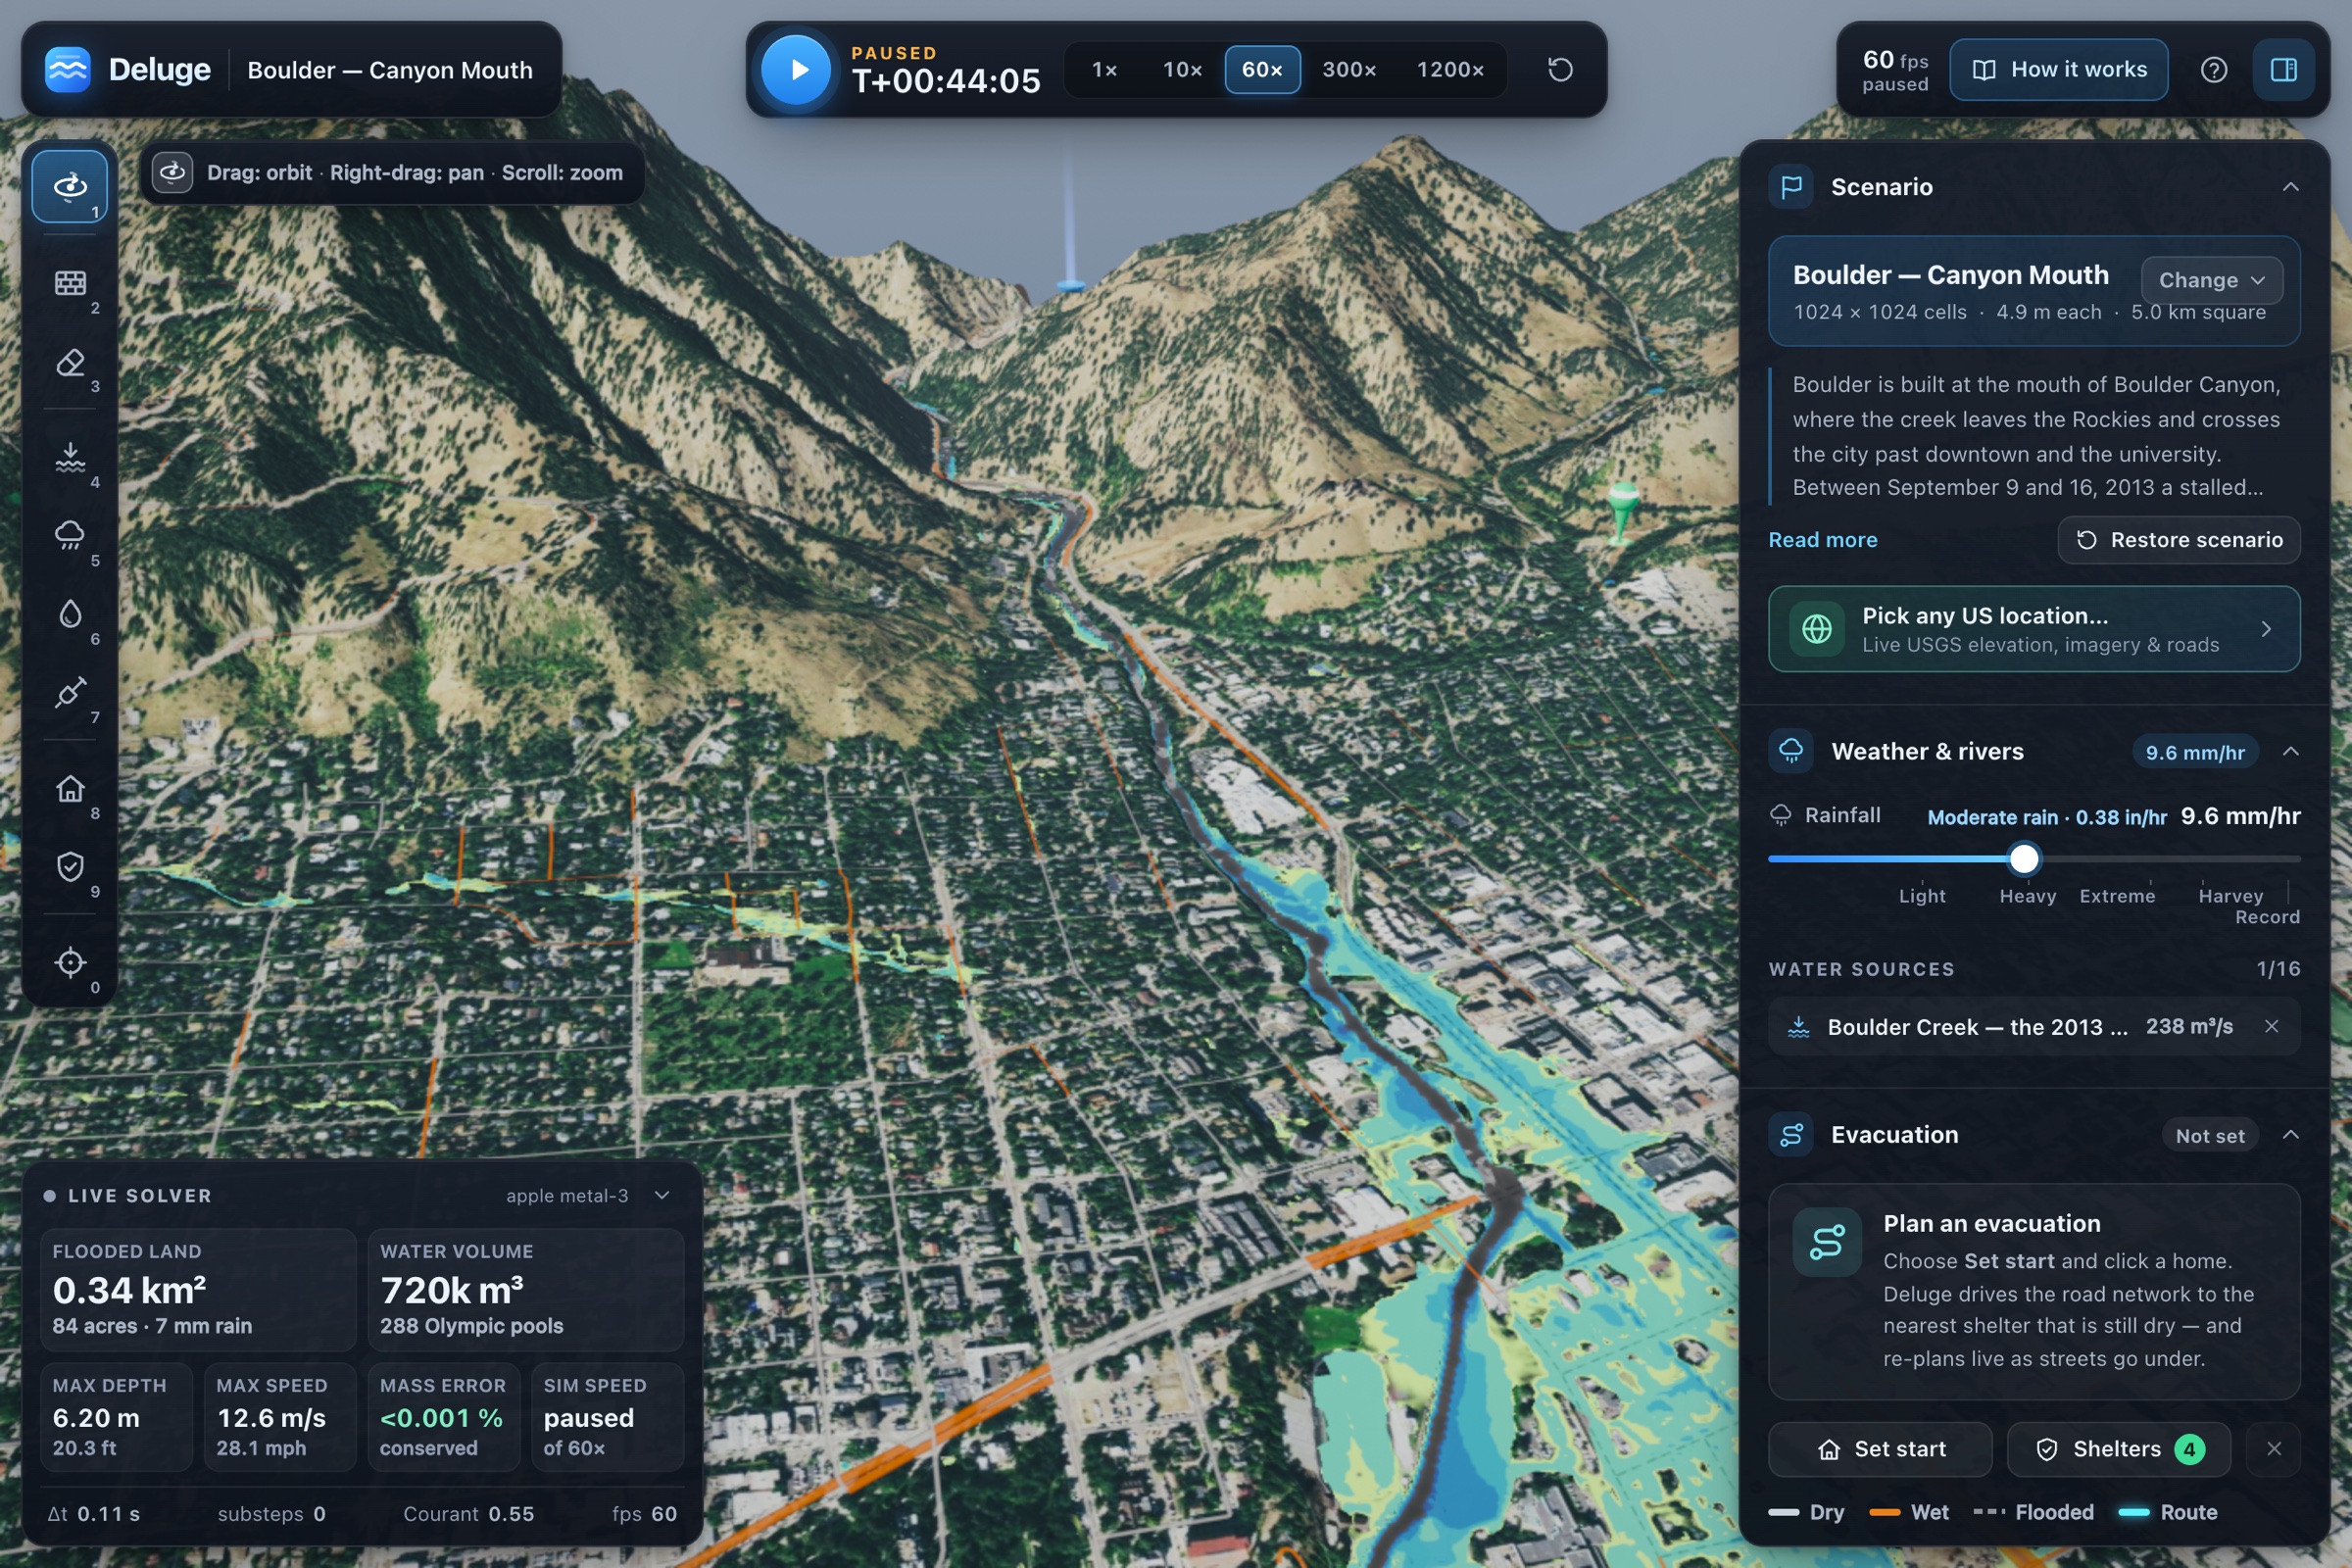
Inspiration
In light of the recent floods in Nepal, we wanted to look at how technology could help people respond to floods faster.
On August 26, 2026, rock and glacier ice collapsed from Langtang Lirung and fell into the Lhende Khola, causing a major flood that traveled through the Bhote Koshi, Trishuli, and Narayani rivers. The flood destroyed bridges, roads, and communities throughout the region.
One thing that stood out to us was how little warning people had. The first SMS alerts were sent at 09:15–09:16, while the flood reached Betrawati at 09:20.
That gave people around four minutes of warning.
Existing flood models can simulate where water will spread and which areas will be affected, but they usually require specialized software and hardware and are not designed to give people results immediately.
We wanted to see if we could make this much more accessible.
So we built Deluge, a real-time flood simulator that runs directly on your GPU and lets you see how flooding affects an area, roads, and evacuation routes.
What it does
Deluge uses real elevation data to simulate how water moves through an area.
You can:
- Raise the river level and see which areas and streets flood.
- Draw your own levees and immediately see how much land and how many roads they protect.
- Change rainfall levels and see how additional rain affects the flood.
- Plan evacuation routes to the nearest dry shelter using the real road network. If a road reaches 30 cm of water, it becomes impassable and Deluge automatically finds another route.
- Turn off the numerical safeguards and see what happens when the flood simulation becomes unstable.
For our Pittsburgh demo, you can raise the three rivers to the 1936 record flood level of 46 ft and see how areas like Downtown, the North Shore, and the Strip District are affected.
The simulation can run completely offline using built-in data, or load USGS elevation, aerial imagery, and road data for other locations in the US.
How we built it
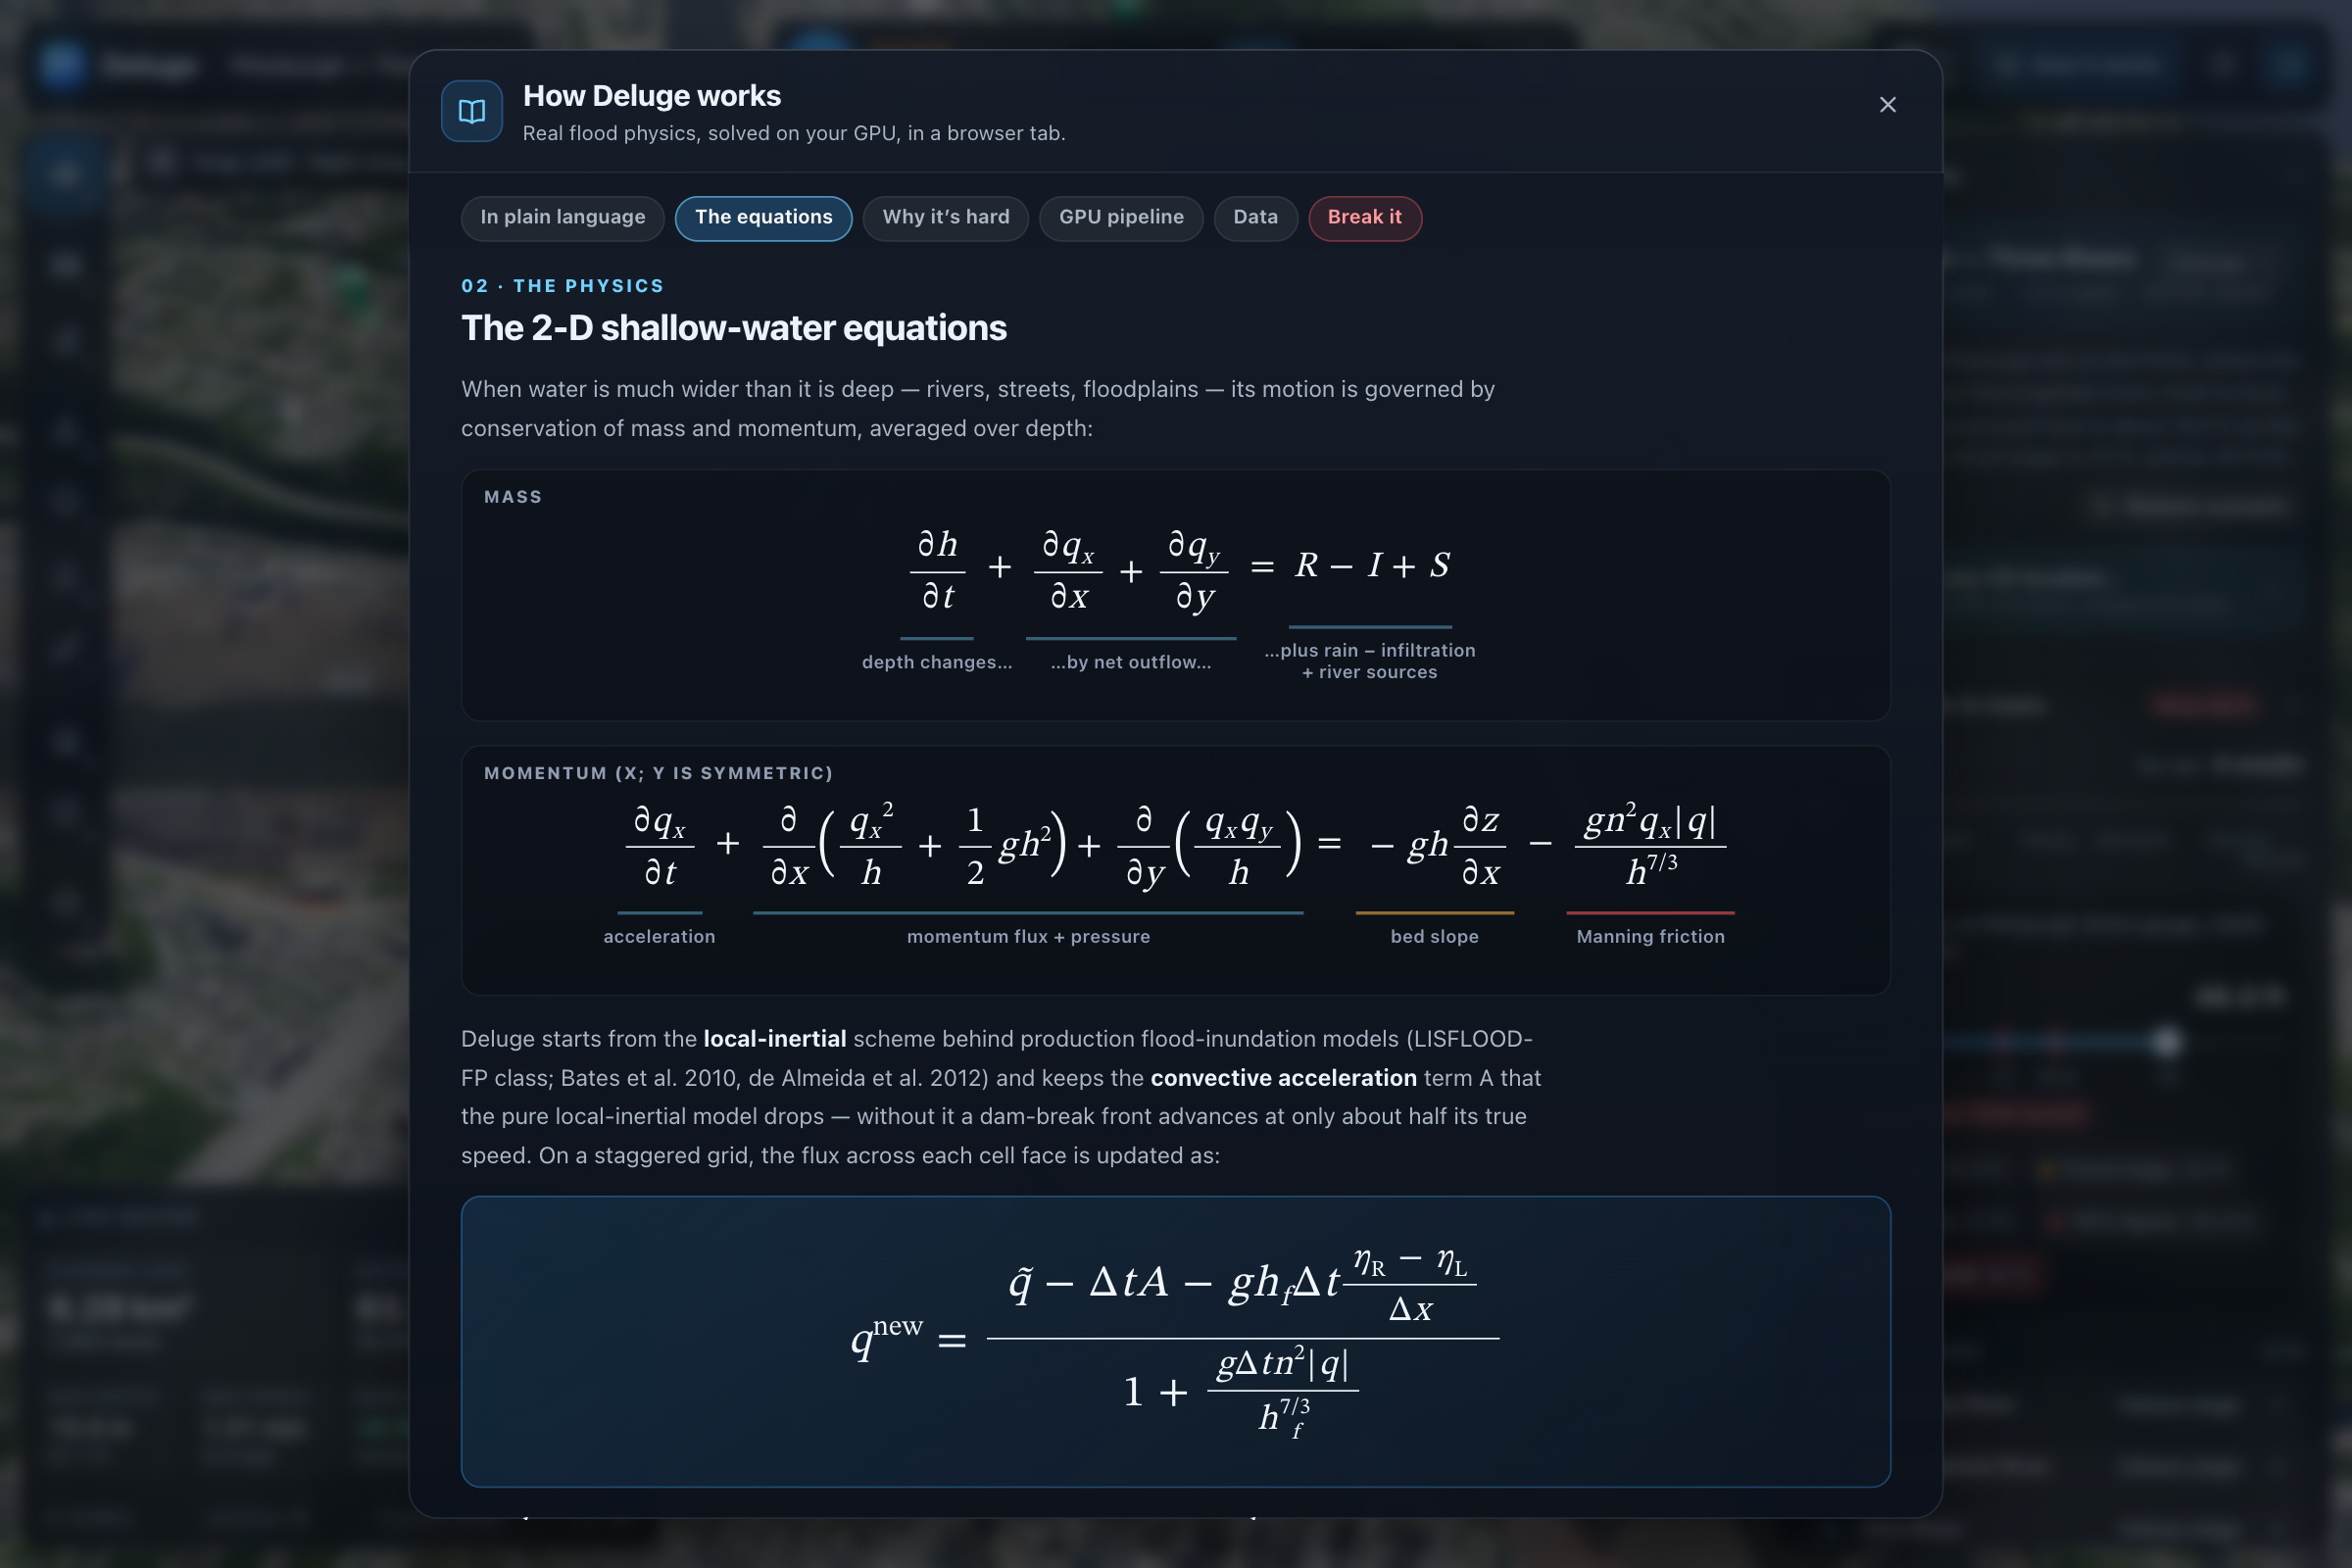
For the actual flood simulation, we used the 2D shallow-water equations:
$$ \frac{\partial h}{\partial t} + \nabla \cdot \mathbf{q} = R - I, \qquad \frac{\partial \mathbf{q}}{\partial t}
- \nabla!\cdot!\left(\frac{\mathbf{q}\otimes\mathbf{q}}{h}\right)
- g h \nabla (z+h) = -\,\frac{g\,n^{2}\,\mathbf{q}\,|\mathbf{q}|}{h^{7/3}} $$
Here, $h$ represents water depth, $\mathbf{q}$ represents water flow, $z$ represents elevation, $n$ is Manning's roughness, $R$ is rainfall, and $I$ is infiltration.
We solve these equations using a local-inertial scheme on a $1024\times1024$ grid with 7.8 m cells.
We implemented the simulation using WebGPU compute shaders, which lets us calculate the water movement for over a million cells in parallel on the GPU.
We also added four main components to keep the simulation stable:
- CFL-limited adaptive timesteps to prevent water from moving too far during one simulation step.
- Semi-implicit friction to keep shallow water stable on steep terrain.
- Well-balanced face depths so still water remains still on uneven terrain.
- A positivity-preserving flux limiter so a cell cannot output more water than it contains.
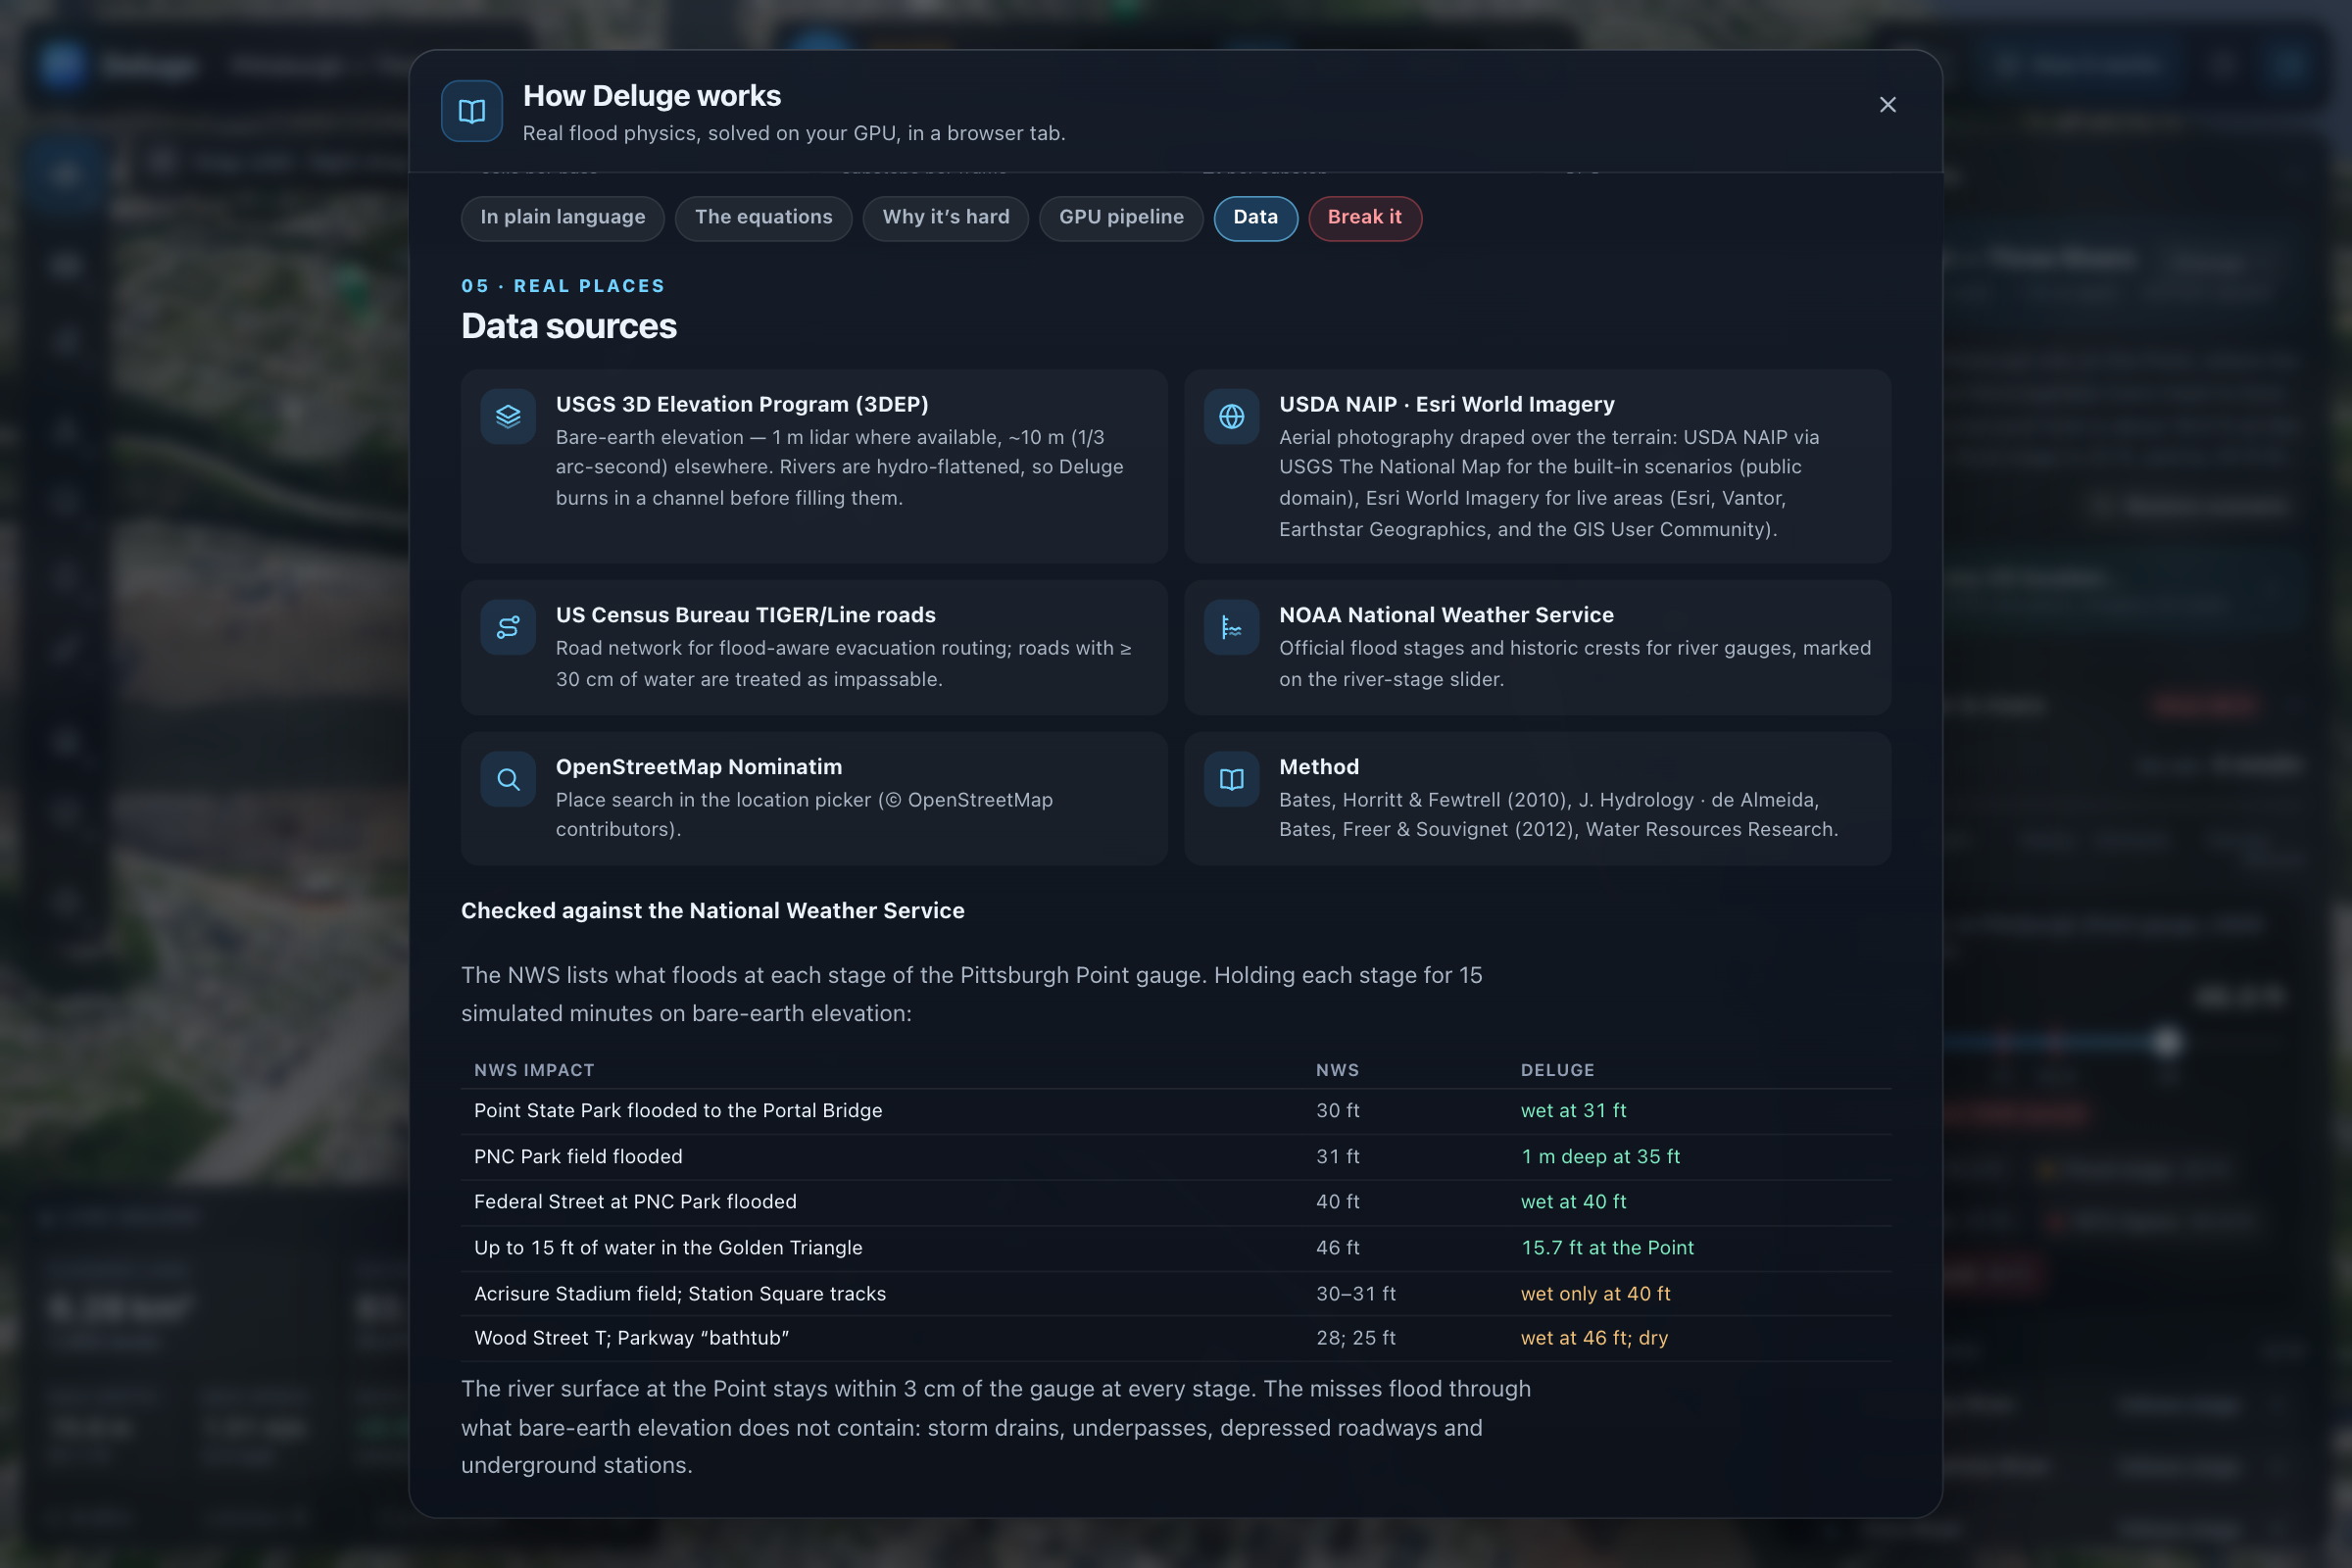
For the data, we use USGS 3DEP elevation, USDA aerial imagery, and Census TIGER roads. We turn the road data into a graph that we can use for evacuation routing.
As the simulation runs, we read flood data back from the GPU and update evacuation routes around roads that have become unsafe.
Everything runs directly in the browser without requiring a backend.
Challenges we ran into
One problem was that US elevation data does not contain the actual bottom of rivers. The data is hydro-flattened, so the river is represented around its water surface. We had to reconstruct river channels from river centerlines so water could actually flow through them.
We also had an issue where water started flowing upstream. At Pittsburgh's 1936 flood level, water was leaving the edge of our simulation at around 8 m/s. We originally thought there was a problem with our flood physics, but the issue was our boundary geometry. Our river boundary covered the normal channel but not the wider area created when the river flooded.
Another problem was numerical instability. Moving the river level slider several meters instantly basically created a dam break inside the simulation. We fixed this by gradually changing the water level over simulated time and adding safeguards to the solver.
Performance was also a challenge. We are running a $1024\times1024$ simulation while rendering the terrain and water at the same time. On a fanless MacBook Air, sustained GPU usage can cause throttling, so we created an adaptive work budget that changes how much simulation work happens per frame.
Finally, we wanted Deluge to work without internet because we could not rely on venue Wi-Fi. We added offline data for our built-in scenarios and changed our loading system so failed network requests do not prevent the app from starting.
Accomplishments that we're proud of
We were able to get the simulation to run in real time while still getting results close to a much higher-resolution reference simulation.
Compared with a $4096\times4096$ reference run, which contains 16× as many cells, our simulation had:
- 0.92% difference in total flooded area
- 98.0% flood-extent overlap
- 6 cm median water-depth error
We also tested the physics separately. A still lake stays still to $1.9\times10^{-5}$ m/s, our dam-break simulation matches the analytic Ritter solution within 1.6%, and water is conserved to around one part in five million.
For Pittsburgh, our results also line up with published National Weather Service flood stages. For example, our simulation shows PNC Park's field flooding around the reported 31 ft river level.
The simulation can run at 60 FPS on a fanless MacBook Air, with our record-flood and heavy-rain scenario running at around 165× real time.
We also built 385 automated tests and 14 end-to-end demo tests that can run completely offline.
What we learned
One thing we learned was how important numerical stability is when building a simulation like this. Small problems in the solver can quickly turn into completely unrealistic results.
We also learned that the real-world data caused just as many problems as the flood simulation itself. Elevation, rivers, roads, imagery, and buildings all come from different datasets, and getting them to work together correctly was a large part of building Deluge.
Another thing we focused on was making sure the numbers we showed were accurate. For example, our median depth error is 6 cm, but the worst 1% of flooded cells differ by more than 1.28 m. We wanted to show both instead of only reporting the better number.
Most importantly, the Nepal floods showed us how important response time can be. If people only have a few minutes of warning, flood information needs to be available quickly and on hardware people already have access to.
What's next for Deluge
One thing we want to add is a Betrawati simulation based on the recent Nepal flood. We want to simulate an 8 km area around the Rasuwa–Nuwakot border and model the flood wave moving down the Trishuli.
To do this, we want to expand our data pipeline beyond the US using Copernicus DEM and OpenStreetMap. This would let Deluge work in more places, although global 30 m elevation data is less detailed than the lidar data available in the US.
We also want to add coastal flooding, where storm surge enters from an ocean boundary instead of raising a river.
For evacuation, we want to go beyond showing the safest route right now. We want to predict when individual roads will flood and the last safe time someone can leave an area.
We also want to use lidar data to get more accurate building heights instead of estimating them.
Finally, we want to make Deluge work well on phones. The simulation already runs inside a browser, so the main next steps are optimizing it for a smaller grid and creating a touch interface.
The goal is to make flood simulation something that can be used quickly, directly, and on hardware people already have.
Built With
- anthropic
- census
- github
- playwright
- usgs
- vercel
- webgpu

Log in or sign up for Devpost to join the conversation.