-
-
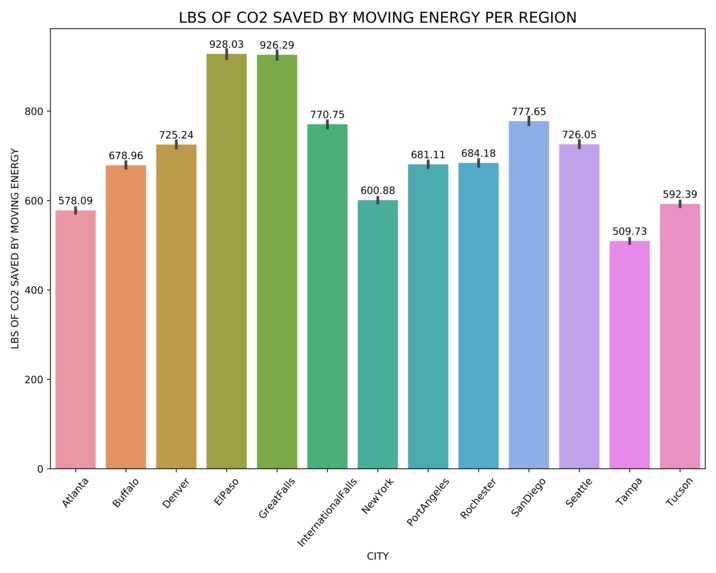
Lbs of CO2 Saved By Moving Energy

What it does
The algorithm we developed provides the:
1) Best location and building type to implement a solution 2) A graphical UI that shows how much CO2 can be saved per state as a function of time
How we built it
We loaded the corresponding meter consumption data per city and performed some cleanup, and we extracted the data MOER data for the past two years. We had difficulty determining the exact time range for which the meter data was initially extracted, and we assumed it matched up with MOER data from the year 2019.
With dates and corresponding data in sync, we computed the sum of energy consumption per building type per city for every hour. We matched it with MOER data for the same hour and city to determine the "cleanliness/dirtiness."
Using the data above and ignoring the case of whether neighbours could benefit from the energy, we applied the BrainWave AI solution (which reduces usage by 25%) to every single building of a given type. Hence, for the 13 cities in question, each with 3 types of buildings, we had 39 possible actions, and we could calculate the maximum LBS of CO2 saved by doing so. We also assumed that 10% of the energy saved (always at the lowest MOER rate) could be used when MOER is at its peak on the same day.
We build a web-interface capable of traversing the data for both the entire year and for any date/time in a given year. We also managed to produce a choropleth map to visualize this saving as a day and time function.
Challenges we ran into
We ran into a couple of challenges. One of them being is understanding the data. There were over a hundred files, which we took some time to analyze. This is where we lost most of the time. We had to change our approach towards the problem and resorted to using SQL instead of python for data manipulation. This, combined with our lack of understanding of the problem, lead us to the constant change in our plan of action.
Accomplishments that we're proud of
Even though the result is incomplete, we are certain that given more time, we would have completed this task is the biggest accomplishment. This was our first attempt to solve machine learning problems, and as a team, we were able to understand and conceptually apply machine learning solutions to them.
What we learned
We learned various machine learning approaches that could be used. Another important lesson we learned was that it is important to learn. We lost a lot of time trying to understand the data.
What we could have done better
Ideally, we would have added the building data and used data analytics to determine which approaches have the highest impact by using an ML optimization approach to converge on a solution with the lowest Coverall O2 emission.

Log in or sign up for Devpost to join the conversation.