-
-
about us
-
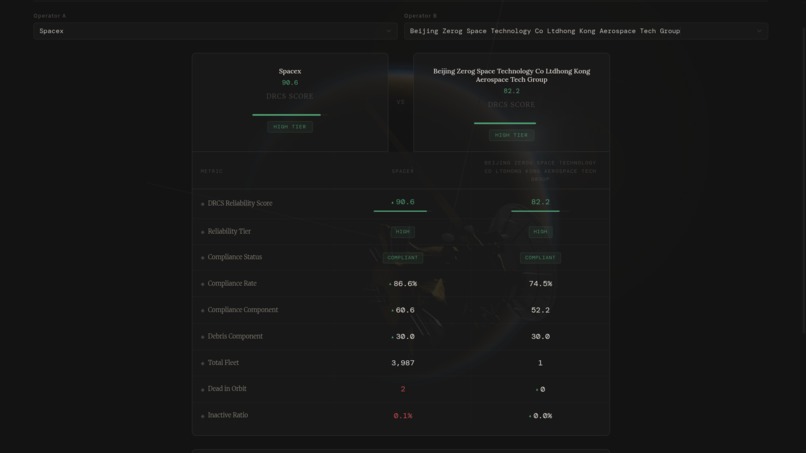
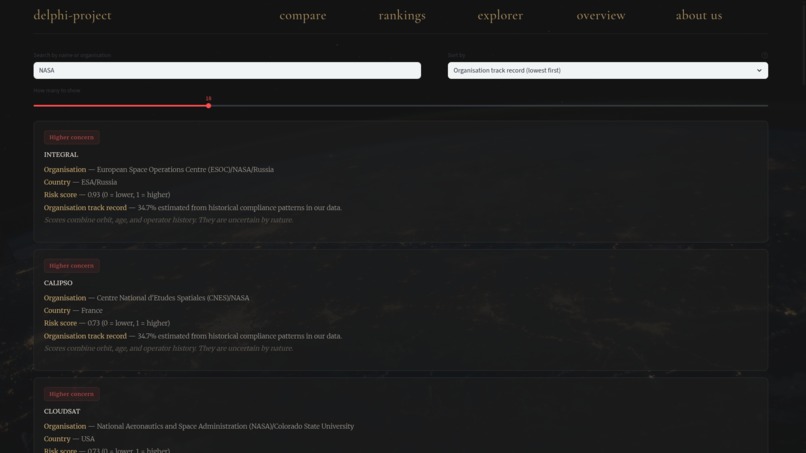
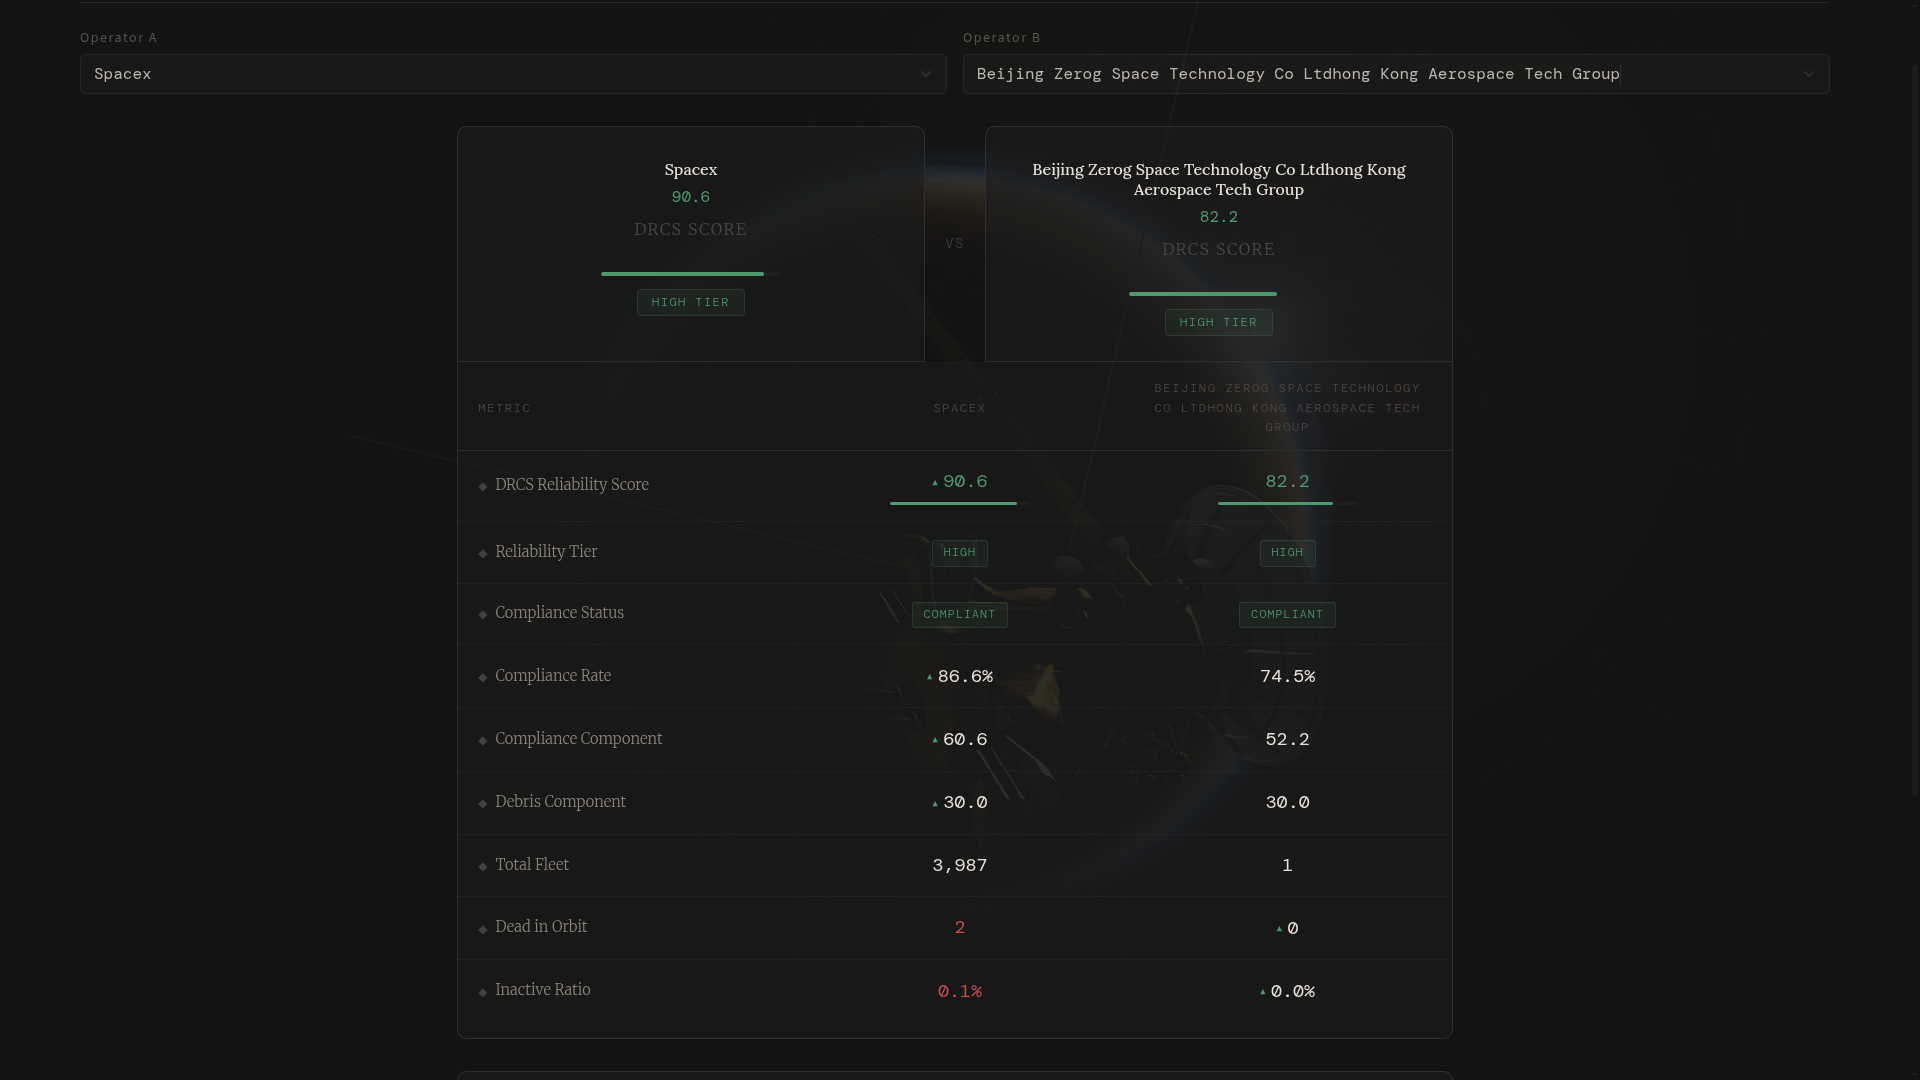
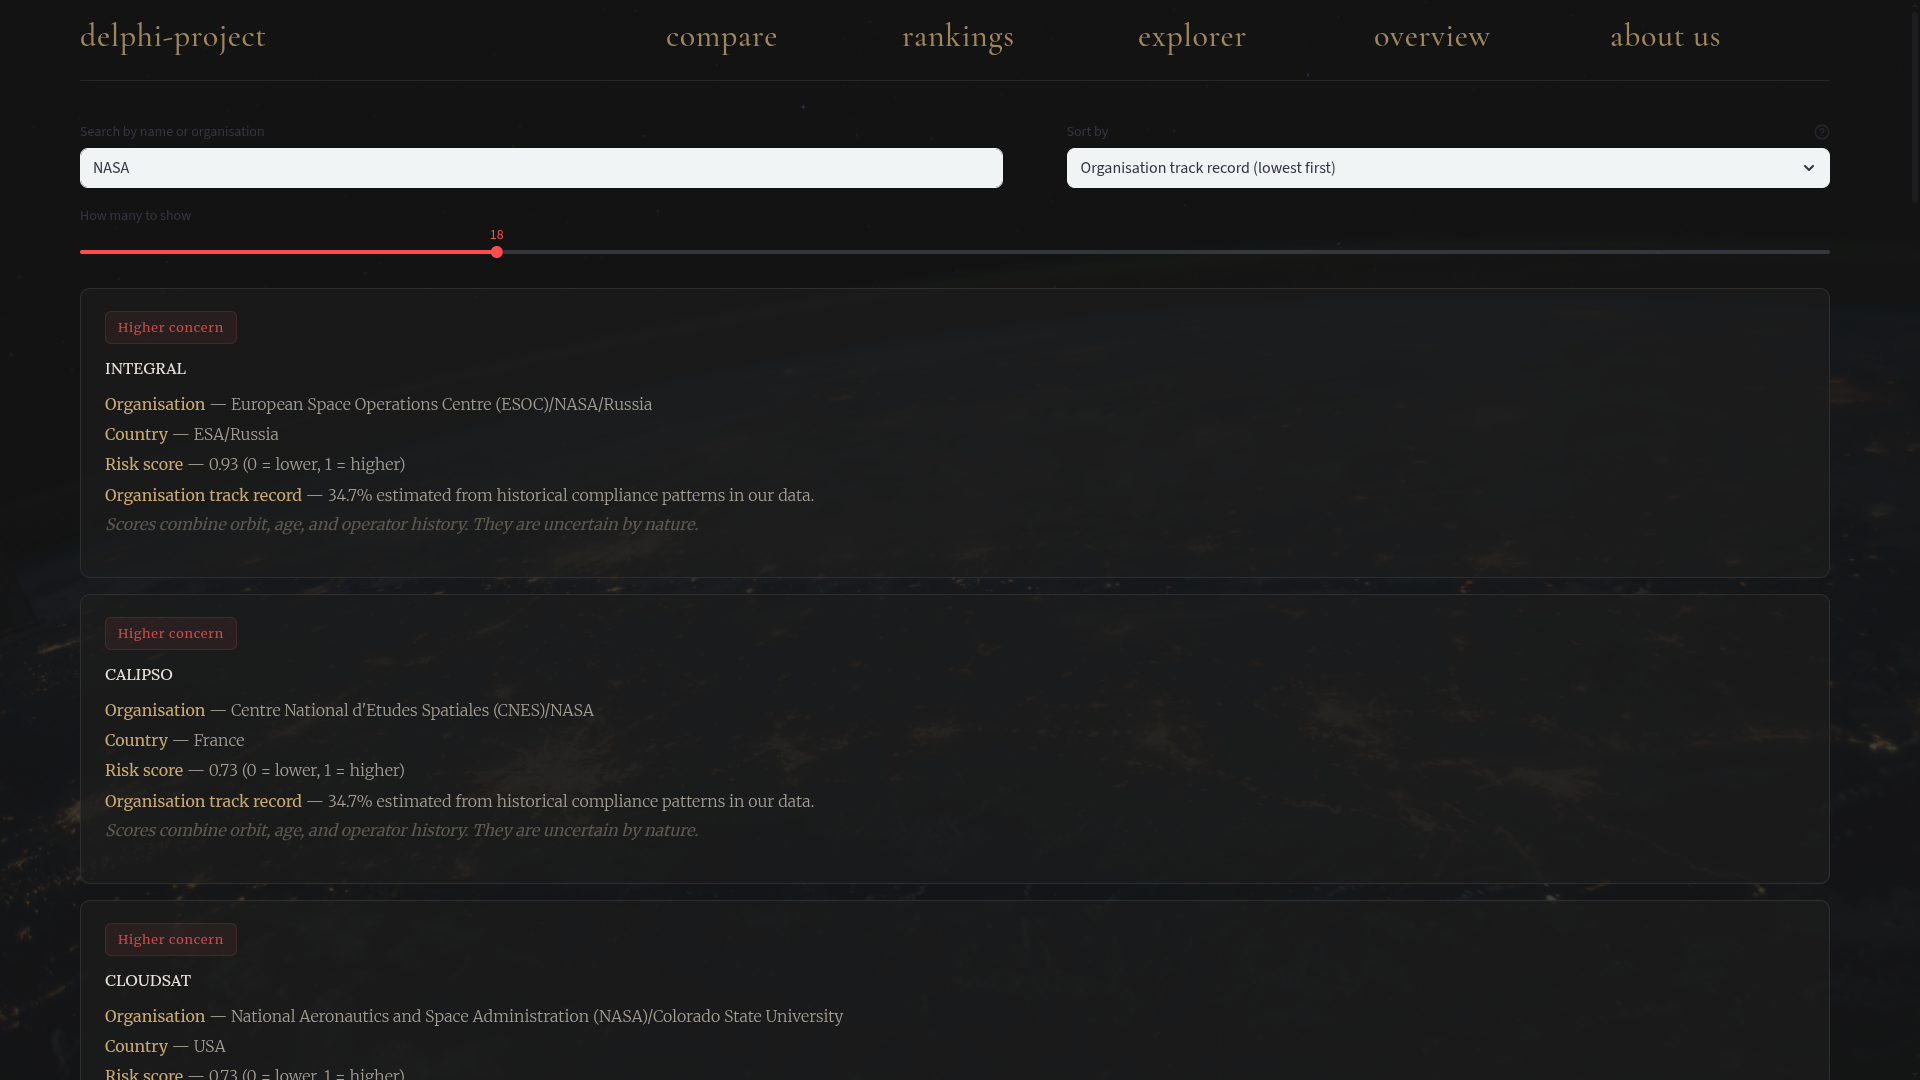
operator comparison screen
-
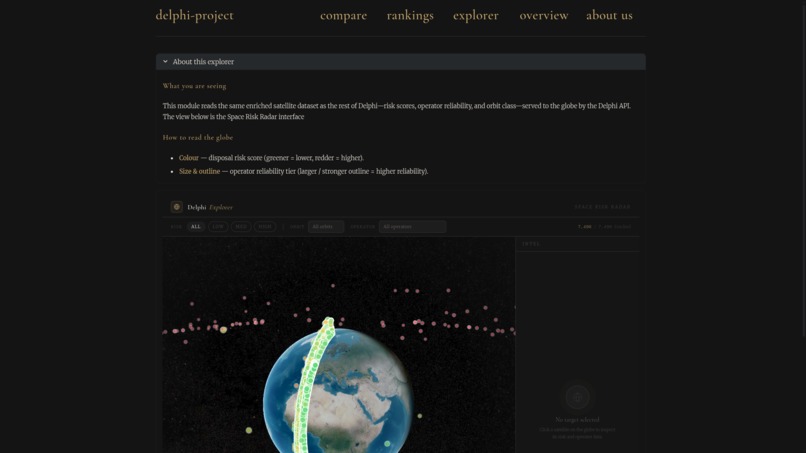
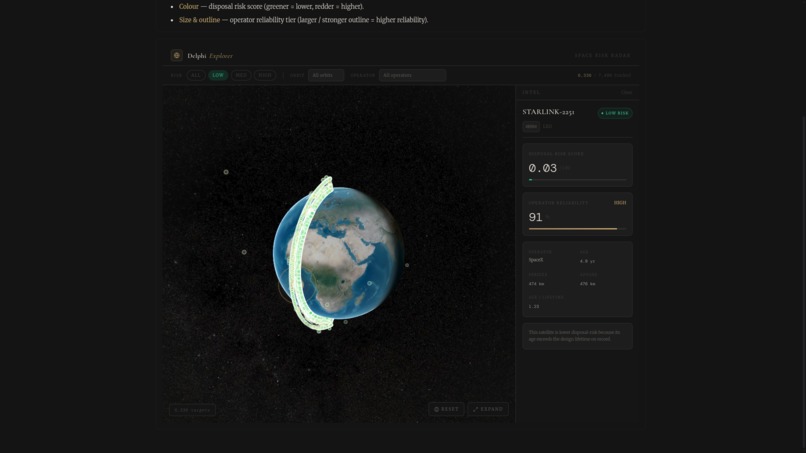
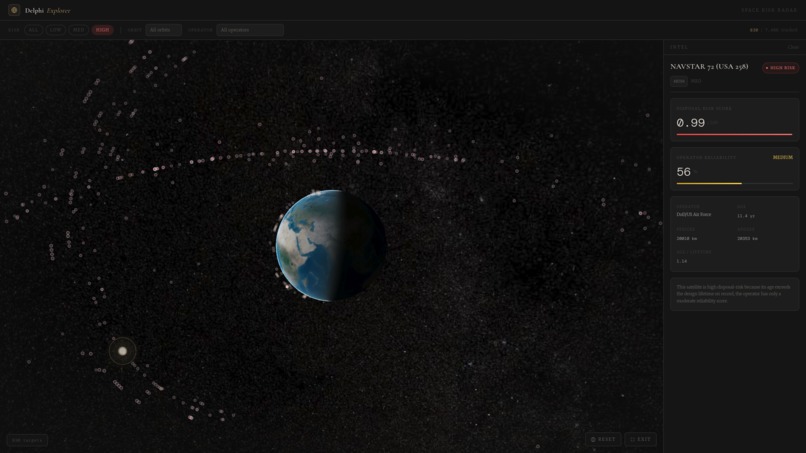
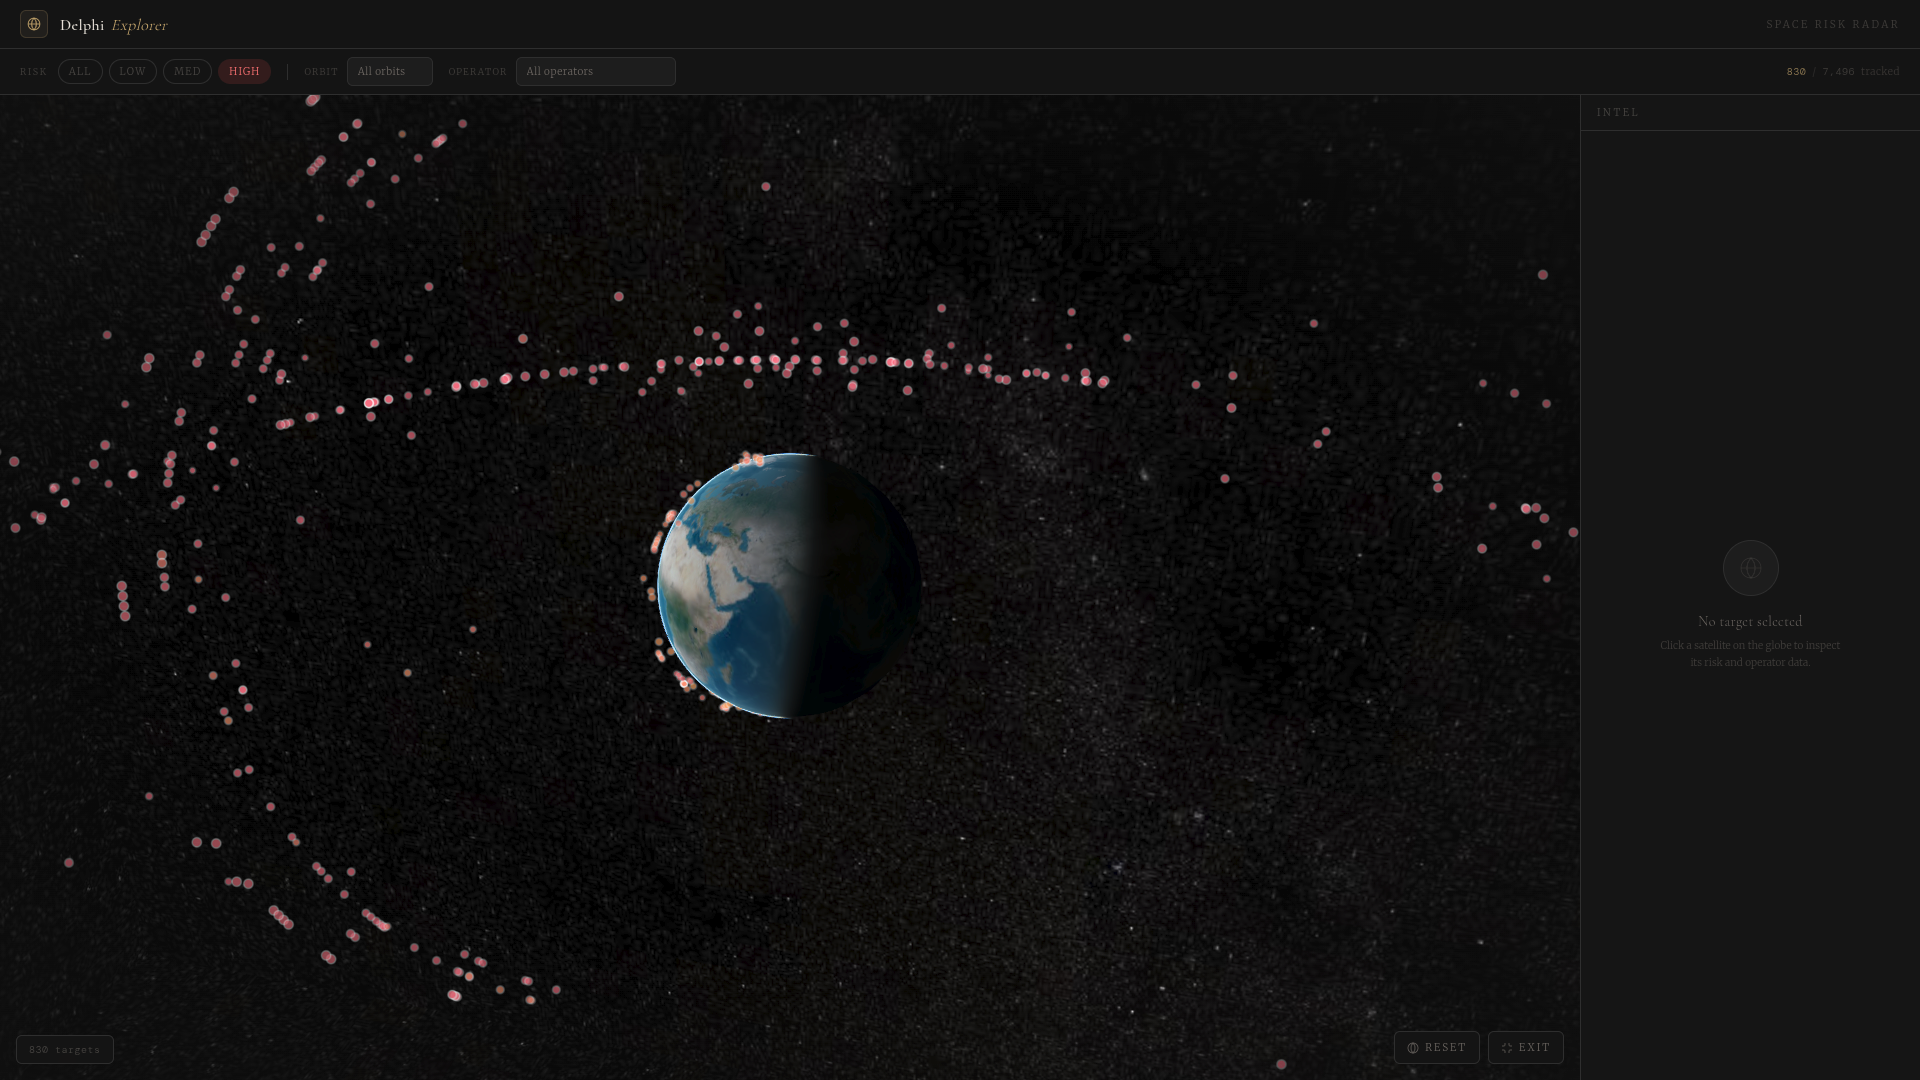
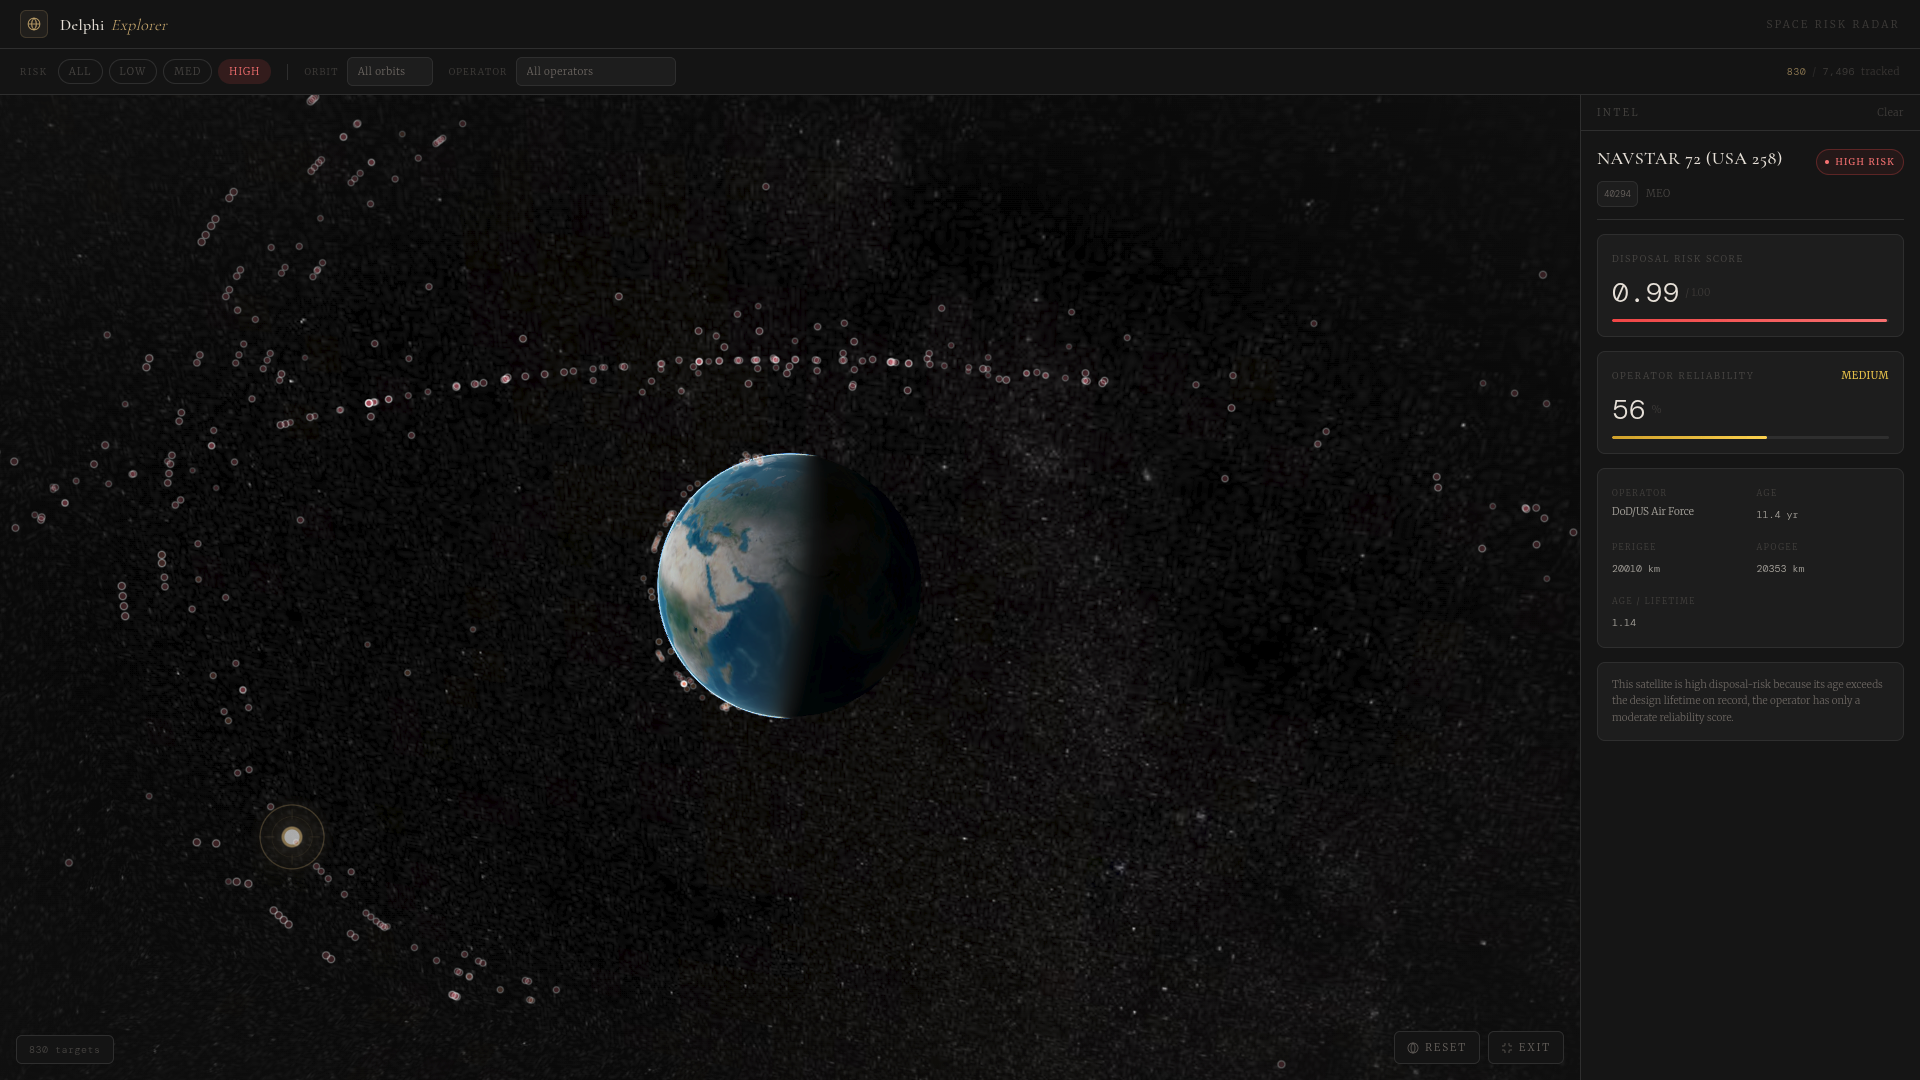
explorer screen (displays ALL satellites in orbit)
-
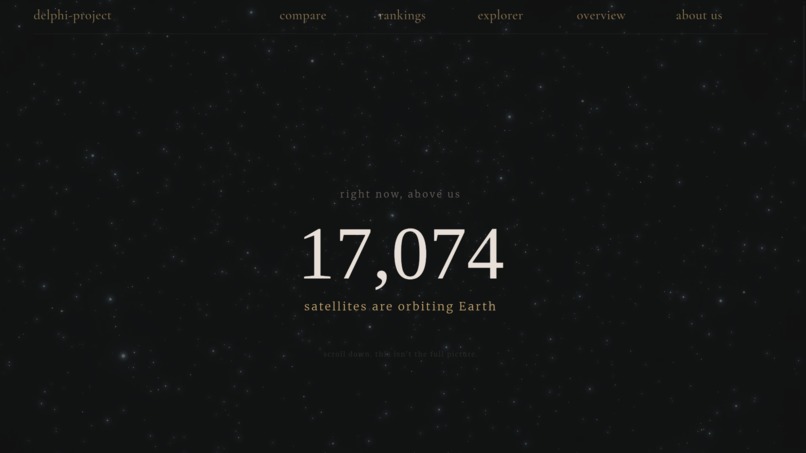
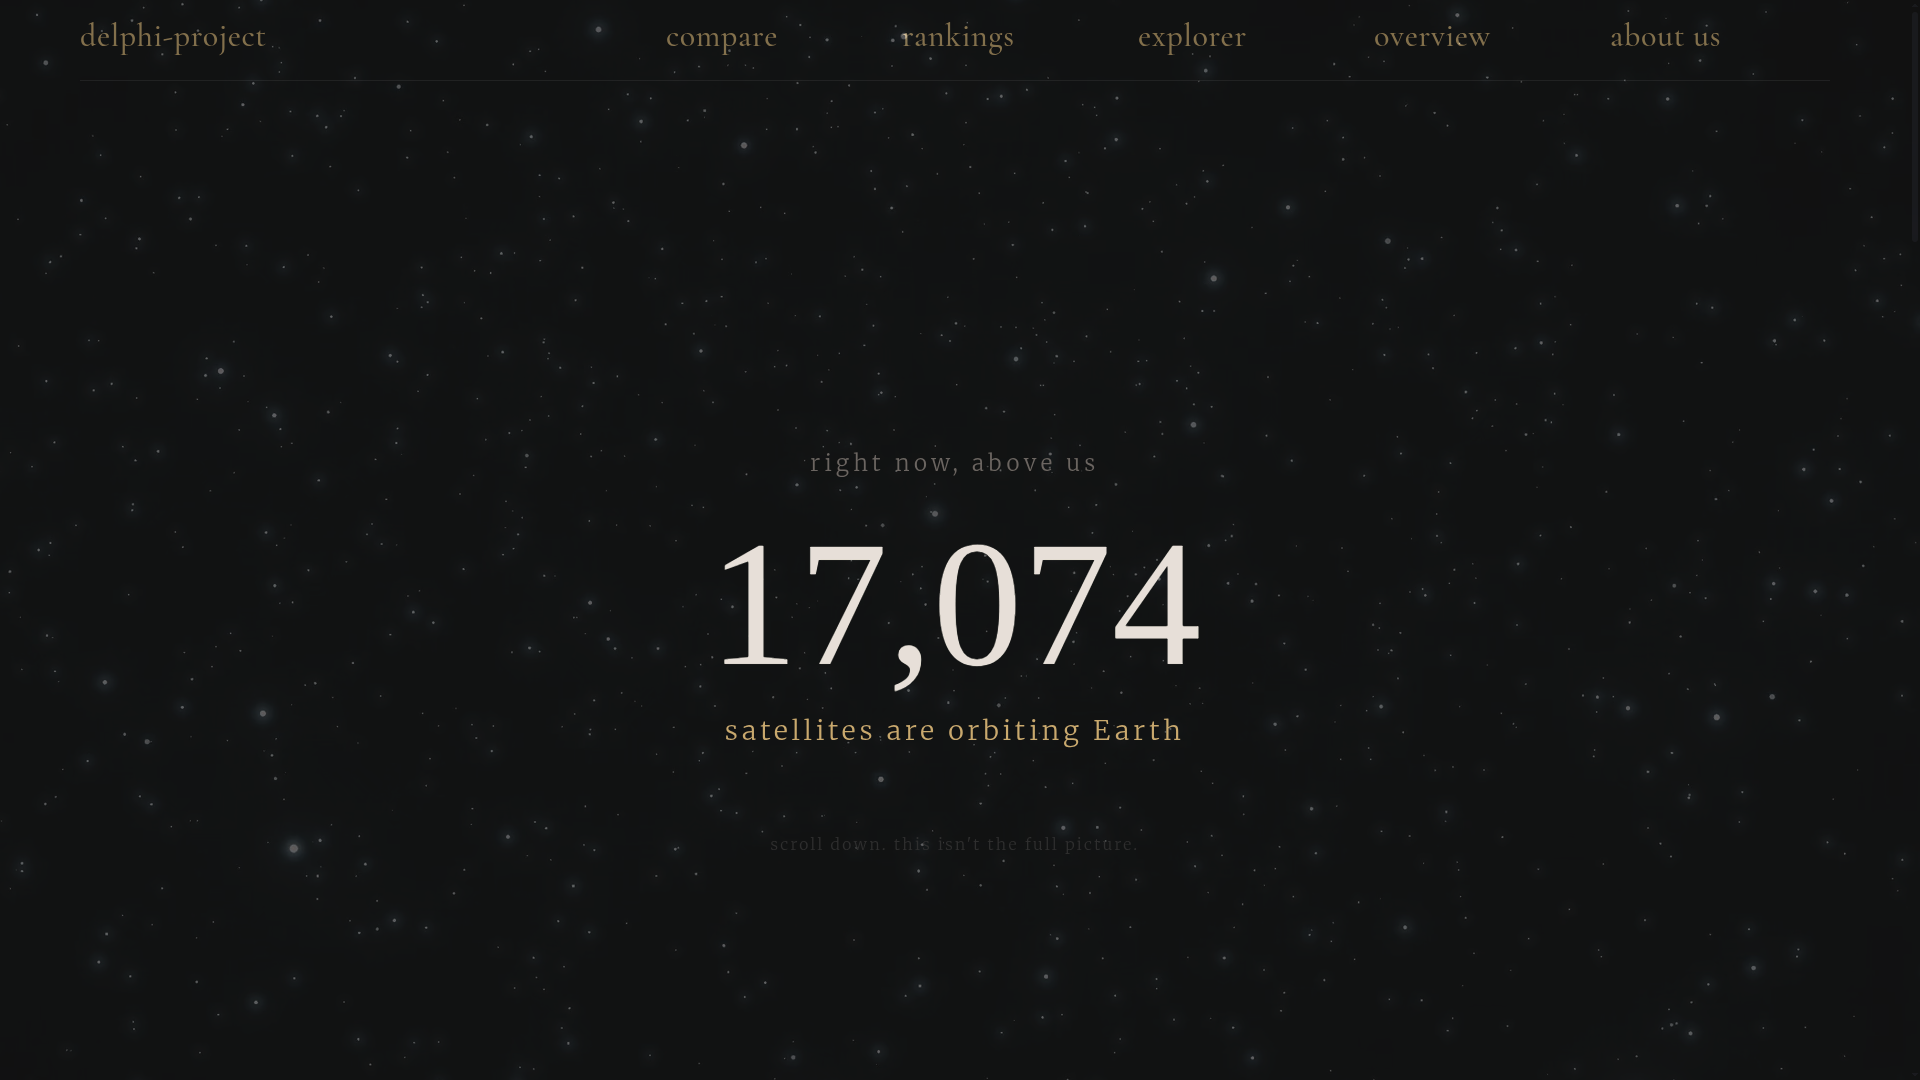
Home Screen
-
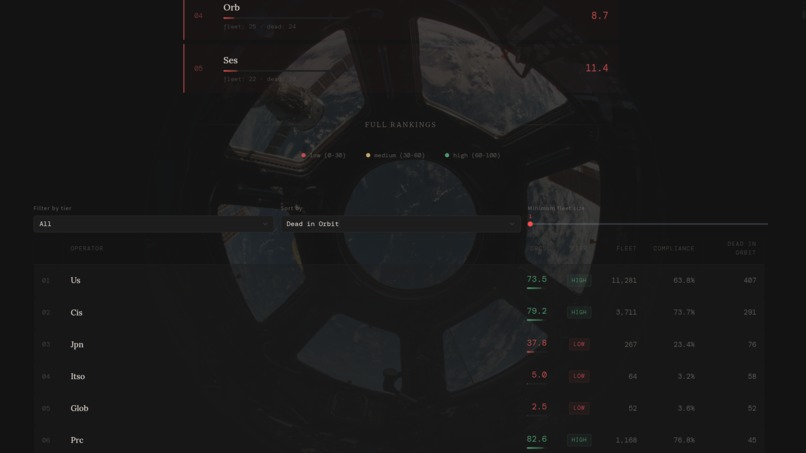
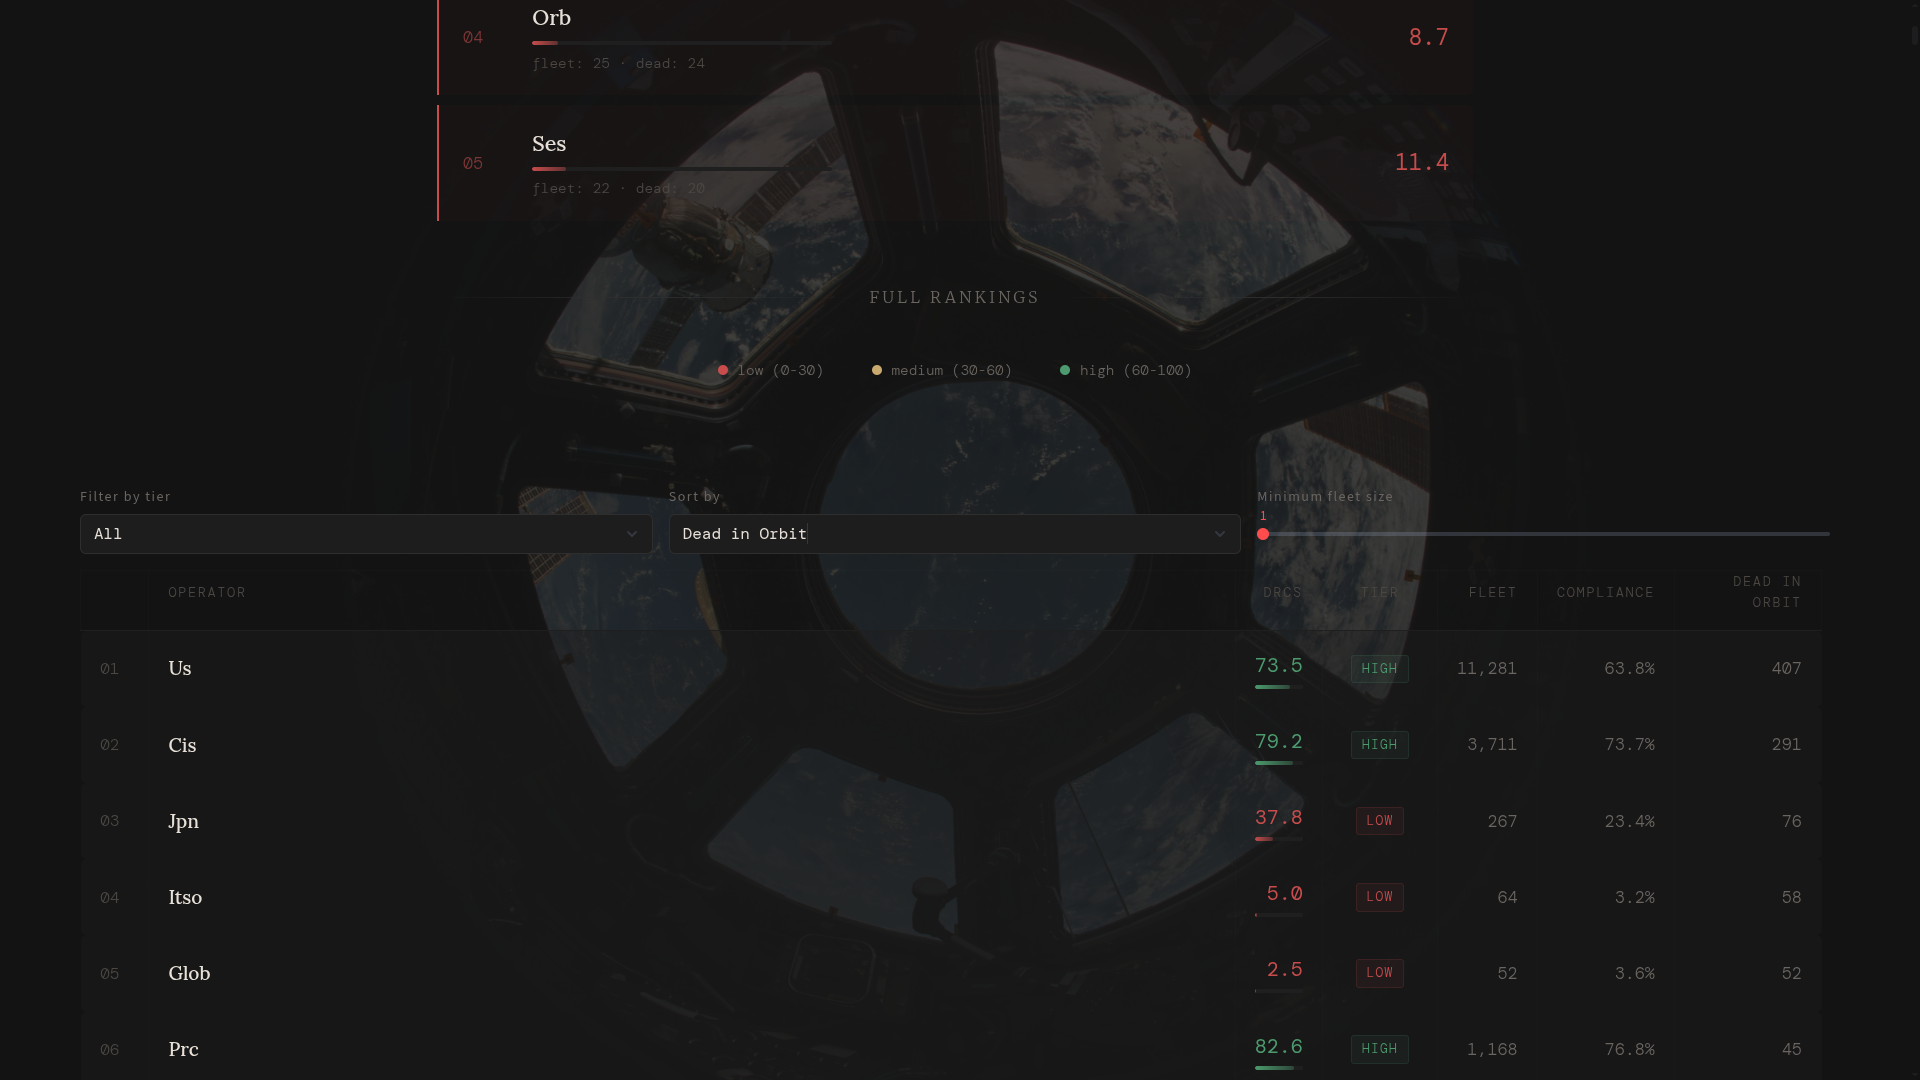
operator reliability screen
-
overview (displays satellite reliability, calculated by ml)
-
more overview w/ data
-

cool looking overview
-
more overview with data


Inspiration
Space is getting crowded, and getting crowded fast. There are 17,000+ manmade objects in orbit today, with thousands more launched every year. One collision can cause a chain reaction, producing debris that makes entire orbital bands unusable. This threatens vital satellite services such as navigation.
This isn't an engineering or tracking problem. We already have the tools to dispose of and track unnecessary satellites. The problem lies with regulation and compliance. Bodies such as the FCC can see what is in orbit, but lack the tools to assess whether satellites will be responsibly disposed of and whether operators will comply with the rules.
That's what led to Delphi, an "oracle" for the satellite industry that turns data into actionable intelligence.
What It Does
Delphi predicts which satellites are likely to comply with the FCC's 5-year deorbit rule and visualises risk across the ENTIRE satellite population. Instead of answering "What objects are in space?", Delphi answers:
- Which satellites are most likely to become long-term debris risks?
- Which operators are complying?
- What does the risk landscape look like right now?
App Features
- Compliance probability score per active satellite
- Operator reliability score
- Risk visualisation on a 3D globe model
- Hosted on Google Cloud VM with ngrok for public accessibility
How We Built It
We combined data from Space-Track, the UCS Satellite Database, and CelesTrak into one dataset of ~25,000 satellites, split into 17,000 active and 8,000 historical. We also created an enriched master database of ~8,000 satellites using the best available data. Using the FCC 5-year deorbit rule, we manually labeled historical satellites as compliant or non-compliant and trained a logistic regression model using features like altitude, orbital period, inclination, satellite age, and an operator reliability score (based on past compliance, smoothed for small operators). The model achieved 79% accuracy and 0.83 AUC. We then built a Streamlit dashboard and a CesiumJS 3D globe to visualise every active satellite, color-coded by risk and clickable for details.
Challenges We Ran Into
We spent a long time settling on the idea, wanting something unique that motivated the whole team.
- Data reconciliation: Different databases disagree on naming, operators, and fields. Duplicates were handled with fuzzy logic (e.g., "SpaceX Corporation™" and "SpaceX" are the same entity).
- Defining compliance: Translating a regulatory rule into usable labels for historical satellites took considerable time.
- Operator skew: Operators with few satellites skew reliability metrics, so we applied smoothing.
- Scaling visualisation: Rendering ~17,000 satellites in 3D required performance-conscious design and precomputation.
Accomplishments We're Proud Of
- Built a unified and enriched dataset compiled from multiple sources.
- Created a novel operator reliability score useful for regulators determining who to sanction.
- Built an accurate, explainable predictive model using maths accessible to us as second-year students.
- Scored EVERY SINGLE satellite currently in orbit (as of 2023).
- Shipped a 3D globe that visualises the risk.
What We Learned
- How to operate as a team. First hackathon for half the team, second for the other half.
- Space sustainability is as much a regulatory issue as an engineering one.
- How to train logistic models from scratch.
- Multiple front-end frameworks on the fly.
- How to coordinate workflows.
What's Next for Delphi
The model could be more sophisticated. Gradient boosting, neural networks, and transformers may yield better results. We lacked the background to implement those, but our logistic regression still performs well (0.83 AUC), and we estimate a more advanced model could reach 0.99.
The model uses historical data up to 2023. Live data would make it more powerful, but much of it is classified due to military operators.
We also want to expand features with richer mission context (propulsion capability, end-of-life plans, mission type, disposal history). The dashboard and globe could be made more interactive with filtering, operator comparisons, and automated reporting so regulators can generate risk summaries in a few clicks.
Built With
- cesium
- fastapi
- python
- scikit-learn
- streamlit
- thefuzz


Log in or sign up for Devpost to join the conversation.