-
-
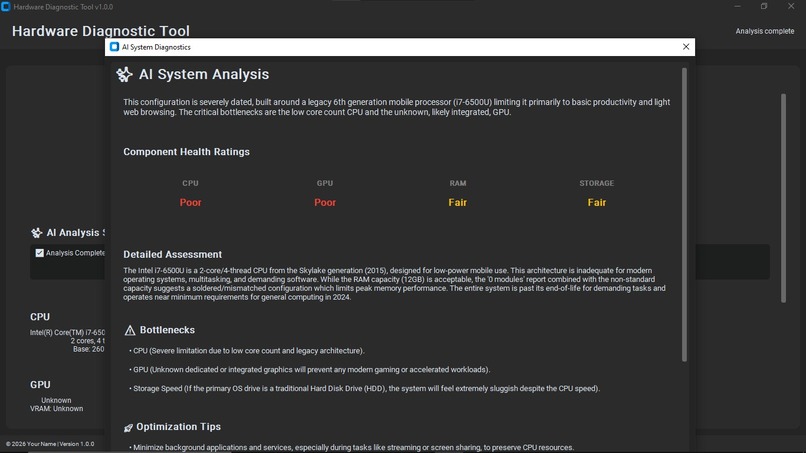
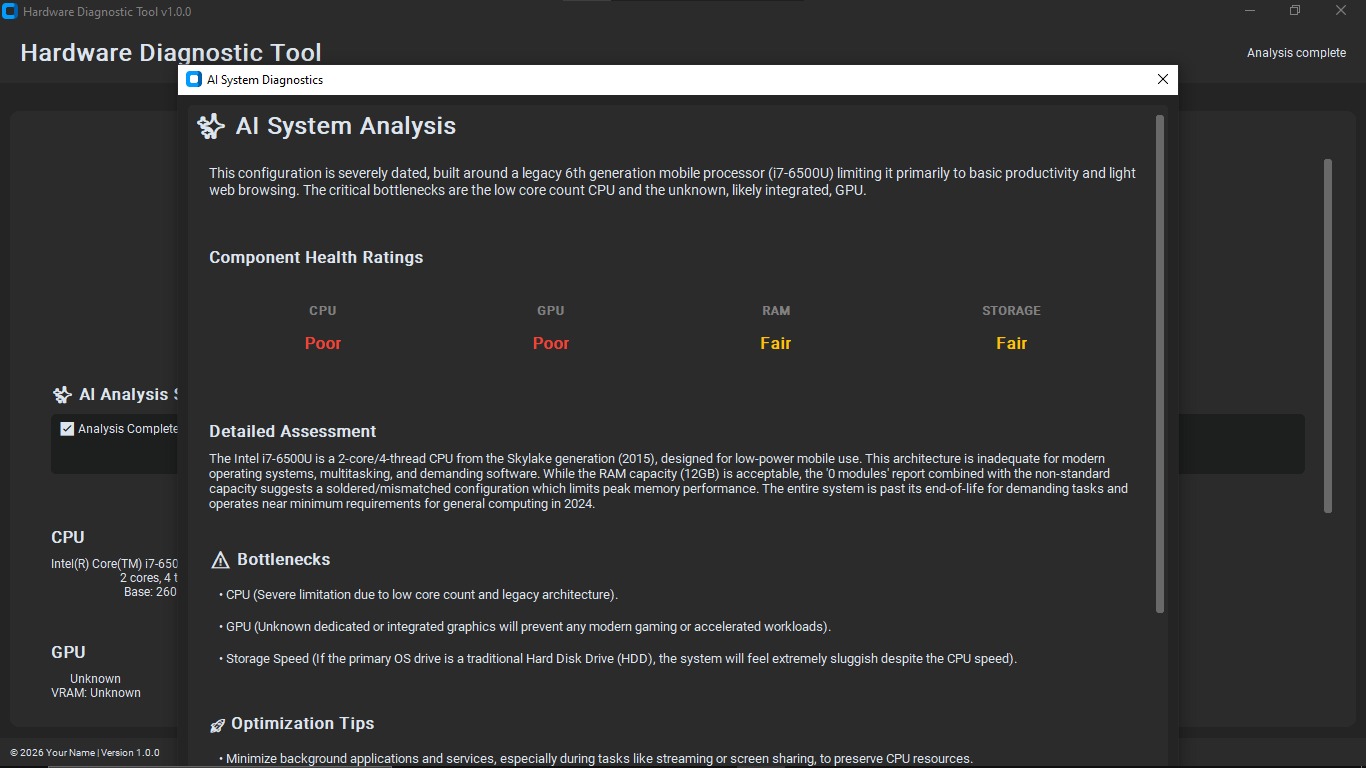
gemini result
Inspiration
Modern computers are powerful, but most people have no idea what’s really happening “under the hood.” We only notice our PC’s health when something goes wrong: overheating, random shutdowns, lag, or hardware failures. During the Gemini 3 Hackathon, I wanted to build something that gives users a clear, friendly window into their machine’s inner health without needing to be an expert.
That’s how Dekcheck was born – an all‑in‑one desktop health checker that combines low‑level diagnostics, sensor data, and open‑source tooling into a single, simple experience.
What it does
Dekcheck is your PC’s health center in one app. It focuses on three main things:
Inner CPU & system checks (via Gemmini APIs)
- Reads and visualizes CPU usage, temperature, and load.
- Surfaces potential issues like overheating, throttling, or abnormal spikes.
- Gives a clear “health status” so users know when everything is OK and when to pay attention.
- Reads and visualizes CPU usage, temperature, and load.
Nova tools integration (open‑source)
- Uses Nova‑style open‑source utilities to analyze performance patterns.
- Helps identify which processes or configurations might be impacting stability or speed.
- Presents results in a human‑readable way instead of raw logs.
- Uses Nova‑style open‑source utilities to analyze performance patterns.
Diagnostic sensor suite (open‑source)
- Collects data from available system sensors (CPU, GPU, fans, thermal sensors, etc.).
- Shows live and historical graphs so users can see trends over time.
- Highlights unusual readings that might indicate upcoming hardware problems.
- Collects data from available system sensors (CPU, GPU, fans, thermal sensors, etc.).
All of this is packaged into one dashboard, so users don’t have to jump between multiple tools to understand the health of their desktop or personal computer.
How we built it
Dekcheck is built as a layered system:
Core diagnostics layer
- Integrates Gemmini APIs (and other low‑level interfaces where available) to query CPU and system‑level metrics.
- Normalizes readings so different platforms can be compared using a common health model.
- Integrates Gemmini APIs (and other low‑level interfaces where available) to query CPU and system‑level metrics.
Open‑source tooling layer (Nova + diagnostic sensors)
- Hooks into Nova‑style open‑source utilities to profile performance and generate structured diagnostic data.
- Uses open‑source sensor libraries to read temperatures, fan speeds, and other hardware telemetry.
- Hooks into Nova‑style open‑source utilities to profile performance and generate structured diagnostic data.
Application / UI layer
- A desktop front‑end that aggregates all metrics into a single health dashboard.
- Visual components for:
- CPU usage & temperature
- System load and performance indicators
- Sensor readouts and alerts
- Simple color‑coded statuses (e.g., green = healthy, yellow = watch, red = critical) to make the data understandable for non‑technical users.
- A desktop front‑end that aggregates all metrics into a single health dashboard.
Depending on the platform, the stack includes:
- A system‑level backend to talk to APIs and sensors.
- A UI layer to present the data in real time.
- Config files and thresholds to define what “healthy” means for different components.
Challenges we ran into
Accessing low‑level metrics safely
Getting reliable CPU and sensor data without requiring too many permissions or breaking on different systems was tricky. We had to experiment with different APIs and fallbacks and handle cases where some sensors simply aren’t exposed.Normalizing data across tools
Gemmini readings, Nova outputs, and sensor libraries all expose data in slightly different formats. Designing a common schema so Dekcheck could treat them consistently required careful planning.Making complex diagnostics user‑friendly
Raw sensor numbers don’t mean much to regular users. Turning those into meaningful messages (e.g., “Your CPU is running hotter than usual under light load”) and simple visual indicators took a lot of iteration.Time constraints
In a hackathon setting, there’s limited time to polish everything. We focused on building a solid end‑to��end flow: connect to the system, gather metrics, run diagnostics, and present them in a single screen.
Accomplishments that we’re proud of
- Built a working all‑in‑one PC health dashboard that unifies diagnostics, sensors, and performance checks.
- Successfully integrated Gemmini‑based CPU insights with open‑source Nova and sensor tools.
- Created a clean UI that can show a quick “overall health” summary while still letting curious users dive deeper into each metric.
- Designed the project to be extensible, so future contributors can plug in more tools or add support for more platforms.
What we learned
- How to work with system‑level diagnostics and hardware sensors while respecting platform constraints.
- How to combine multiple open‑source tools into a coherent experience rather than a collection of separate utilities.
- The importance of UX for technical data: even the best metrics aren’t helpful if users can’t quickly understand them.
- How to scope and ship a complete, end‑to‑end project within a tight hackathon deadline.
What’s next for Dekcheck
- Deeper platform support: expand compatibility and add smarter fallbacks for different operating systems and hardware.
- Configurable alerts: allow users to define thresholds and receive warnings when their PC’s health drifts outside normal ranges.
- Historical analysis: store trends over days or weeks to spot slow‑burn issues like fans degrading or thermal paste aging.
- Plugin ecosystem: let other developers add their own diagnostic modules so Dekcheck can grow with the community.
Dekcheck’s goal is simple:
Help everyday users understand and maintain the health of their desktop or personal computer, using the power of open‑source diagnostics in one place.
Built With
- diagnostic-sensor-libraries
- gemmini-api
- nova-(open?source-tools)
- open?source
- python
- tkinter


Log in or sign up for Devpost to join the conversation.