-
-
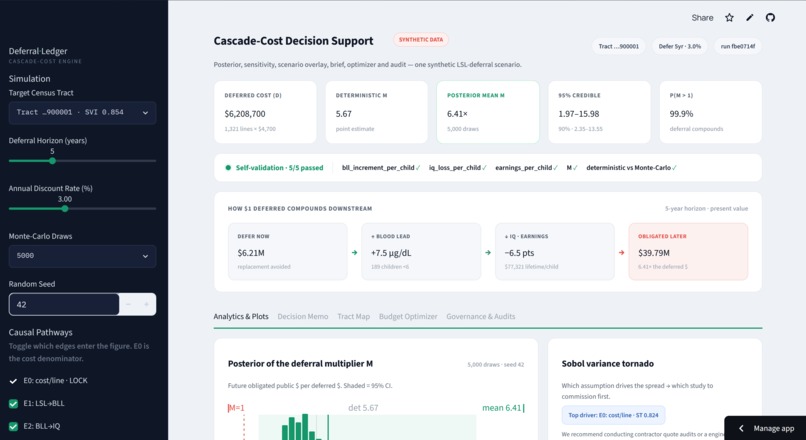
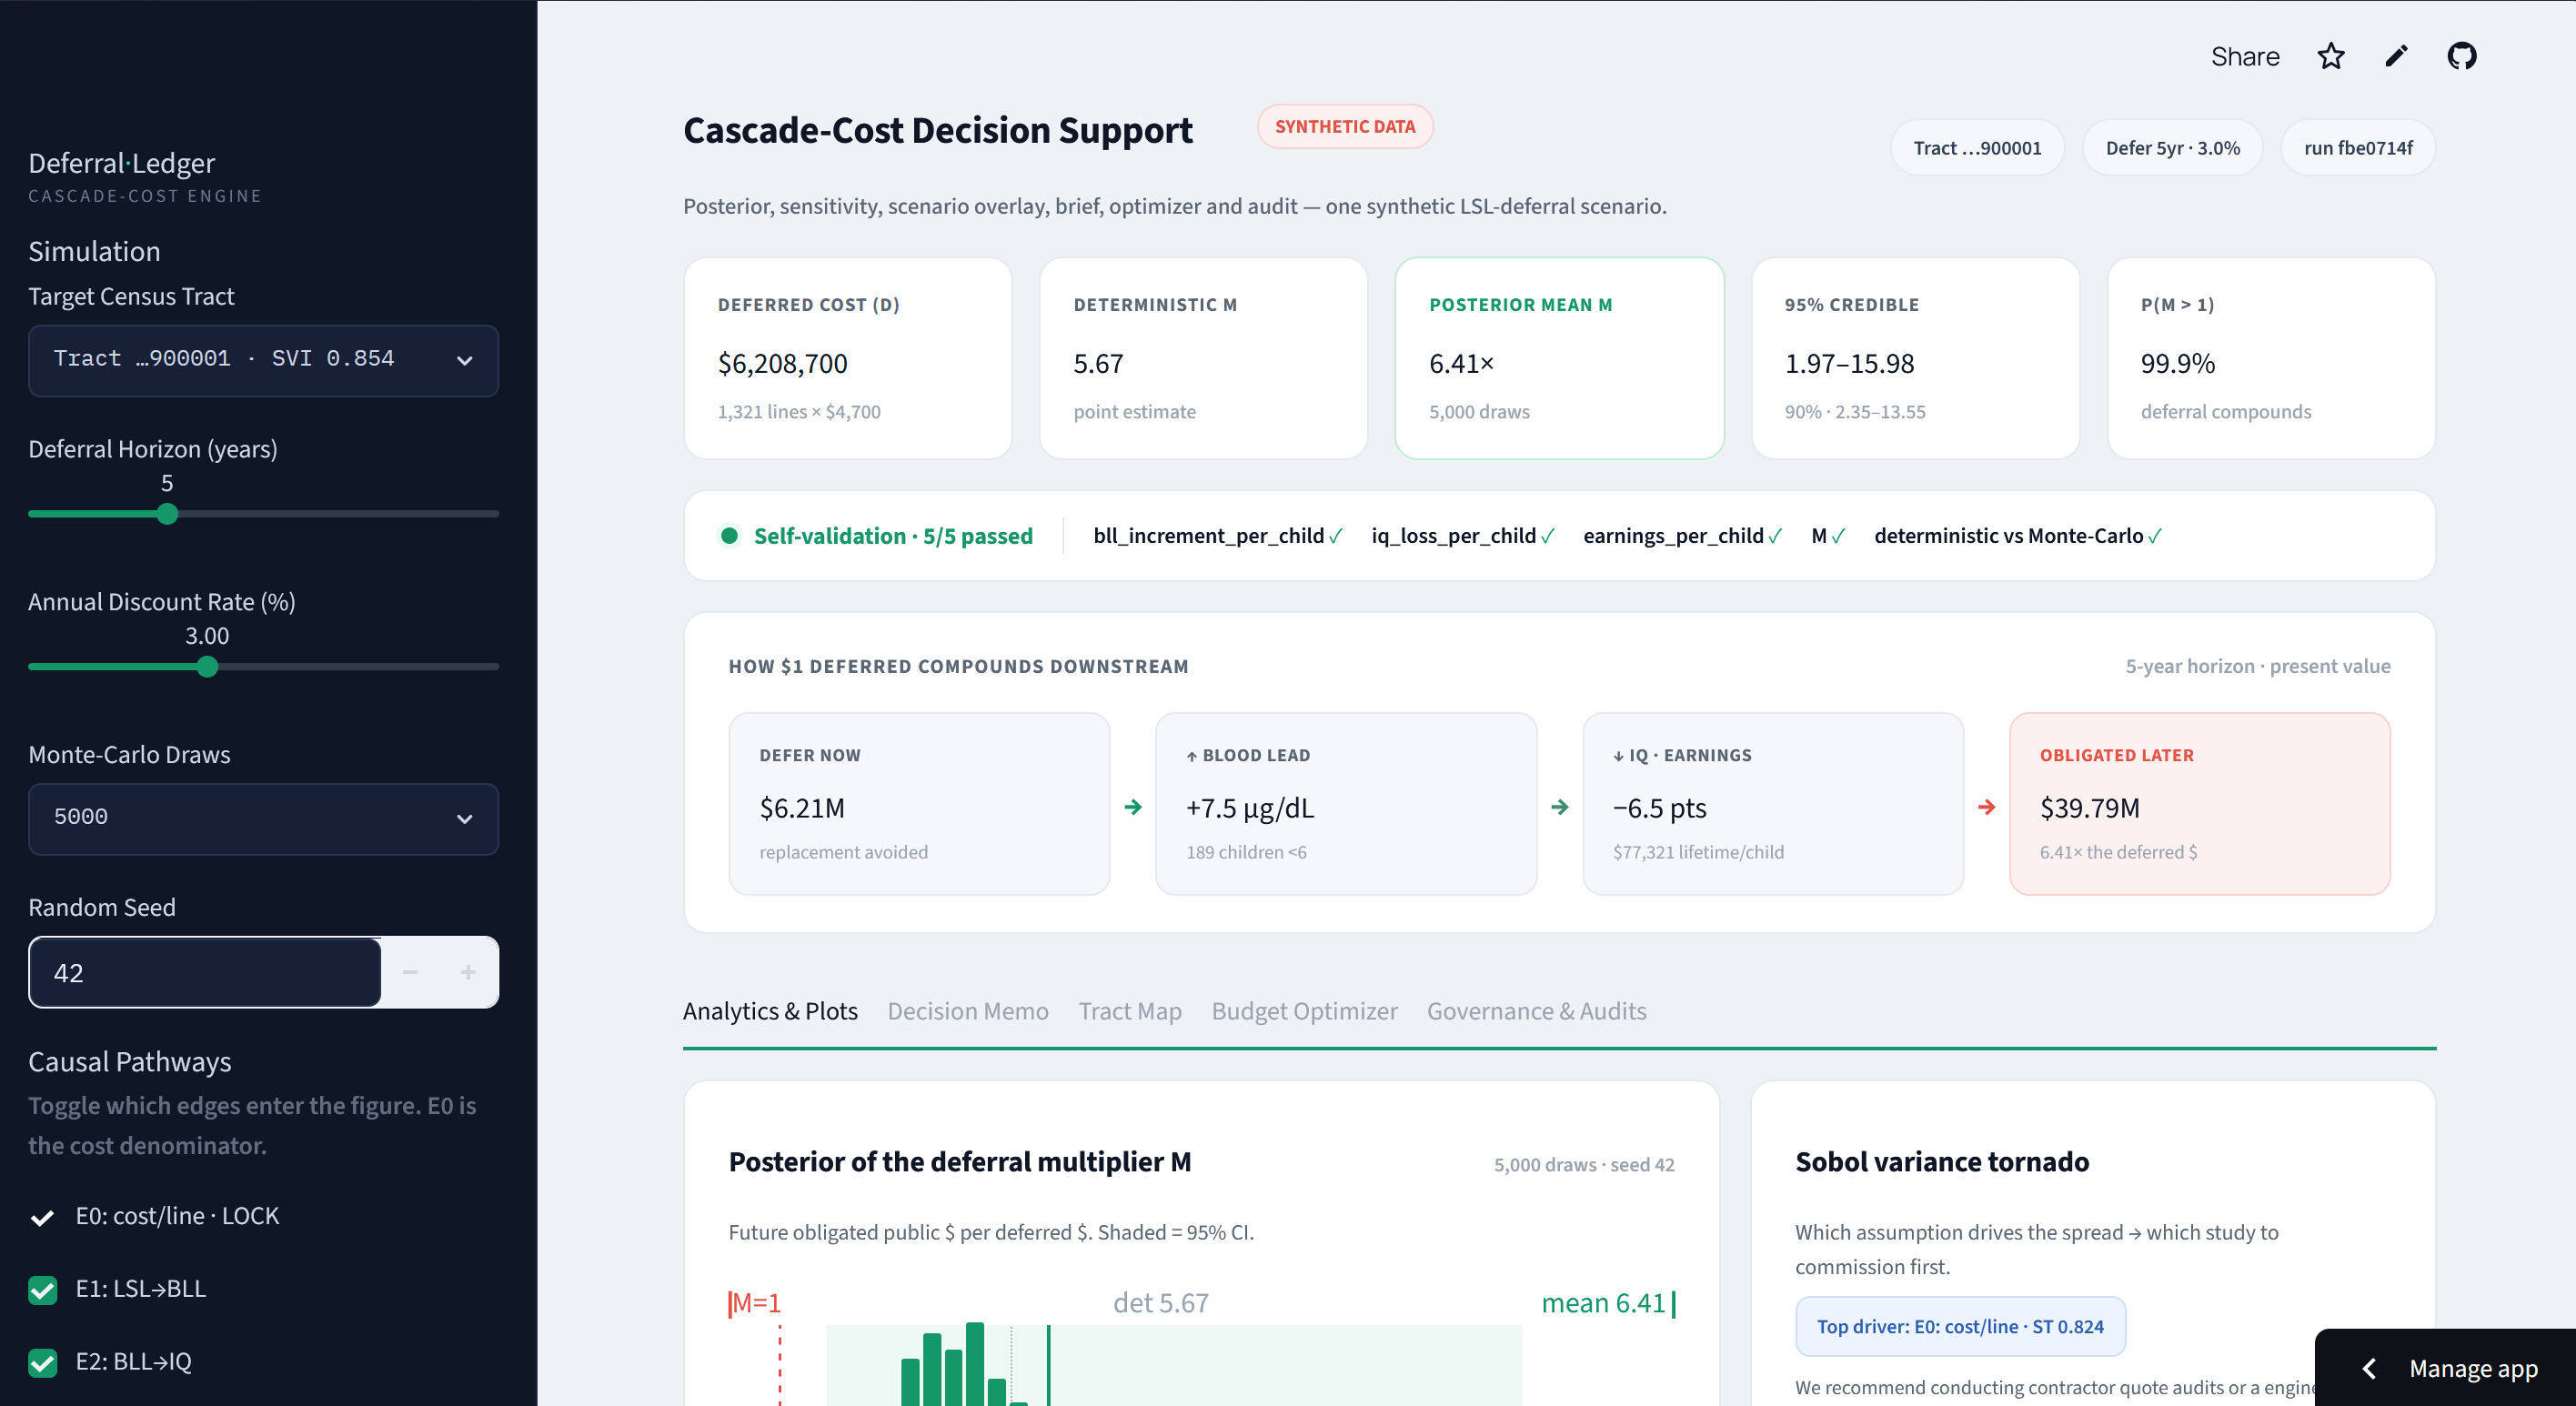
The headline isn't a number. Posterior mean 6.41x with a 95% interval, P(M>1), a self-validation pass, and how $1 deferred compounds.
-
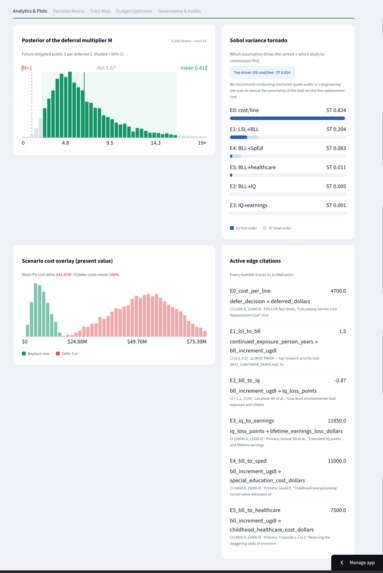
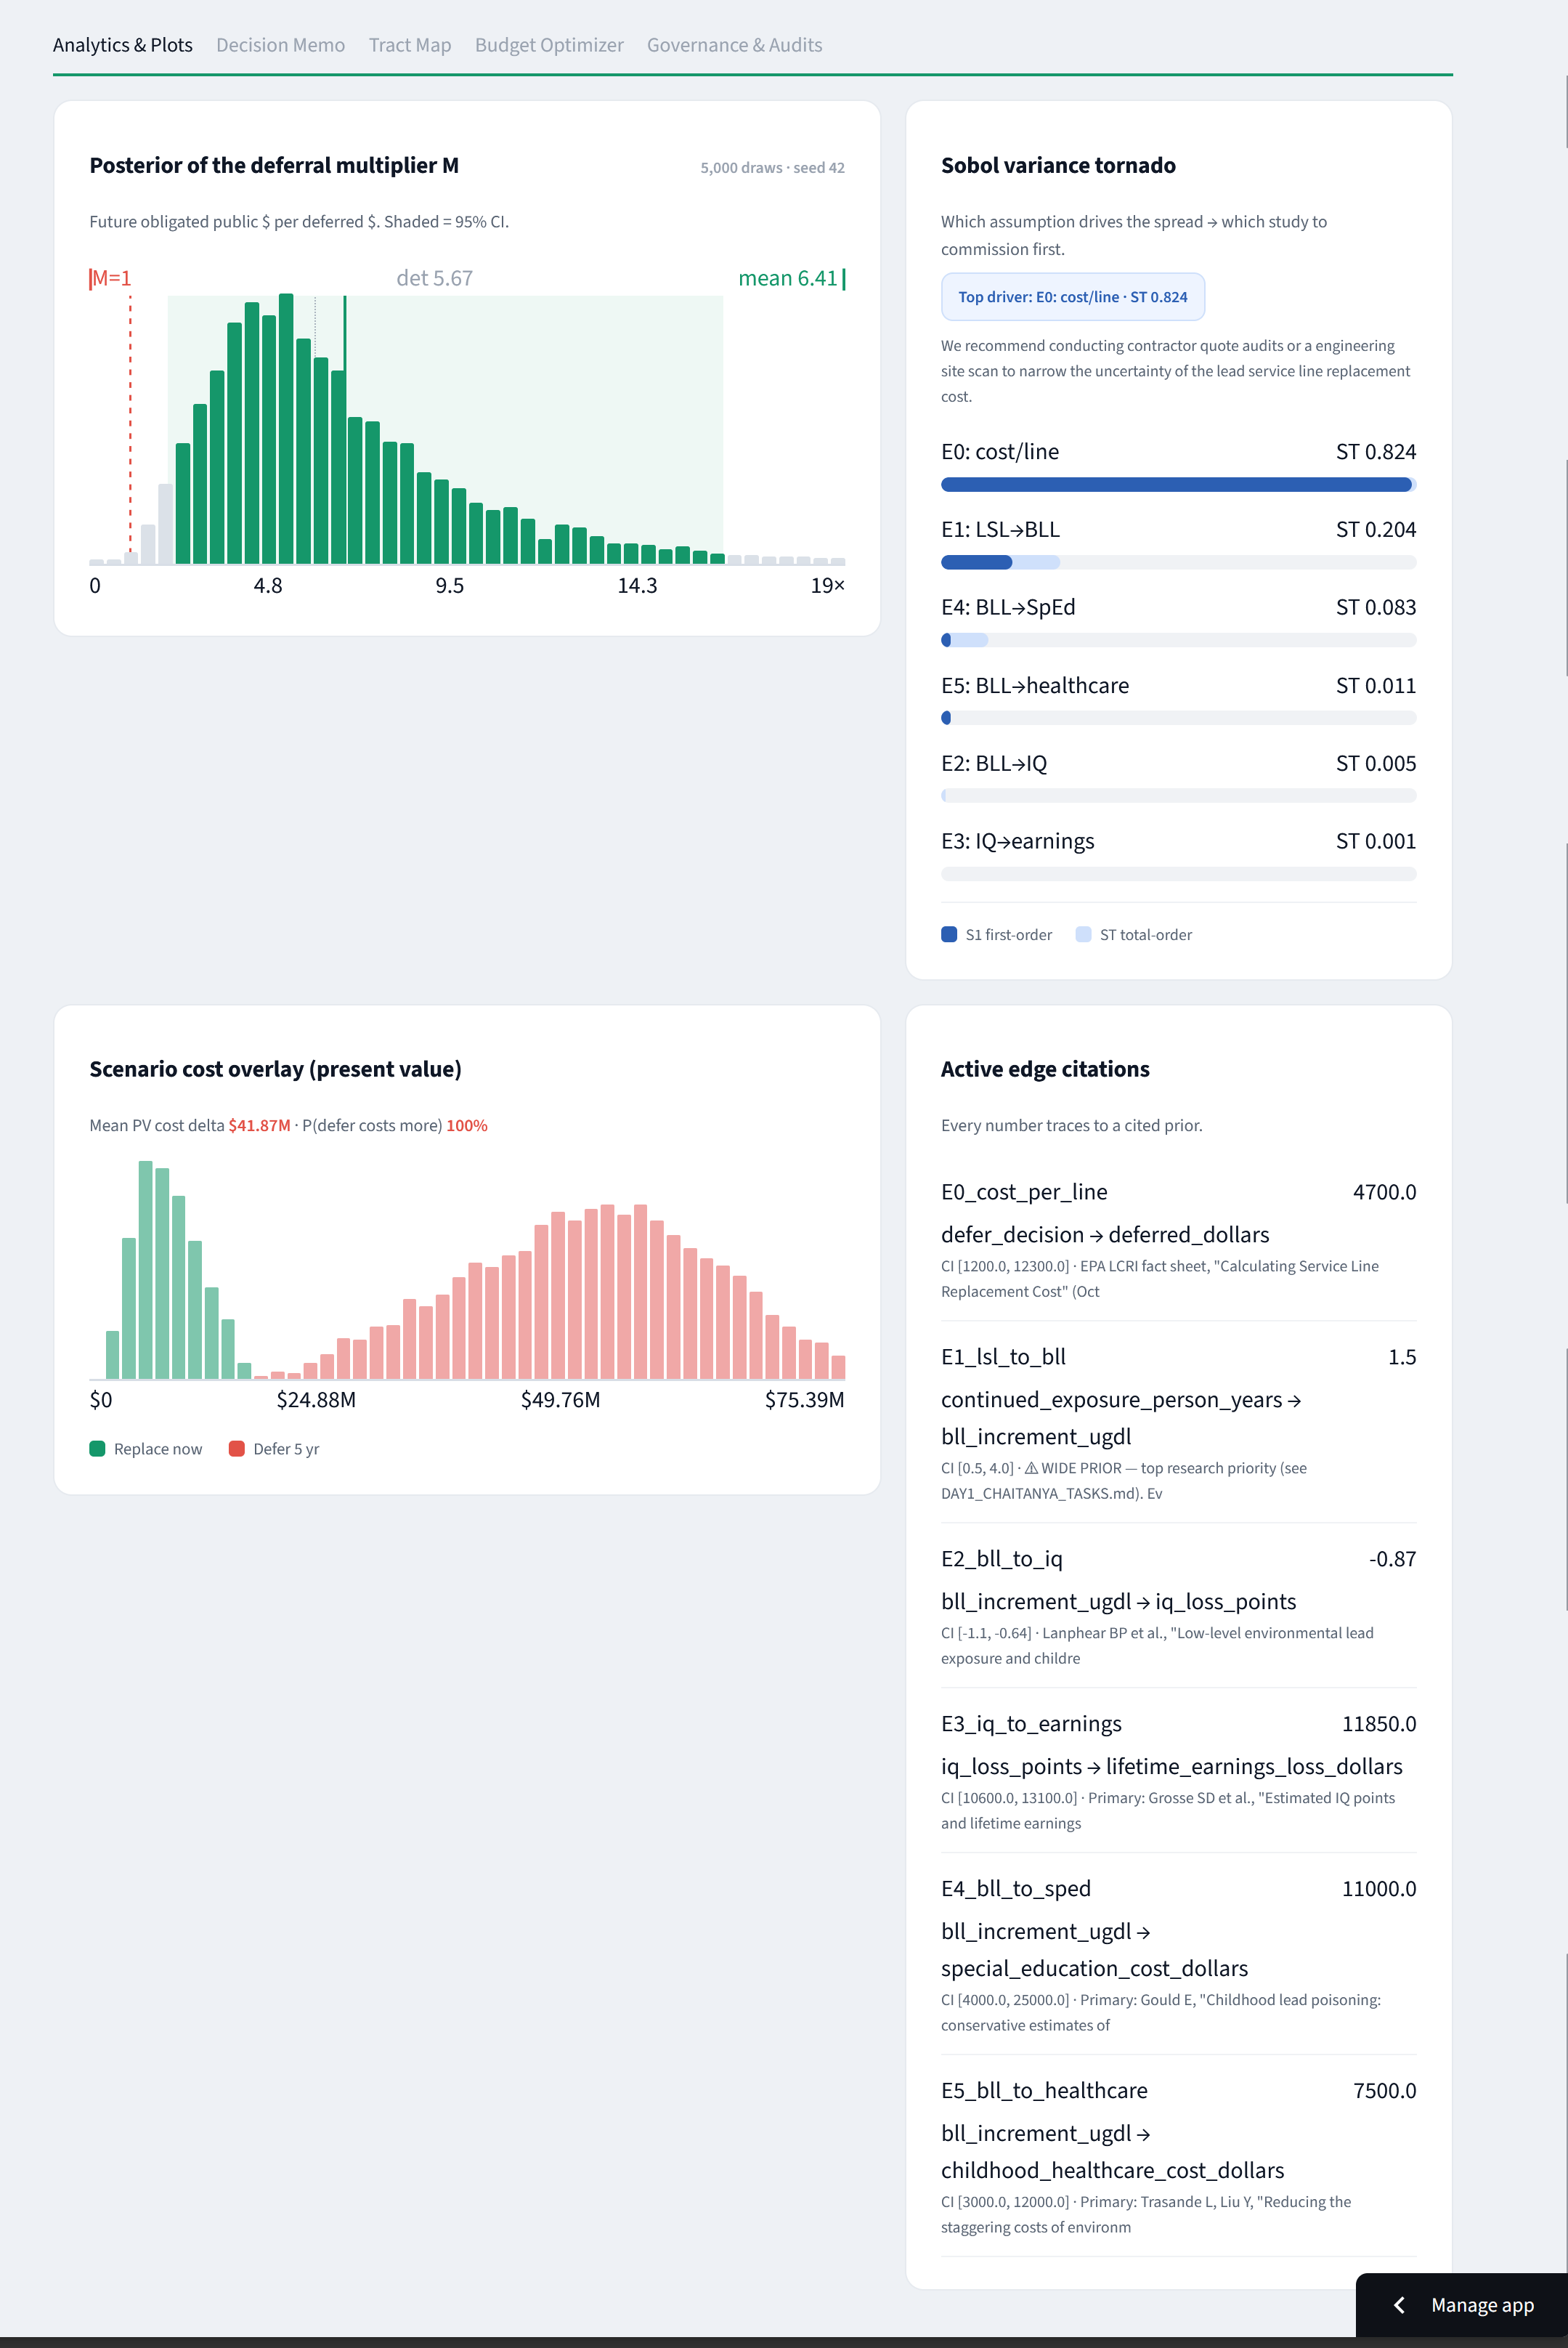
Analytics: full posterior, a Sobol tornado naming the top uncertainty to study first, a scenario overlay, and a citation for every number.
-
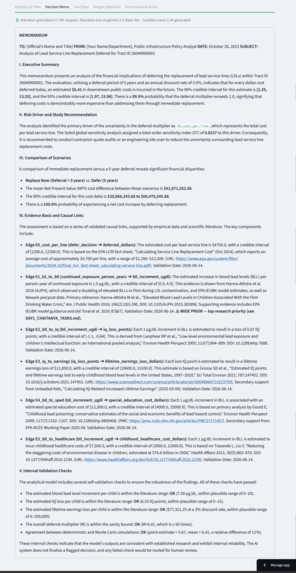
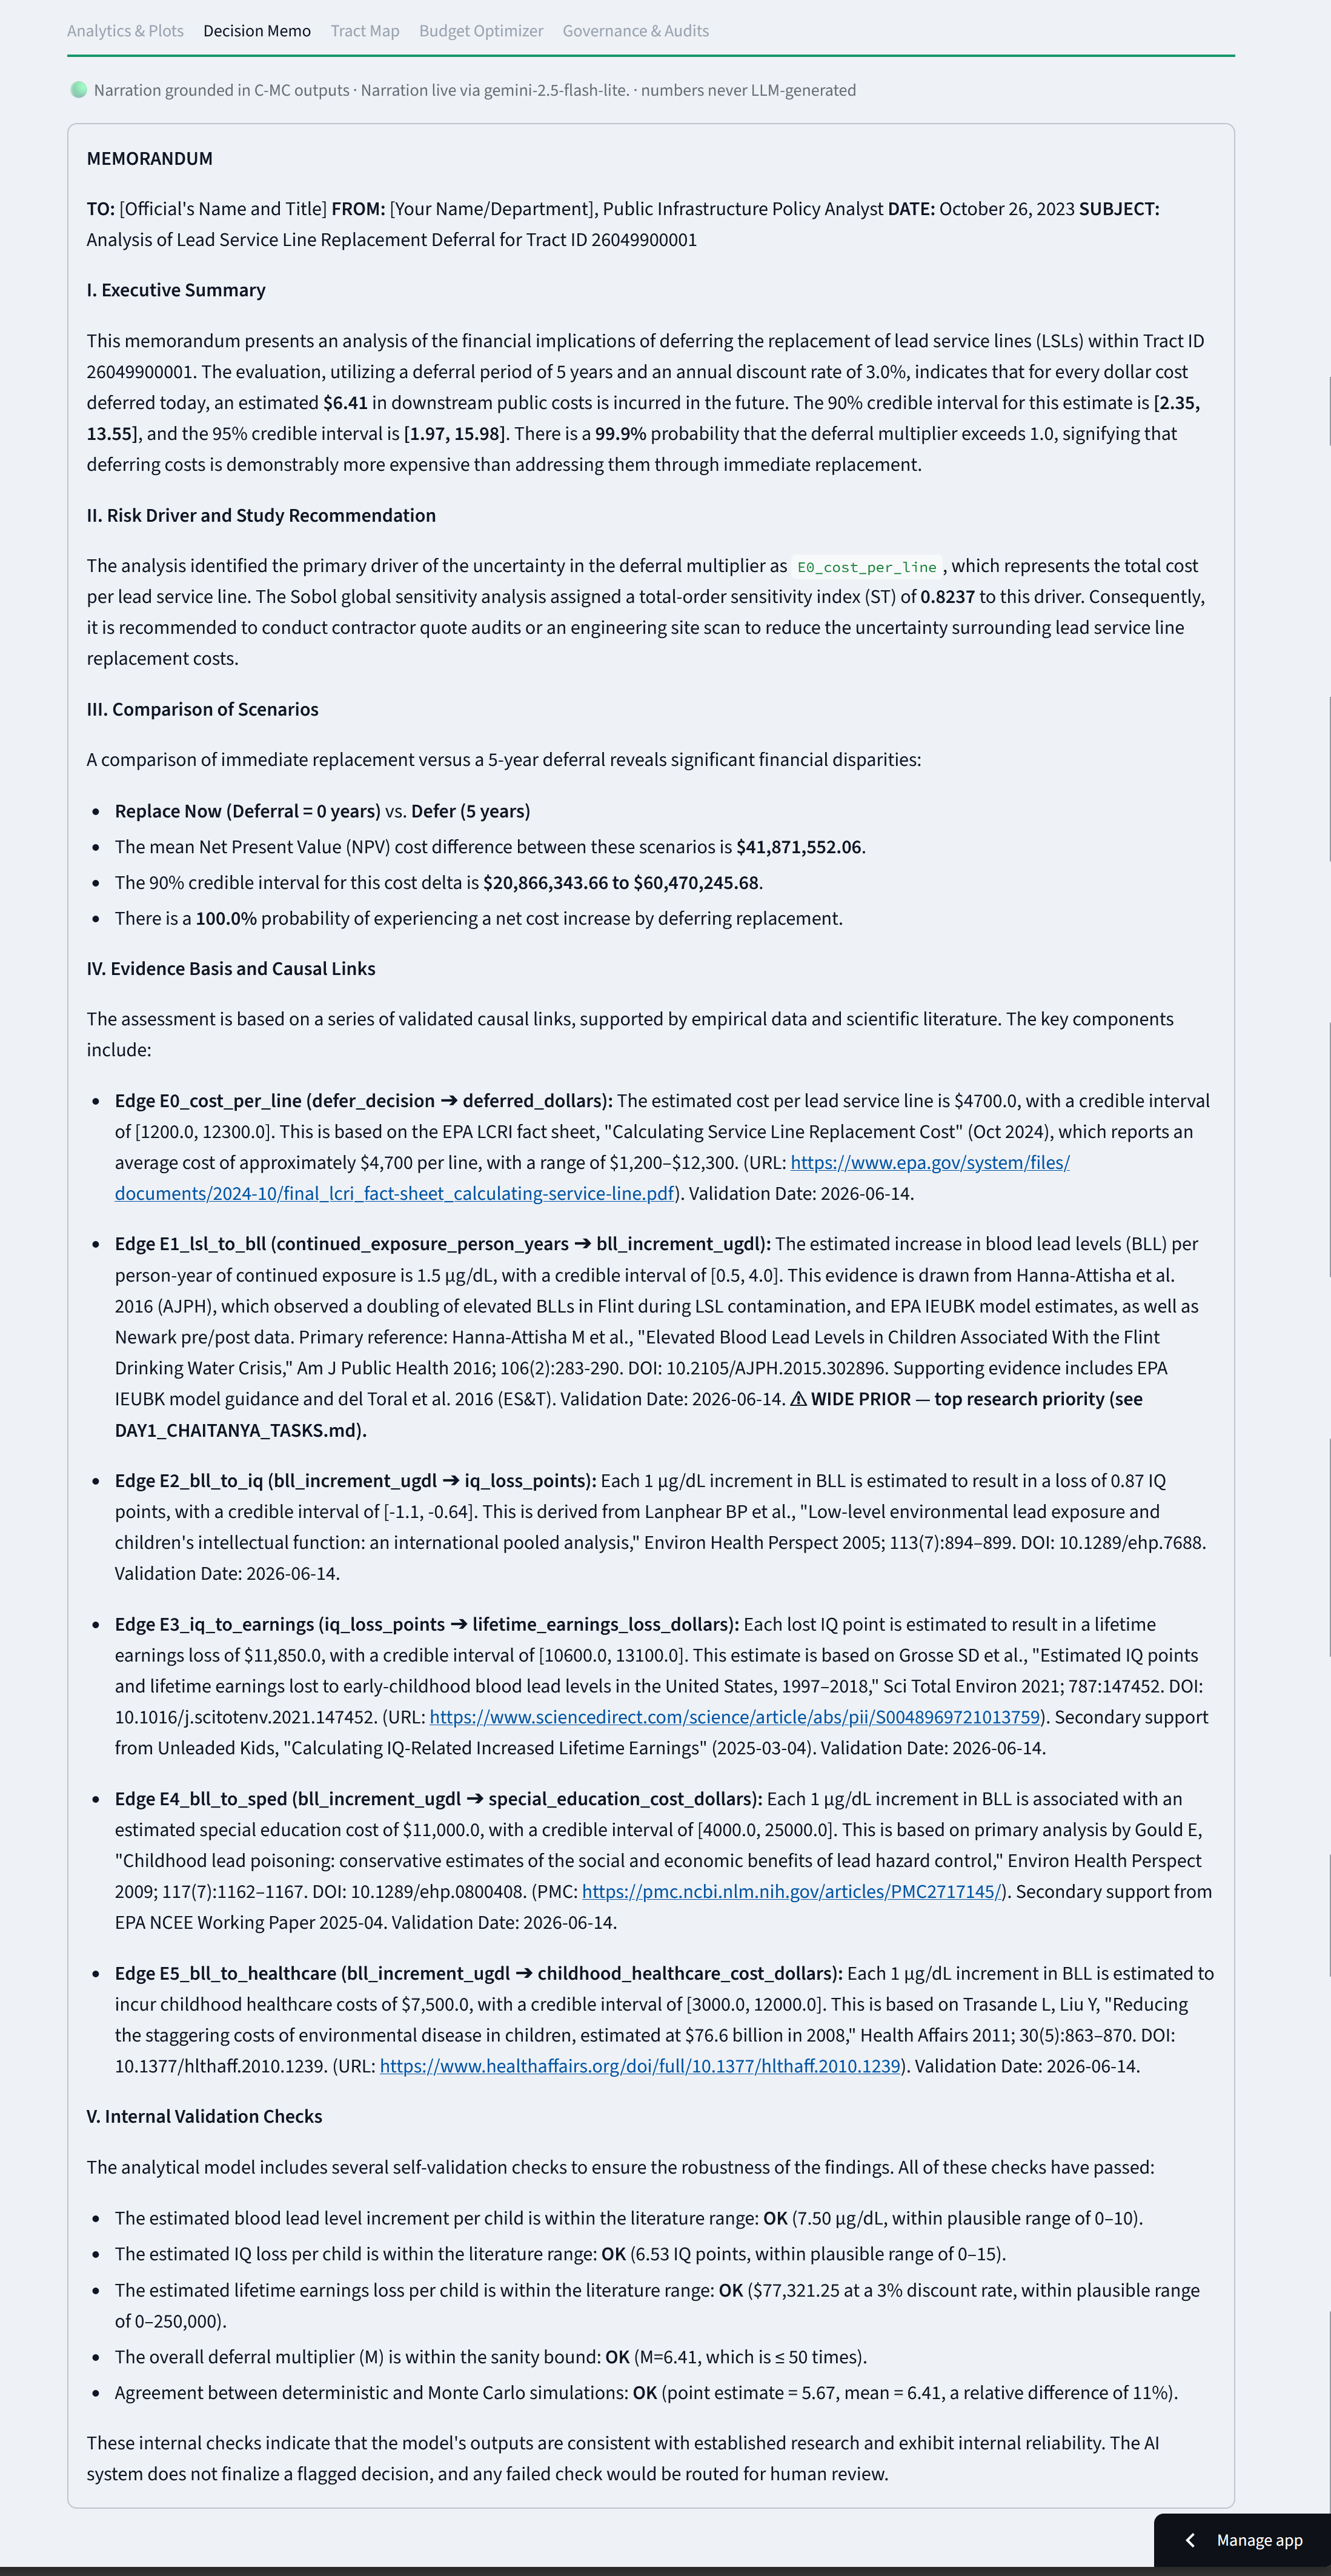
Decision Memo: a plain-language brief grounded in the model. Gemini phrases it, but every number and citation comes from the engine.
-
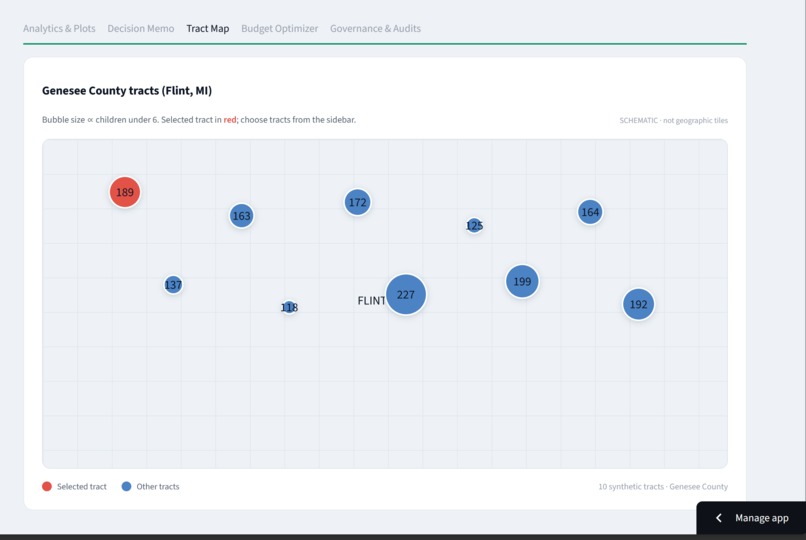
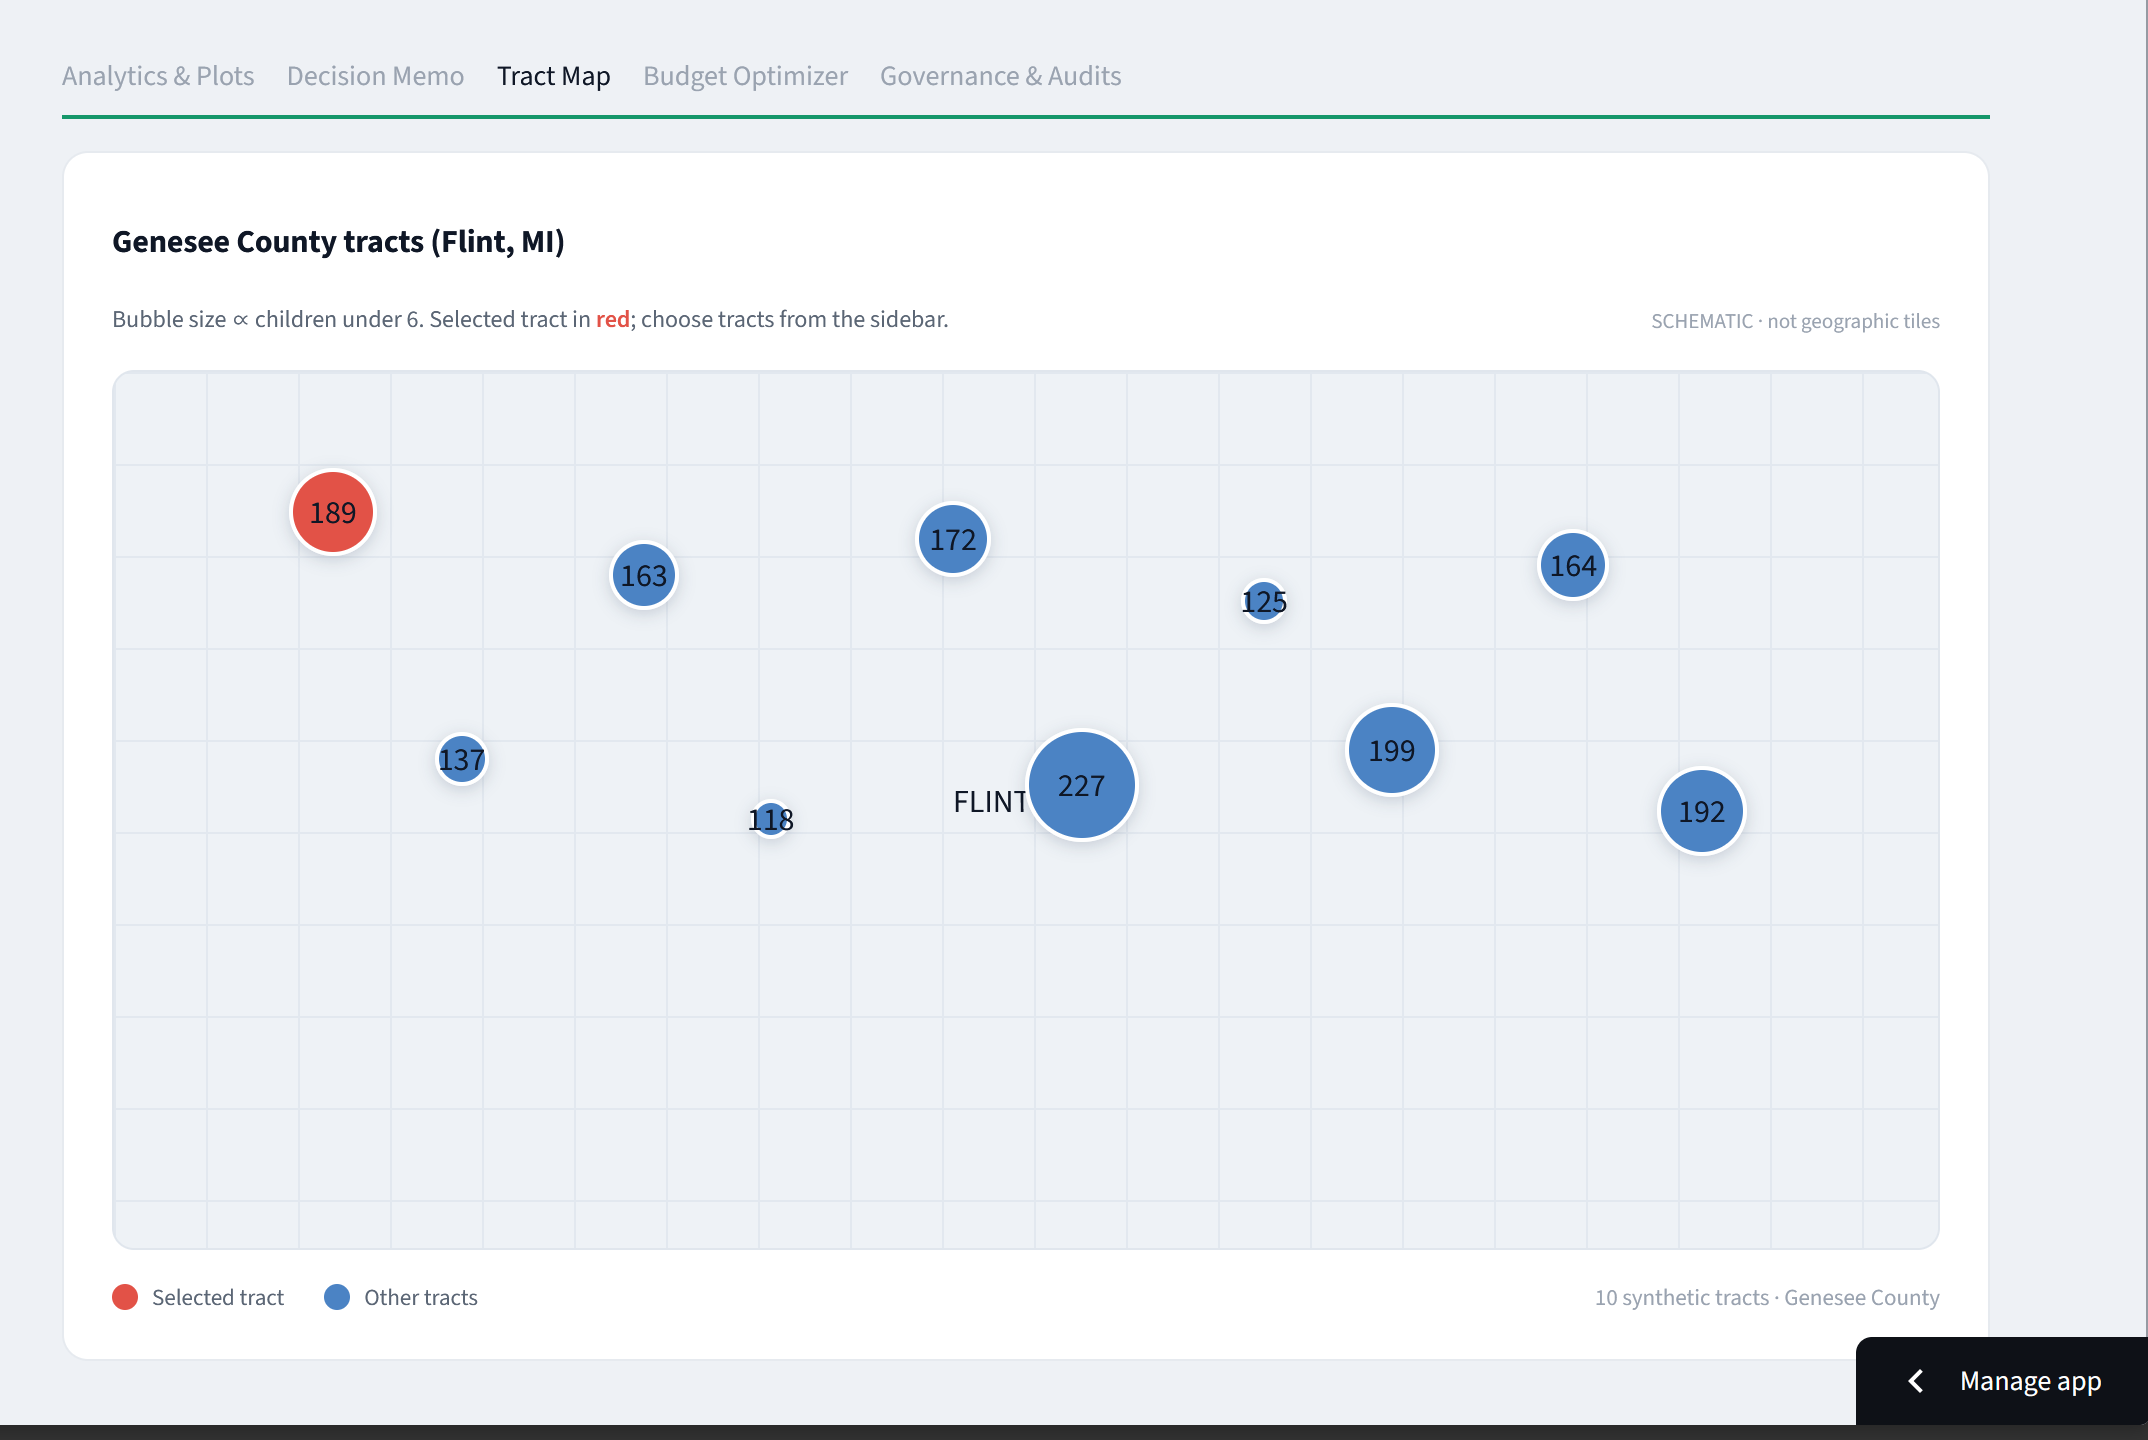
Genesee County tracts (Flint), sized by children under 6. Synthetic data, clearly labeled, with the selected tract in red.
-
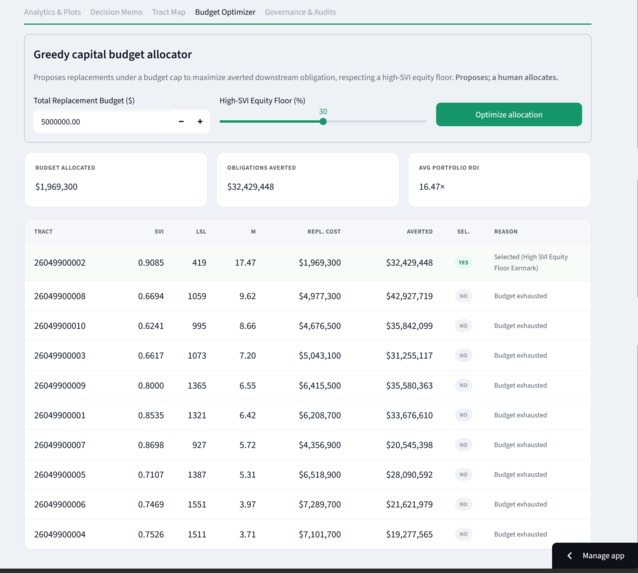
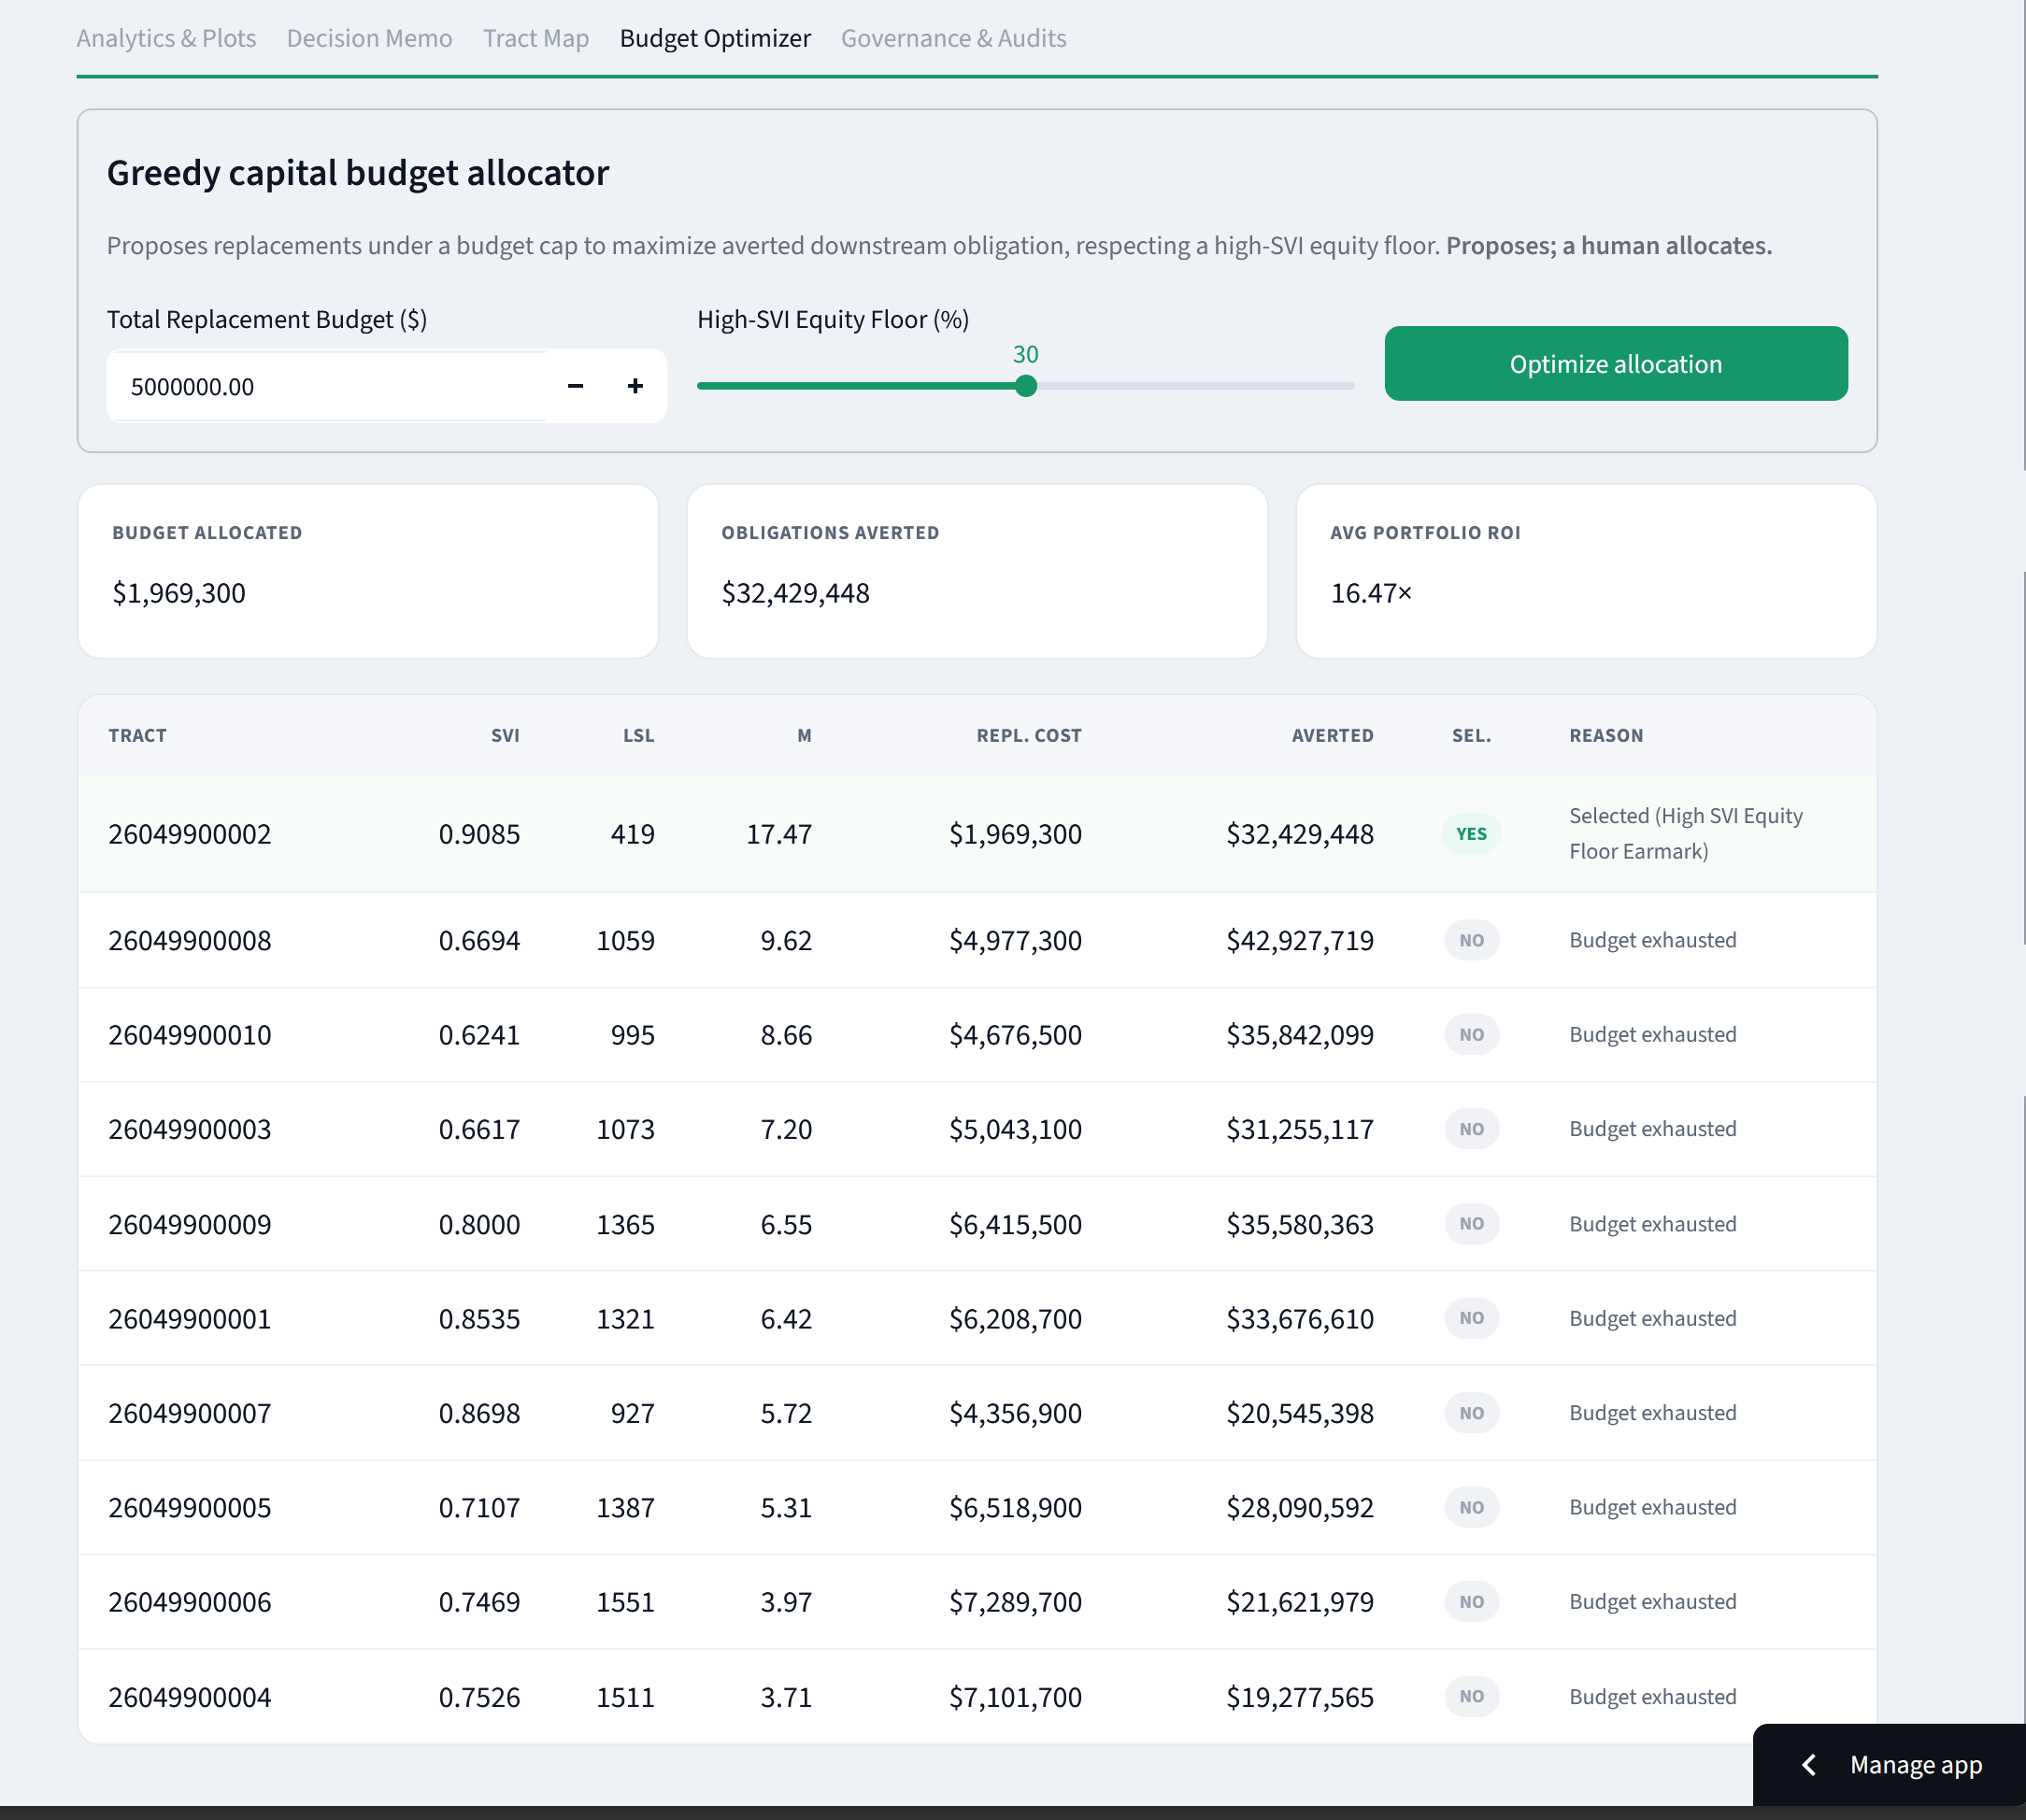
Budget Optimizer: proposes which tracts to replace under a budget cap with an equity floor. It proposes the allocation; a human decides.
-
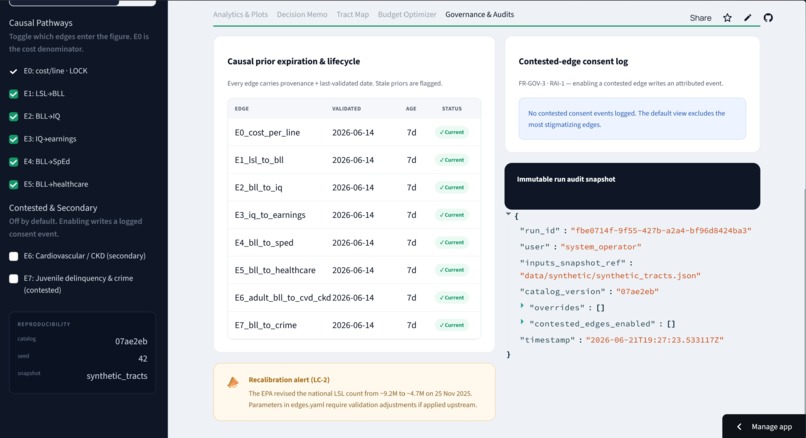
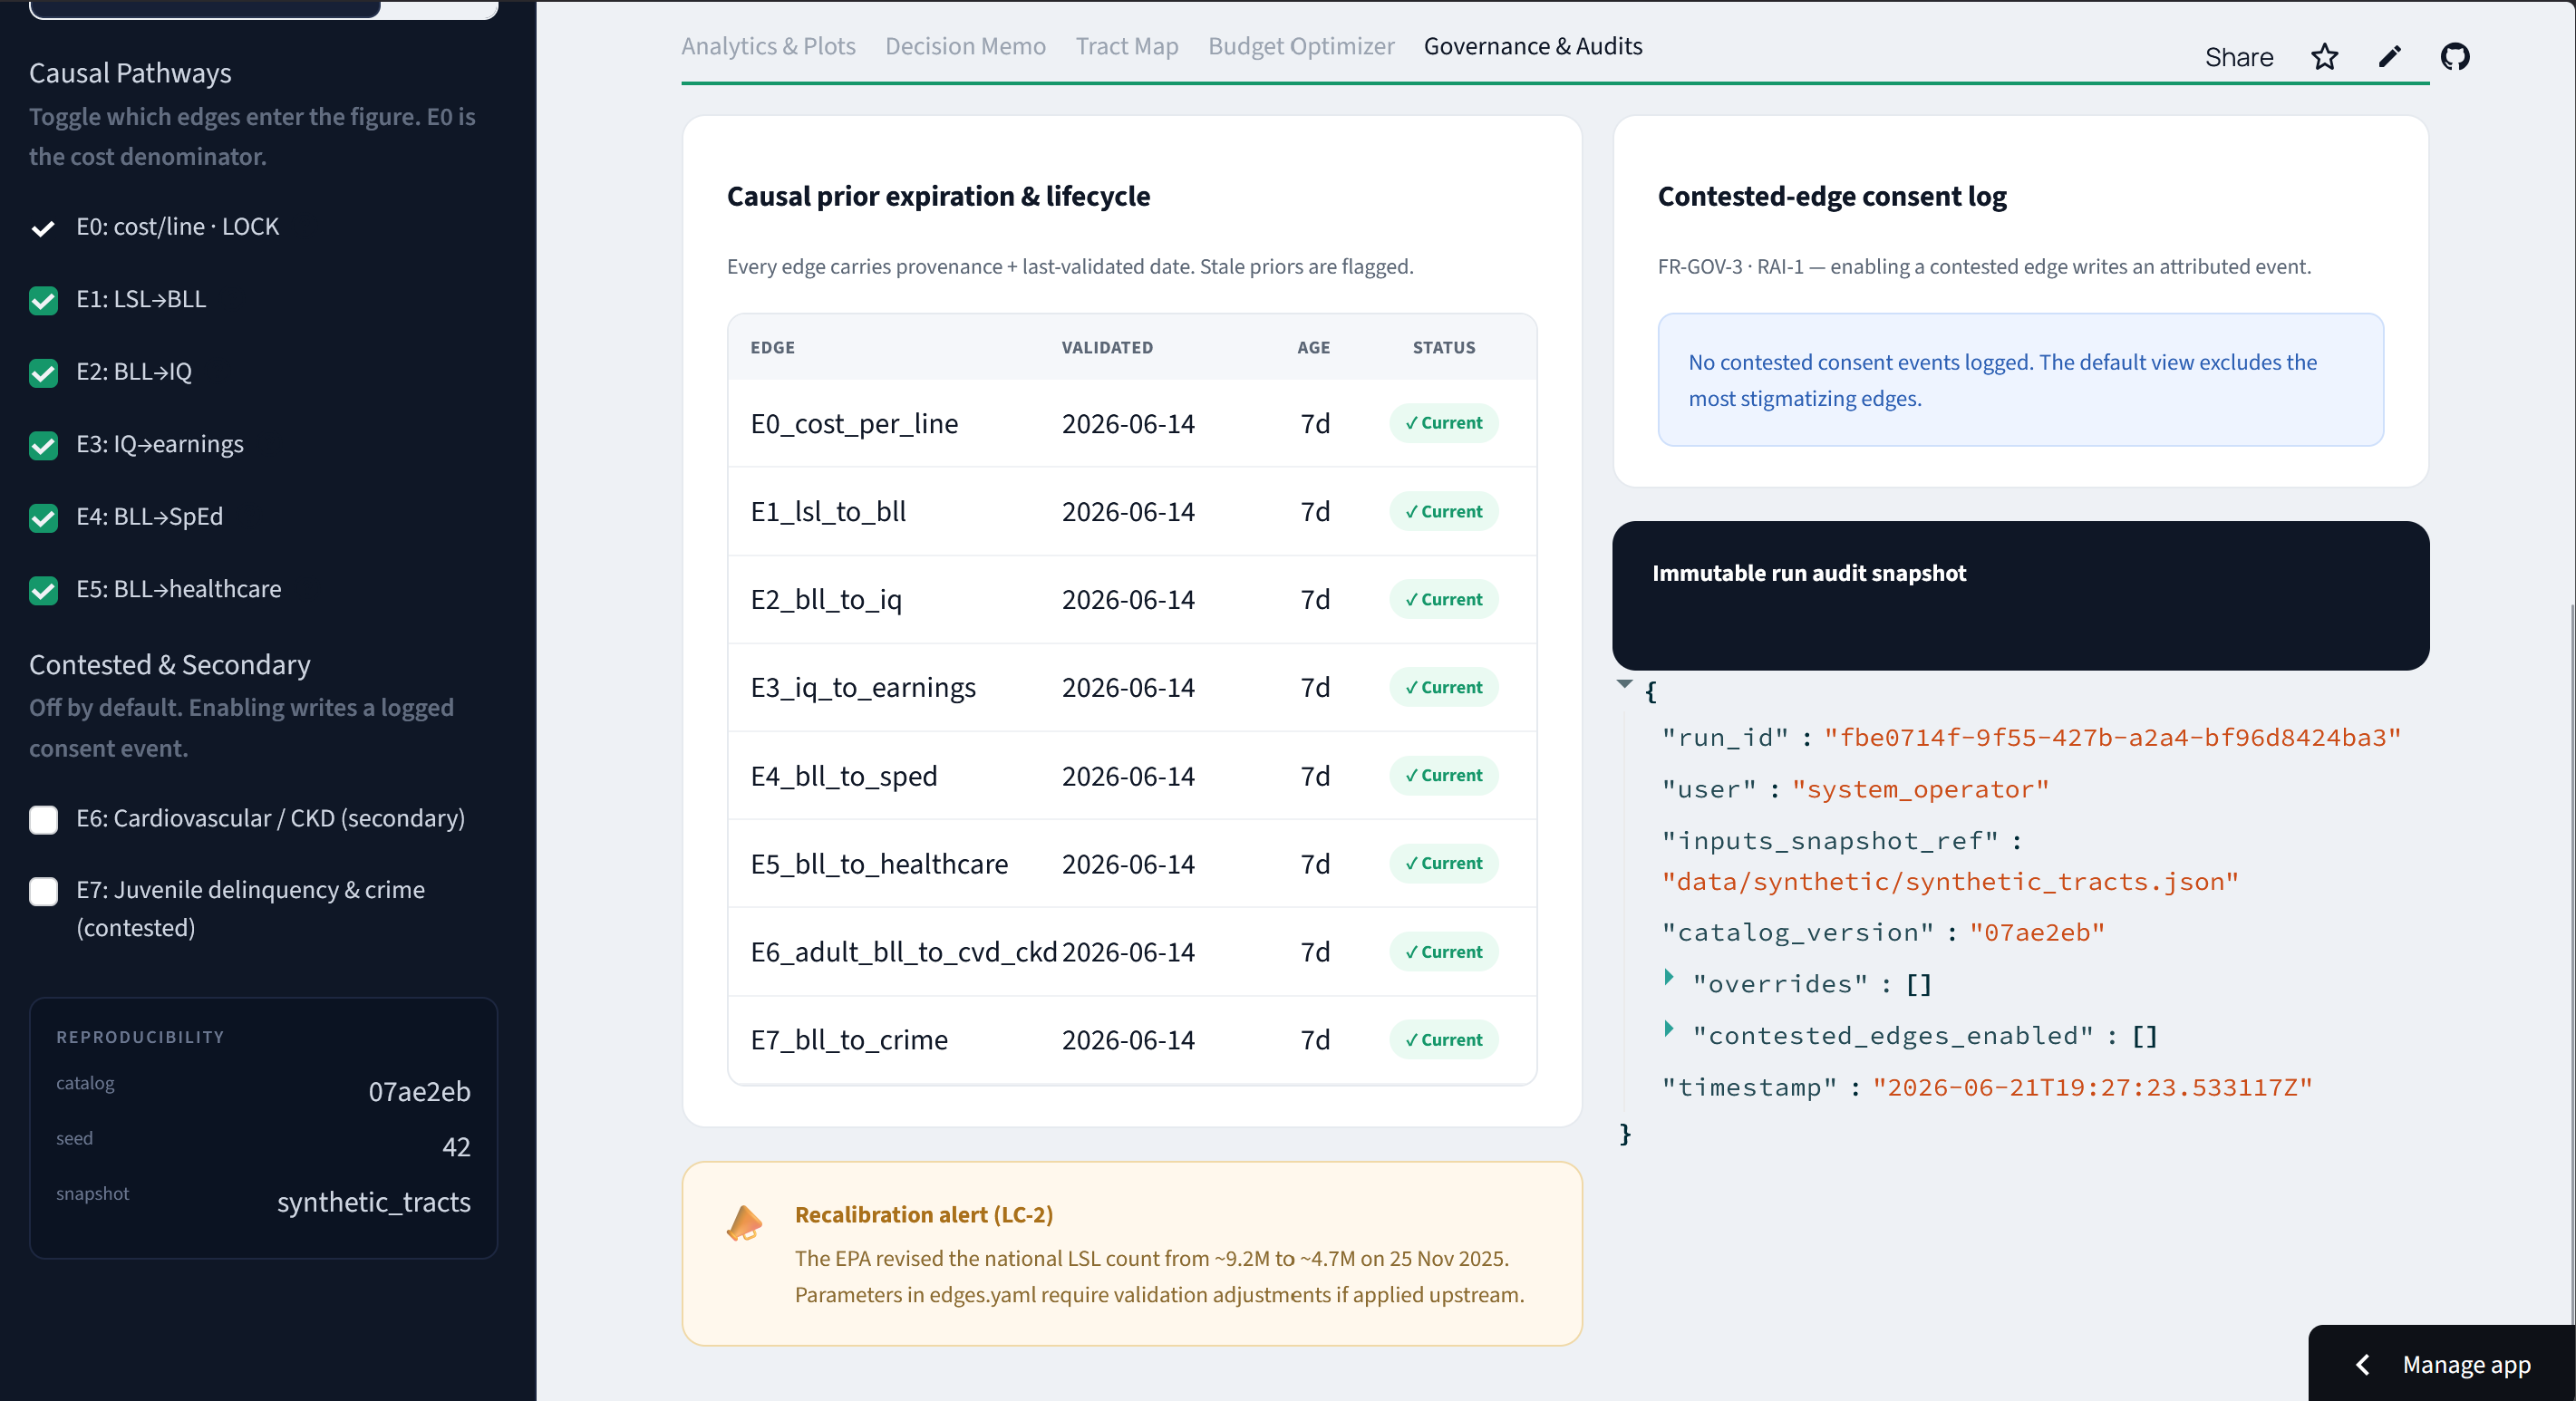
Governance: every prior dated for staleness, an immutable audit record per run, and contested edges off by default behind a consent log.
Inspiration
A lot of public spending comes down to "we'll deal with it next budget cycle." Deferring a lead pipe, a bridge fix, a housing voucher: it feels free, because the bill shows up somewhere else, years later, on a different agency's books. We wanted to make that hidden bill visible.
The trigger was a real event. In November 2025 the EPA revised its national lead-service-line count from about 9.2 million to roughly 4.7 million. If the country can't pin down how many lead pipes exist within a factor of two, then any tool that answers "what does waiting cost?" with one confident number is basically lying. That fact shaped everything: the honest answer is a range, not a figure.
What it does
Deferral Ledger estimates the downstream public cost of not replacing a lead service line now. For a given census tract and deferral horizon it answers one question: for every $1 you defer, how many dollars does that force other public budgets to spend later? We call it the deferral multiplier.
Instead of a single number you get a full posterior distribution with credible intervals and the probability that deferring actually costs more than acting. It also tells you the most useful next move for a cautious official: which uncertainty to buy down first (a Sobol sensitivity analysis usually points straight at the cost-per-line estimate). On top of that there's a replace-now-vs-defer comparison, a budget optimizer with an equity floor, a cited evidence trail for every number, a governance and audit log, and a plain-language memo.
How we built it
It's a causal DAG. Each edge (defer → blood lead → IQ loss → lost earnings, plus special education, childhood healthcare, and optional cardiovascular and juvenile-justice pathways) is a probability distribution pulled from a specific study, not a constant. We sample those distributions thousands of times (Monte-Carlo), push them through the cascade, and read off the multiplier's distribution. Sobol analysis attributes the spread back to individual assumptions, so you know what's actually driving the uncertainty.
The stack is deliberately boring and free: Python, NumPy/SciPy for the math, SALib for sensitivity, NetworkX for the graph, Pydantic for the data contracts, SQLite for the audit store, and Streamlit for the dashboard. A small FastAPI layer exposes the engine. Gemini turns the computed results into prose, but it never goes near a number.
Challenges we ran into
- Our first instinct was to print a tidy dollar amount. Killing that instinct and rebuilding around uncertainty and abstention was the actual work.
- The first exposure model double-counted: blood lead scaled linearly with every deferred year. We capped it and wrote the assumption down instead of hiding it.
- Sourcing honest per-child cost priors meant decomposing aggregate national figures. We documented every step.
Accomplishments that we're proud of
It knows when to shut up. If the 95% interval dips below break-even, it refuses to recommend funding and routes the case to a human. A self-validation layer checks its own intermediate numbers against the published literature and flags anything implausible. The most stigmatizing pathway (lead → crime) is off by default and only turns on with a logged consent event. Every figure on screen traces back to a citation.
What we learned
The hard part of "AI for decisions" wasn't the modeling. It was deciding what the system shouldn't compute and what it shouldn't decide. Uncertainty isn't a disclaimer you bolt on at the end; it's the product. A model that owns its failure modes turns out to be more useful to a real official than one that just sounds certain.
What's next for Deferral Ledger
Plug in real county inventories where they exist; formally transport the model to a second region (we've scoped an Indian city) using causal transportability instead of hand-waving; make the tract map clickable; and let analysts edit a prior in the UI and watch the posterior, plus the "which study to commission" recommendation, update live.


Log in or sign up for Devpost to join the conversation.