-
-
Poster
SEE LAST GOOGLE DOC BELOW FOR COMPLETE WRITTEN EVALUATION
FIRST LINK: Planning Document/1st Reflection
SECOND LINK: Github Repository
THIRD LINK 2nd Reflection
Fourth LINK: Final Written Evaluation
Deep Price Learning: Written Evaluation Predicting Price Trends Using Deep Learning
Group Members: Henry Pasts (hpasts), Justinian Vladutiu (jvladuti), and Alex Wang (awang199)
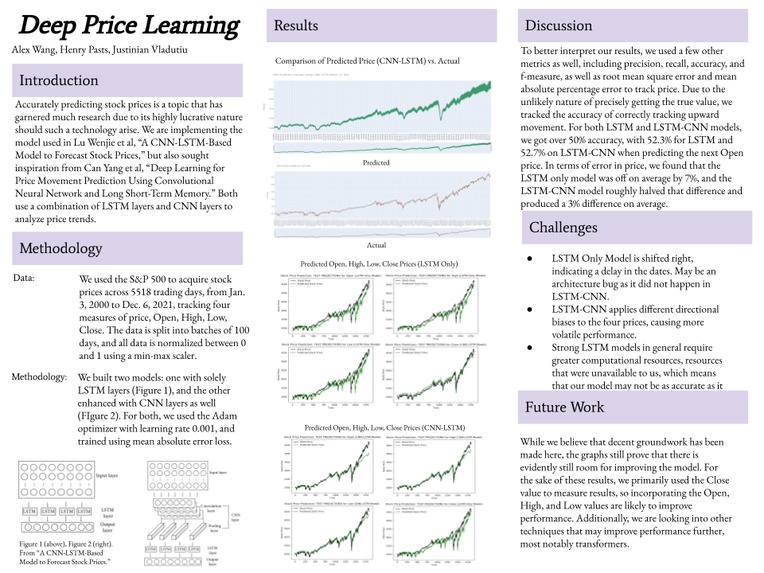
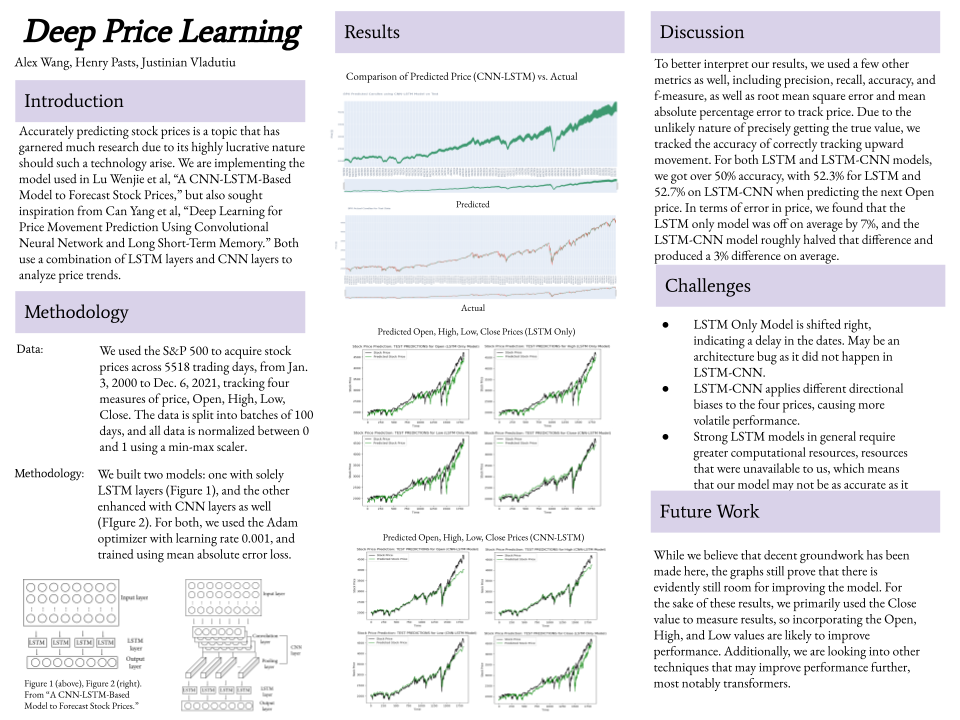
Introduction Predicting stock prices has been an undertaking of extensive research because of the real quantitative reward of profit if a successful model is deployed in real time. We have built two frameworks in which to analyze and predict price trends, one that is a pure LSTM approach and one that combines LSTM with a CNN for feature extraction. We build off the work in “Deep Learning for Price Movement Prediction Using Convolutional Neural Network and Long Short-Term Memory” and “A CNN-LSTM-Based Model to Forecast Stock Prices”, and deploy the latter paper’s CNN-LSTM model. We compare the results of our LSTM Only Model with the author’s CNN-LSTM model to see if adding feature extraction improves performance.
Methodology Data/Preprocessing The authors used the Shanghai Composite Index in their CNN-LSTM implementation, totaling 7127 trading days with the following measures of price: Open, High, Low, and Close. For our experiments, we use the S&P 500, an index measuring the value of 500 large companies listed on the U.S. stock exchanges. We used 5518 trading days going from 01/03/2000 to 12/06/2021, allocating the first 65% of the dataset to train data and predicting the last 35% of data.
We preprocessed our data in a similar fashion as the authors. First, we batched the train and test data into x_train and y_train for our four price streams and used rolling periods of 100 days, where the corresponding label for the batch was the next price after the 100 days. Subsequently, we used a min-max scaler to normalize the data between 0 and 1 for training and then inverted the predictions with the same scaler for graphing purposes. We used the uninverted results in our metrics when evaluating the performance of the model.
Model Architecture
Model 1: LSTM Only Model
See Model in Last Google Doc Link below.
This model trains and makes predictions for the Open, High, Low, and Close price of the next day independently without extracting features from their interplay/relationships. We use this baseline model to compare its results to the Author’s CNN-LSTM model to see if adding feature extraction improves prediction power.
Model 2: CNN-LSTM Model
See Model in Last Google Doc Link below.
This model was taken from “A CNN-LSTM-Based Model to Forecast Stock Prices'' with minor modifications. It uses a 1D convolution to extract the features of the Open, High, Low, and Close prices and then passes that information to an LSTM model with 4 layers, the final of which outputs 4 numbers, which represent the predictions for the 4 values. Instead of passing in and predicting each data stream independently, as in Model 1, it attempts to find features between the Open, High, Low, and Close price for each day to guide its predictions.
Results Model 1: LSTM Only Model
Chart Predictions
See Charts in Last Google Doc Link below
Metrics
Metrics Comparing the Magnitudes of Y and Y_hat
Open High Low Close Root Mean Squared Error 247.8712 230.8958 241.2267 239.7745 Mean Absolute Percentage Error 6.3983 5.9590 6.2777 6.2399
Metrics to Analyze Predicted Price Movement of Next Day (price up or down)
Open High Low Close Precision 0.5835 0.5462 0.5848 0.5542 Recall 0.5863 0.5467 0.5876 0.5576 Accuracy 0.5230 0.5010 0.5186 0.5137 F-Measure 0.5849 0.5464 0.5862 0.5559
Candlesticks of Predicted Open, High, Low, and Close S&P 500 Index 8/28/2014-12/06/2021
See Charts in Last Google Doc Link below
Candlesticks of Actual Open, High, Low, and Close S&P 500 Index 8/28/2014-12/06/2021
See Charts in Last Google Doc Link below
Model 2: CNN-LSTM Model
Chart Predictions
See Charts in Last Google Doc Link below
Metrics
Metrics Comparing the Magnitudes of Y and Y_hat
Open High Low Close Root Mean Squared Error 185.6400 125.0200 128.0178 130.5730 Mean Absolute Percentage Error 3.2366 2.774 3.2967 4.0926
Metrics to Analyze Predicted Price Movement of Next Day (price up or down)
Open High Low Close Precision 0.5770 0.5503 0.5729 0.5467 Recall 0.6530 0.6524 0.6359 0.656 Accuracy 0.5270 0.5156 0.5134 0.5150 F-Measure 0.6127 0.5970 0.5134 0.5964
Candlesticks of Predicted Open, High, Low, and Close S&P 500 Index 8/28/2014-12/06/2021
See Charts in Last Google Doc Link below
Candlesticks of Actual Open, High, Low, and Close S&P 500 Index 8/28/2014-12/06/2021
See Charts in Last Google Doc Link below
Discussion/Future Work The Root Mean Squared Error (RMSE) The first set of metrics (RMSE and MAPE) are historically used to analyze the efficacy of forecasting time series data. RMSE measures our prediction error in absolute terms on average. We can see that in both the LSTM Only Model and the CNN-LSTM Model, we had the lowest error when predicting the next High price of the S&P 500. Across the board, the CNN-LSTM Model does substantially better, producing errors for High, Open, Low, and Close that are 50% less as compared to those from the LSTM Only Model.
Mean Absolute Percentage Error (MAPE) MAPE measures how far off each prediction is, on average, from the actual value in terms of a percentage. Our LSTM Only Model was off around 7% on average for each of the price types, but this may have been an issue in our model design (see challenges section below). The CNN-LSTM Model did much better than this, and it cut the average percent off from the predictions and the actual price types by roughly 50%. The MAPE gives a more standardized way to view prediction errors by giving them in percentages, thus considering the relative differences that the RMSE does not.
Precision, Recall, Accuracy, F-Measure The context of these results needs clarification. We created a custom binary classifier for our test data and predictions, marking a 1 if price was greater than the previous day and 0 if price was less than the previous day. The first price for both our test data and predictions was not considered, as there would be no data point to compare it to. We subsequently ran our Precision, Recall, and Accuracy metrics on the difference between the up and down movements of the actual price vs. our model’s predictions. Essentially, even if the model cannot predict the exact next price, if it can predict the direction of the next price, it would be an invaluable tool for analyzing markets. We found that we could predict the direction of the next day slightly better than random (50%) for both our LSTM Only and CNN-LSTM Models. For both models, our prediction accuracy for the Open price was the best at 52.3% for LSTM Only and 52.7% for CNN-LSTM. In terms of Precision, Recall, and F-Measure, we get good Precision (54% or higher for both models with CNN-LSTM slightly outperforming) indicating that we are fairly accurate in predicting positive price action and our Recall rate for both models (54% or higher for LSTM Only and 63% or higher for CNN-LSTM) indicates that we are successful in finding all the true positives (increasing in price). This is intuitive because our graph has an upward bias. Finally, our F-Measure, which considers both precision and recall in a more equal fashion, not prioritizing either one, has more variance across our tests.
Challenges
LSTM Only Model Predictions Shifted Right One of the major challenges we faced was in our baseline LSTM Only Model, where our predictions seem to be delayed to the right. We built the model architecture manually while still using tf.keras.Sequential, but with our own call, loss, train, and test functions. It is possible that there is a slight error in this model architecture that we plan on fixing as we do more research and potentially deploy working strategies in real time. We did not experience this shifting of predictions as much in the CNN-LSTM Model where we used the Keras API to handle model compiling, fitting, and predicting.
CNN-LSTM Smoothing Issue in Candlestick Chart Our CNN-LSTM model seems to ‘smooth’ out the data and applies different directional bias to Open, High, Low, and Close, thus reducing the consistency of these metrics. This results in candlestick charts that are rather uninformative because we cannot guarantee that the predicted High is in fact the High for that day, as the Low price may have a higher directional bias that compounds past the High price. The result is that ALL Low prices are predicted to be higher than the High price for each day, resulting in the candlestick graph above. We saw some of this effect in the LSTM Only Model, but to a lesser extent. Future work may consider not running the CNN Model on the Open, High, Low, and Close all together to see if this directional bias can be removed.
Computational Resources In addition to the sheer amount of debugging that went into the construction of these models, we had to be very careful in our model design because our computational resources are limited and LSTMs are notoriously difficult to train on a local device. Thankfully, we had powerful GPUs that sped up the process, but on an industrial scale we would use AWS GPU or TPU farms for training to drastically reduce time spent training. Thus, dealing with our technological limitations was another challenge for this project specifically.
Reflection
How the Project Turned Out We believe we have some solid groundwork done in terms of moving forward to creating a successful Deep Learning Model that can predict stock prices. Our current work with CNN-LSTMs is encouraging. In addition to showing that the addition of feature extraction with a CNN improves model efficacy, thus confirming the conclusions of the authors of “A CNN-LSTM-Based Model to Forecast Stock Prices.” Although predicting the direction of the next Open price or Close price with 51% or 52% accuracy does not seem like much, over long periods of time such a strategy has the potential to result in many profitable trades that could outweigh transaction costs and losing trades.
Model Results vs. Expectations In general, we were pleased with the results of the CNN-LSTM Model and its improvement in performance against the LSTM Only Model. Initial tests solely using Close price showed us that it was possible to predict the direction of price with some level of accuracy better than randomly guessing, thus we expected our model to improve when taking into account the Open, High, and Low prices in addition to the Close price, since there is much to learn from these values and their relations each day.
Pivots and Things We Would Have Done Differently During the course of our project, we had to pivot immensely. Although we drew a lot from the experience of attempting to implement the first paper we considered, “Deep Learning for Price Movement Prediction Using Convolutional Neural Network and Long Short-Term Memory”, we ultimately chose to focus on the model architecture in “A CNN-LSTM-Based Model to Forecast Stock Prices” because of its emphasis on candle prediction and clearer model structure. This allowed us to pivot and implement a powerful CNN-LSTM model. In hindsight, we should have pivoted much earlier in the process, but were able to implement a meaningful model with meaningful results in line with the authors.
Future Improvements Current implementation does not consider the order of the High and Low prices. It may be relevant to learn how the Open and Close are affected by the order of the High and Low price for a given day’s candle. We wonder if including transformers and which of these events comes first may improve the model’s ability to predict future recurring intraday price movements.
Takeaways After this project, we have a much bigger appreciation for how hard it can be to extend deep learning to other fields, such as finance. We would not have necessarily thought of trying to use LSTMs ability to store both long and short term memory to predict prices without extensive research from existing papers. Moreover, a big takeaway was that these Deep Learning techniques and models seem to have great potential for financial applications such as algorithmic trading. However, careful thought must be taken in the model creation process and we must consider the lessons learned from previous modeling architectures. The biggest lesson learned from the CNN-LSTM models was that the predictions generated may not be consistent within our context of the High price being greater than the Low price, thus hindering our ability to predict each metric in a way consistent with reality. Thus, it may be best to predict these metrics independently and only predict one of them at a time, as compared to all at once.
Built With
- python
- tensorflow


Log in or sign up for Devpost to join the conversation.