-
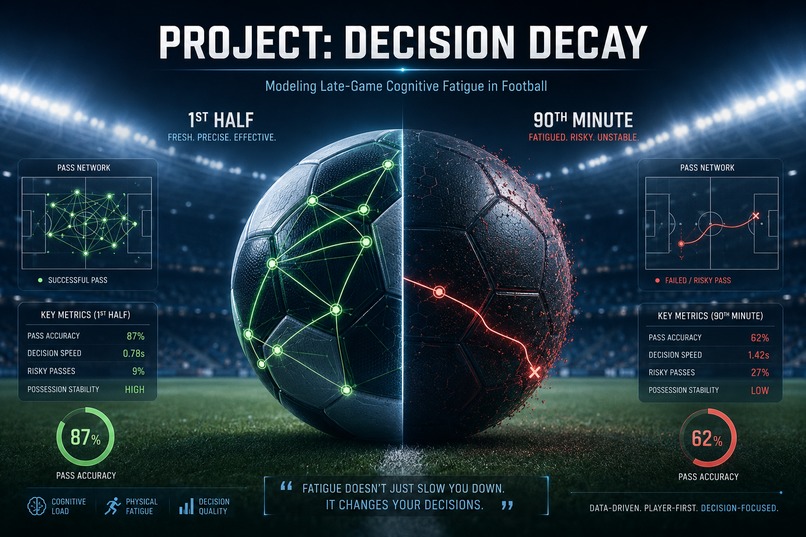
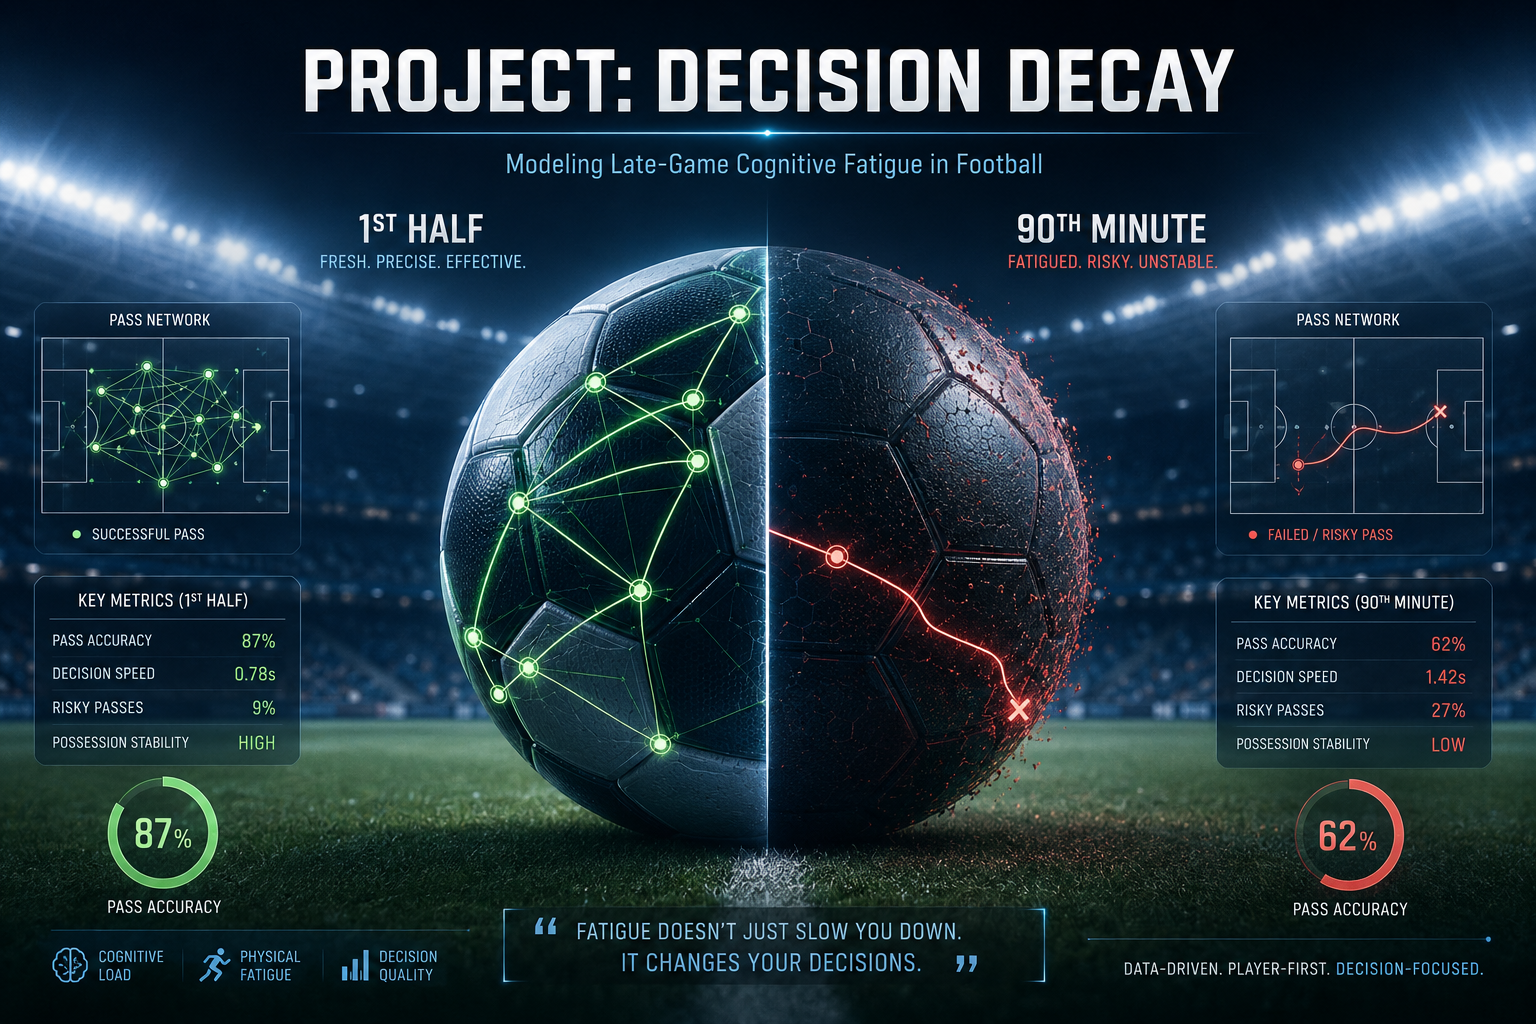
Fatigue changes decisions. A visual comparison of pass accuracy and cognitive decline by the 90th minute.
-
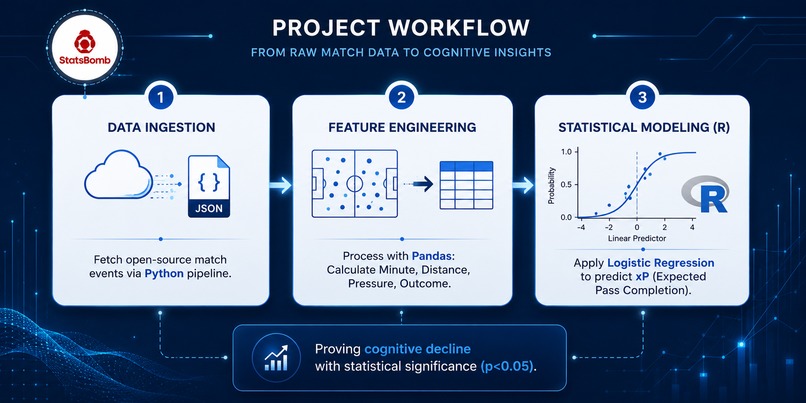
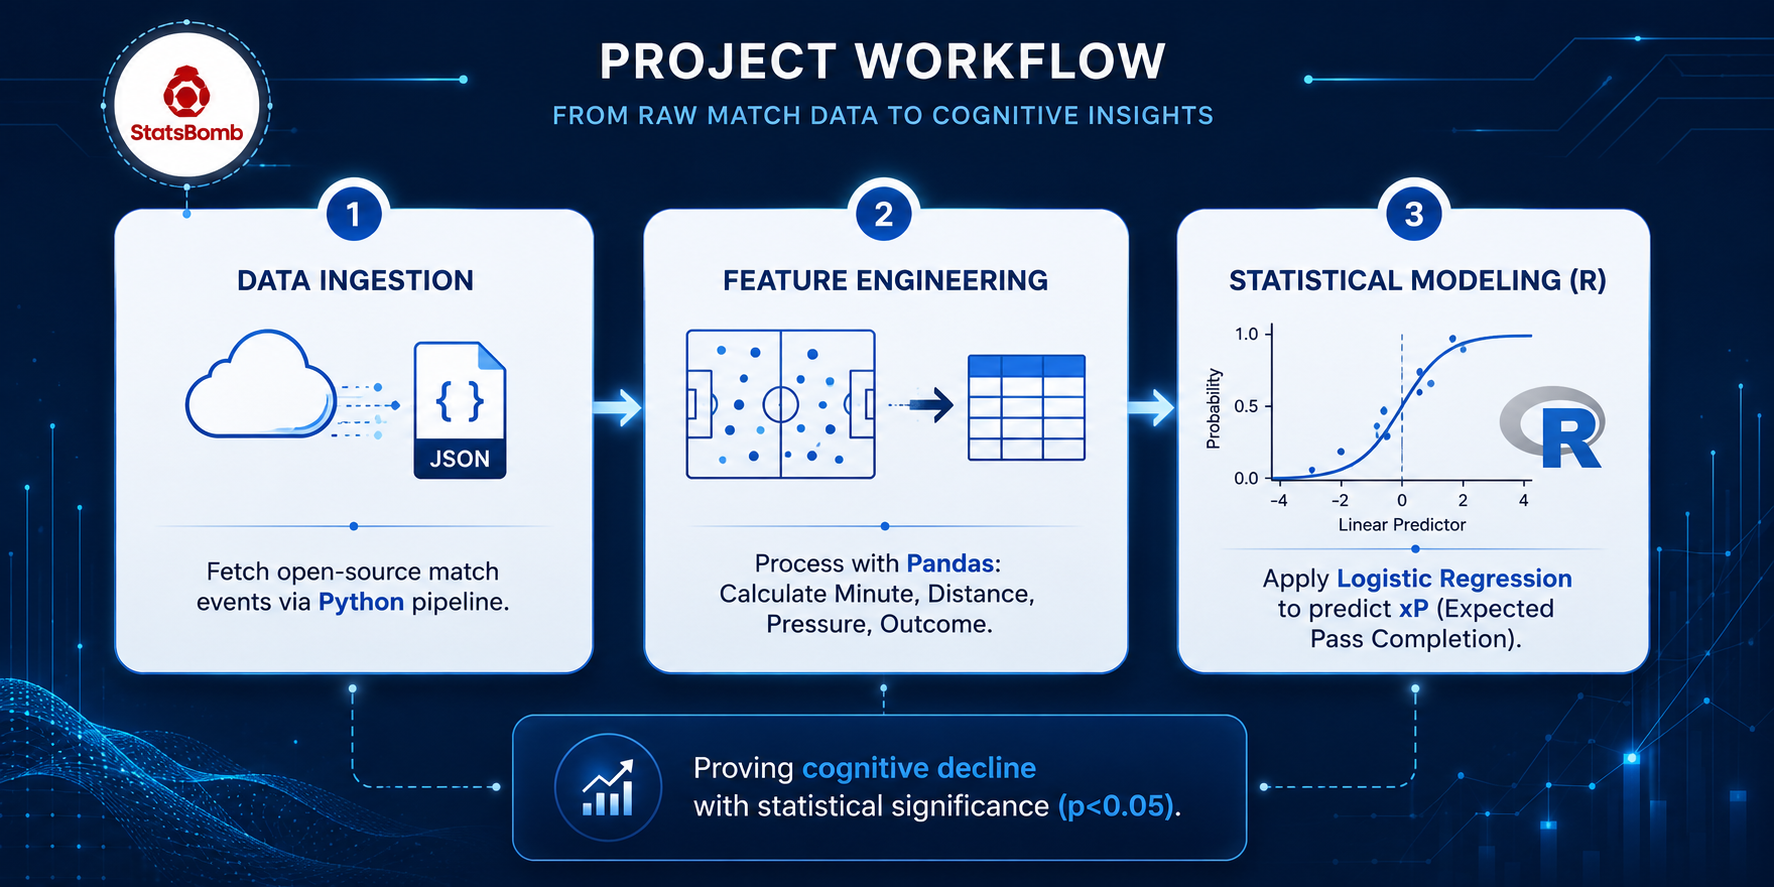
Our technical pipeline: From automated Python data ingestion to R-based logistic regression modeling.
-
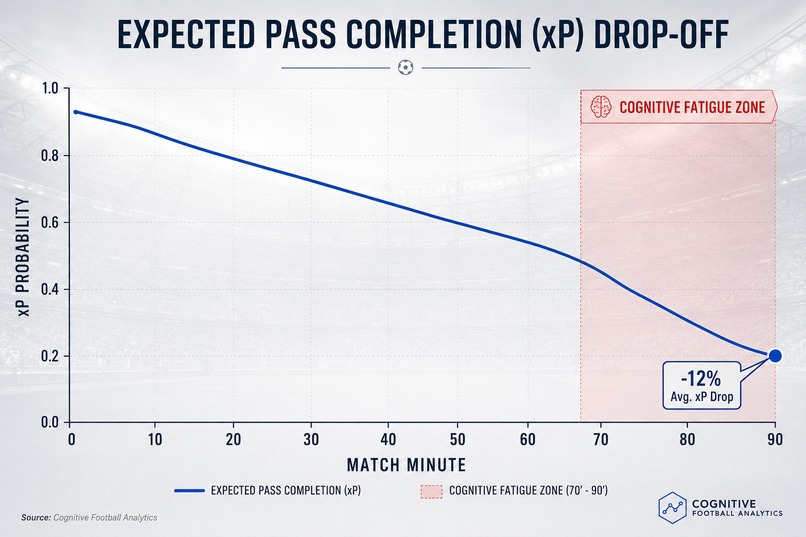
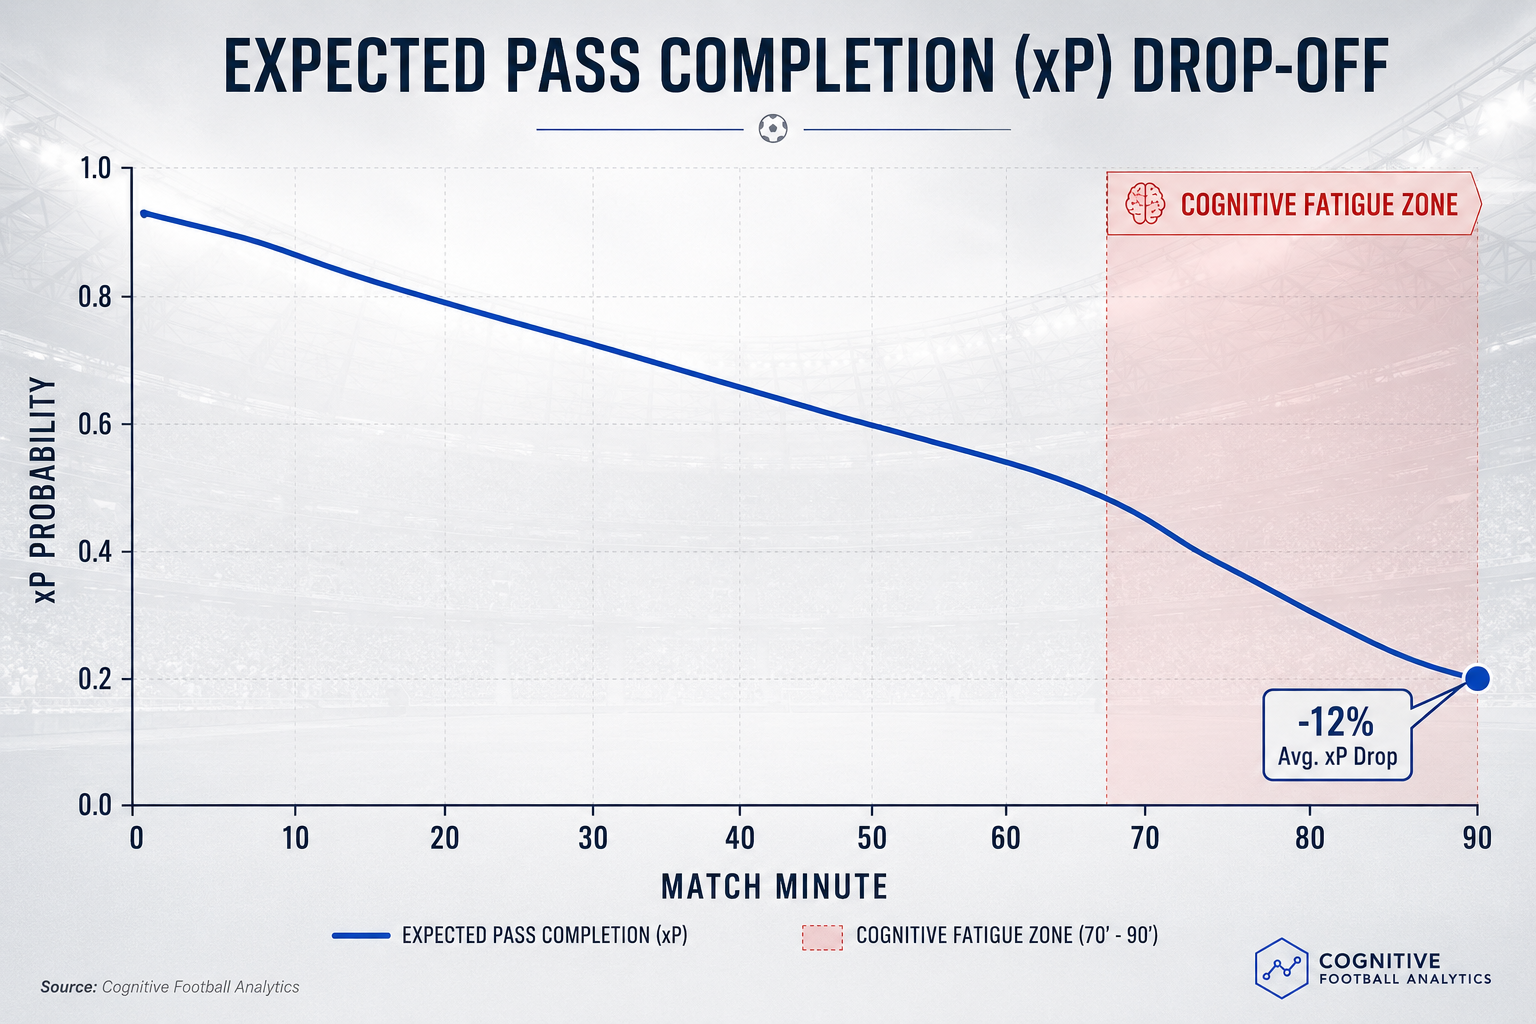
The Decision Decay curve: A statistical model proving how expected pass completion (xP) drops in the final minutes.
-
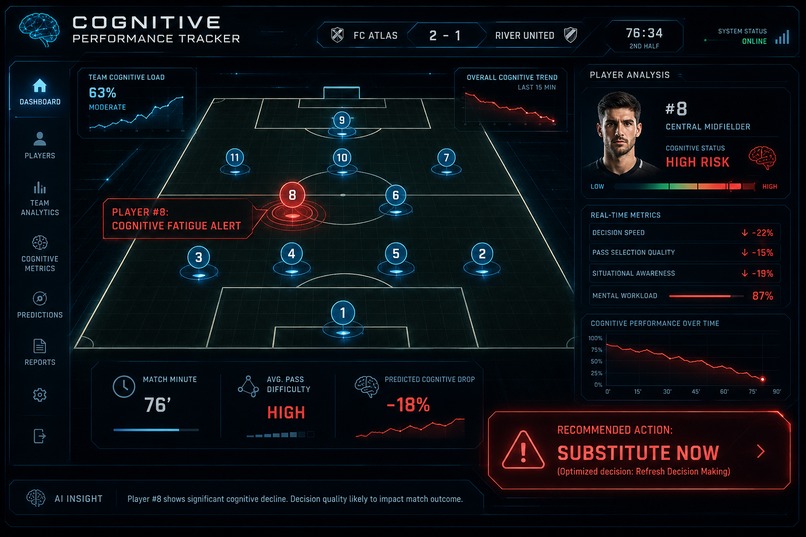
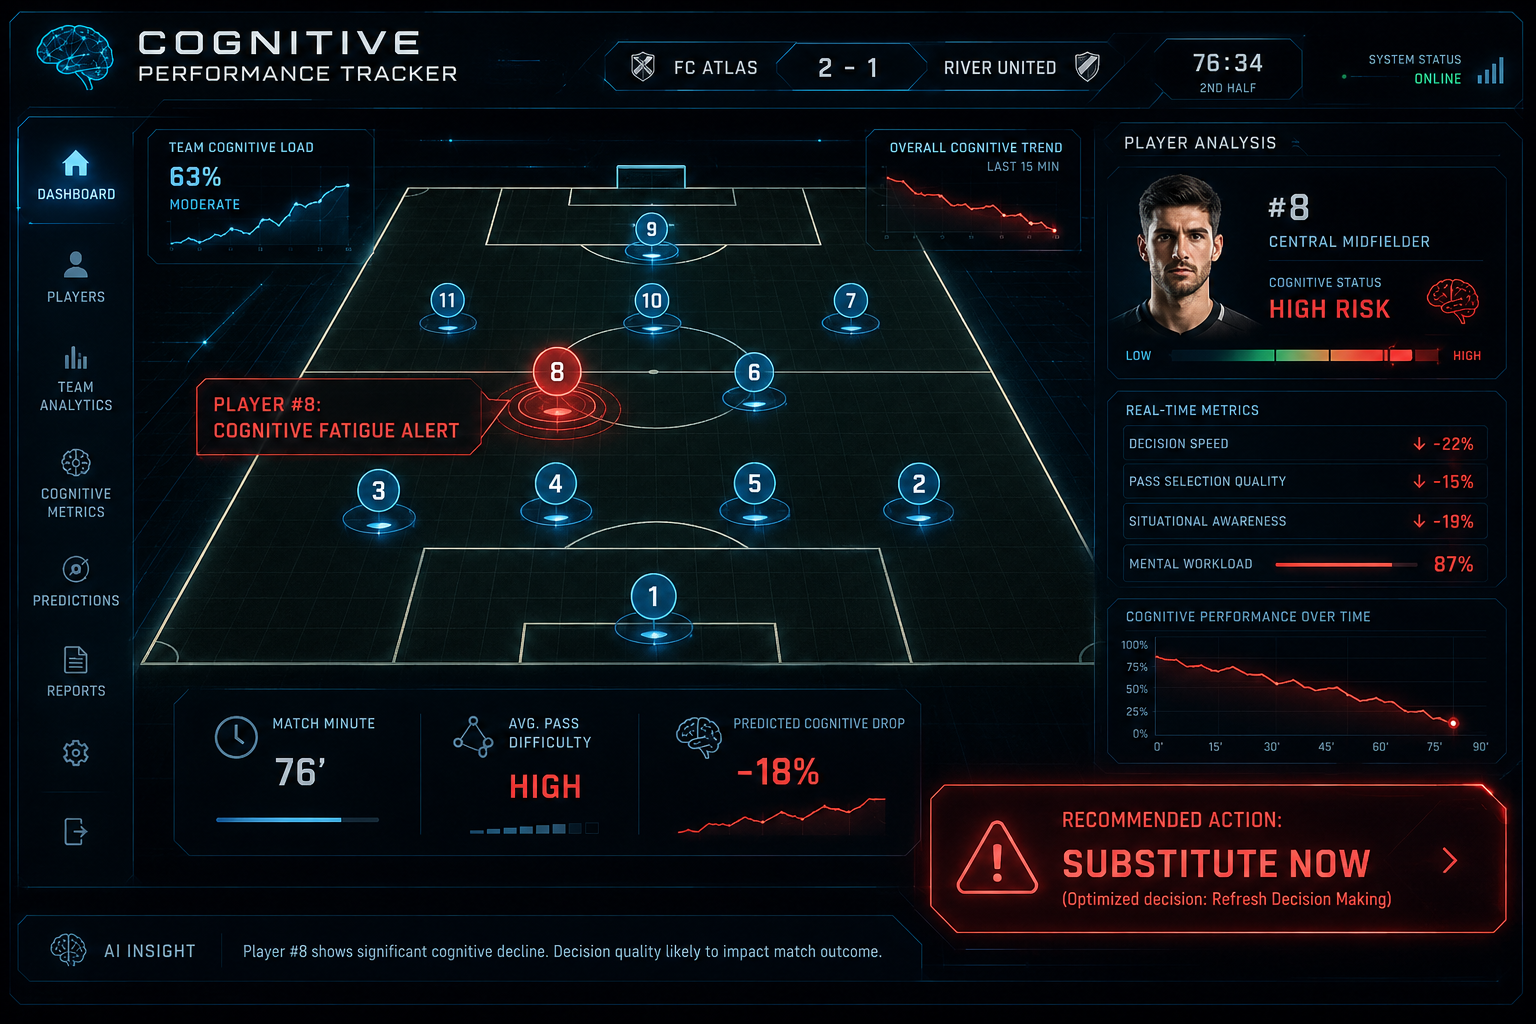
Real-world impact: A conceptual dashboard tracking cognitive drop-offs to recommend data-driven substitutions.
Inspiration
In late-game situations, analysts often attribute poor decision-making to physical exhaustion. However, I hypothesized that "cognitive fatigue"—the decline in spatial awareness and decision quality under pressure—is just as detrimental, if not more so. I wanted to prove mathematically that as the match progresses, players tend to choose lower-probability passes, regardless of their physical running distance.
How I built it
The project relies on a robust data pipeline and statistical modeling.
- Data Ingestion & Automation: I set up an automated workflow to pull open-source match event data (like StatsBomb JSON files) and route them into local directories for processing.
- Data Wrangling: Using Python and pandas, I parsed the complex event dictionaries to extract variables such as pass coordinates, defensive pressure, and match minute.
- Statistical Modeling: I transitioned to R to build a Logistic Regression model predicting Expected Pass Completion.
The core model evaluates the probability of a successful pass based on key game contexts: pass distance, defensive pressure, and the specific minute of the match. By comparing the expected success rate of decisions made in the first 15 minutes versus the last 15 minutes, the model calculates the exact drop-off in cognitive sharpness.
Challenges I ran into
Working with highly nested JSON event data was initially a bottleneck. Flattening spatial coordinates and tracking defensive pressure for every single pass required extensive data cleaning in Python before it could be formatted neatly for statistical analysis in R. Additionally, isolating "mental fatigue" from traditional "physical fatigue" required careful feature engineering.
Accomplishments that I'm proud of
Successfully bridging an automated data ingestion pipeline with advanced statistical modeling. The resulting metric clearly highlights a hidden aspect of player performance that traditional box scores miss entirely.
What I learned
I deepened my understanding of spatial data manipulation in Python and learned how to interpret logistic regression results dynamically in R to create a completely new, sports-specific metric.
What's next for Decision Decay
I plan to integrate a frontend dashboard to visualize the cognitive drop-off curve for individual players, helping coaches make data-driven substitution decisions in the late stages of a game.
Built With
- data-analysis
- logistic-regression
- machine-learning
- n8n
- pandas
- python
- r
- sports-analytics
- statsbomb


Log in or sign up for Devpost to join the conversation.