-
-
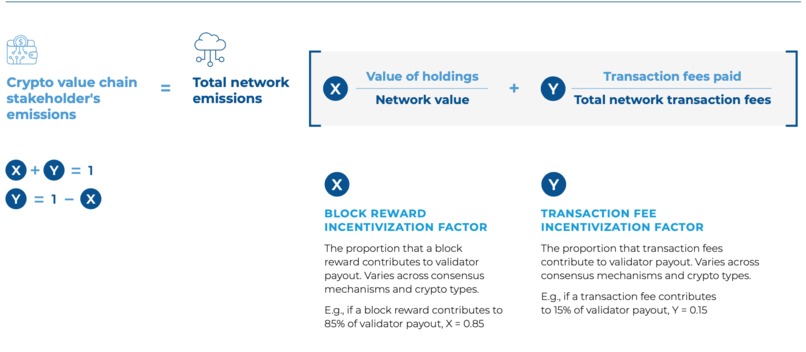
Carbon Emission Formula
-
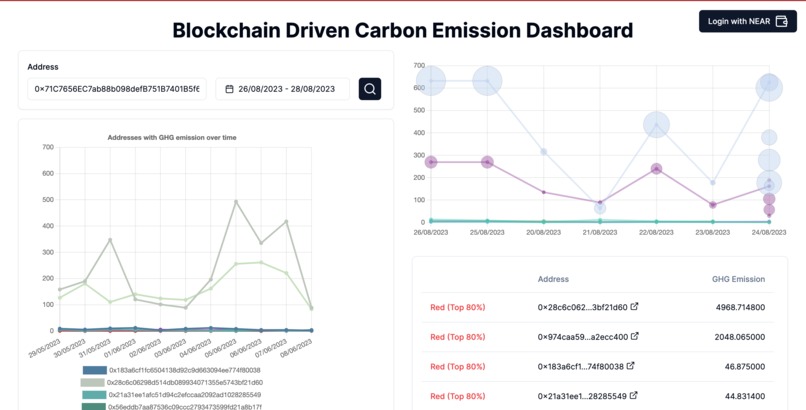
MVP
-
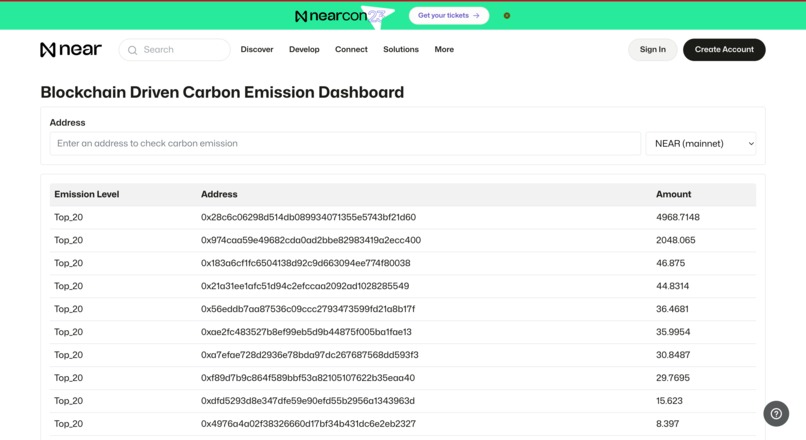
NEAR BOS
-
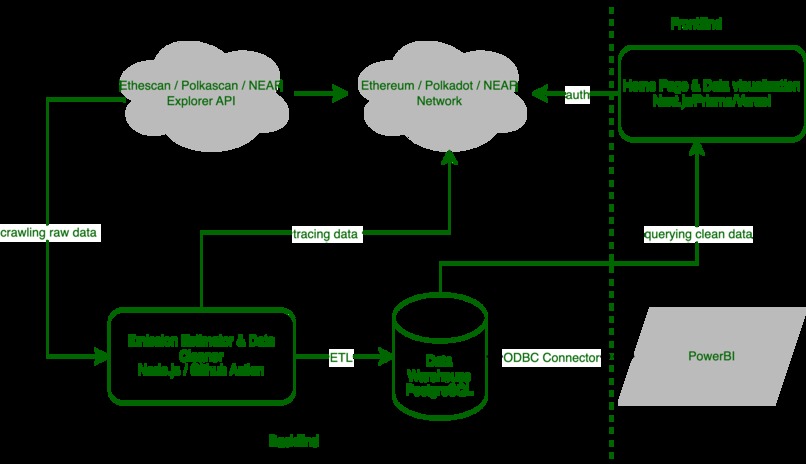
System Components
-
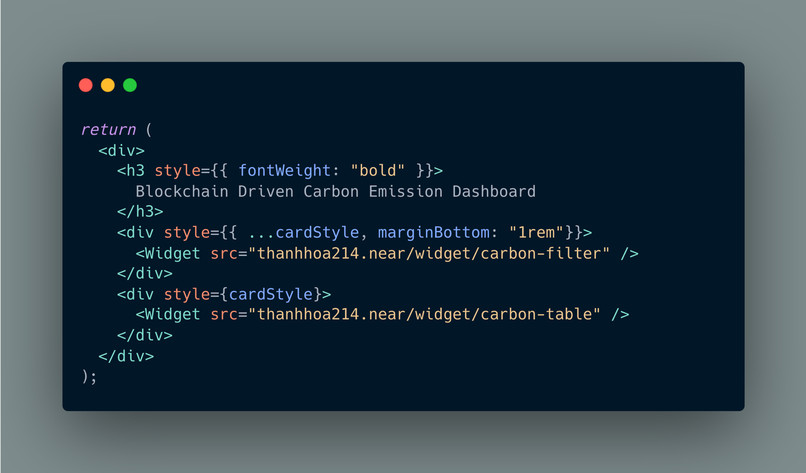
NEAR BOS (Embed Script)


Inspiration
- Trends
- We are living in the 21th Century. People are talking global warming, sea level raising, ... and climate changing. Our team want to be a potential fragment of green big picture for the humankind effort
- Global investment flow is to focus on clean tech, ESG, renewable energy, ... and carbon credits. We are looking an investment opportunity to apply our technology knowledge in the next creative industry
- Pains
- Too many ideas to turn carbon credit into cryptocurrency for trading but the problem is to reduce carbon emission instead of generating new cryptocurrency
- It is not enable to Measure first, Buy later because there are lack of the conceptualization of methodologies and theories for calculating carbon emission from internet' activities
- Passions
- Growth hacking driven frameworks and tools are conceptualizations of agile methodologies and data driven theories for user acquisition. Why is not green hacking existed for carbon reduction?
- Cloud computing is evolution then it makes a big change for transforming CAPEX model into OPEX model in purchasing computing infrastructure. Is it possible for an analytical platform to help calculating and estimating carbon emission from digital activities ? Then people can purchase carbon credit bill daily in OPEX model instead preorder carbon credit budget yearly in CAPEX model
What it does
a) Problem vs Solution Fit
User personal: A green web3 developer in 2033
Problem: How to calculate and estimate carbon emission for next frontend version
Solution: A platform is to monitor with green metrics and dashboard visualization which shown performance changes for every new update
b) Solution vs Minimal Visual Product Fit
As a green web3 developer , I want to change time range so that I can filter carbon emission change within time range of my new deployment.
As a green web3 developer, I want to be remove less profiled interactive addresses so that I can focus carbon emission's stream of addresses which I suggest to make impacts.
As a green web3 developer, I want to list 20% interactive addresses which make 80% carbon emission within my selected time range so that I can detect which address to test impacts.
As a green web3 developer, I want to list of top 20% to show total carbon emission and average speed of carbon emission of each address within my selected time range so that I gain more information to test impacts.
How we built it
- [x] Researching algorithms to calculate carbon emission per transaction and block
- [x] Redesigning Algorithms Enhancement
- [x] Researching multi-dimensions database to model schema for Algorithms
- [x] Database Modeling and Data Migrating
- [x] Mocking data for Chart Building and SQL Optimization
- [x] Frontend Development with CI/CD
- [x] Backend Development with CI/CD
- [x] Integrating NEAR, Polkadot and Ethereum
- [x] Releasing MVP
- [x] Wikis
Challenges we ran into
The first, there are no research for calculating carbon emission on blockchain for each single transaction while we have to analysis carbon emission related algorithms from many research then concepts the new one. It is not 100% exactly, but it could be corrected 95% estimation.
The second, multi-dimensions database for multi blockchain network. We want to design one schema which adapts most blockchain network's transaction data.
The third, business requirement. Actually, green engineer (or green web developer) is not existed yet. We don't know what daily their job look like, what charts or data stories they should have, what green metrics is besides kgCO2 or kgCO2/hour.
Accomplishments that We're proud of
We completed 2 charts which is included datasets, SQL queries sample and insight proposal for green engineers
What we learned
Concepts to calculate and estimate carbon emission from web3 application
What's next for deCarbon Protocol
more charts, more contributor and more lovers.
Built With
- bos
- chart.js
- ethers.js
- etherscan
- near
- next.js
- node.js
- postgresql
- powerbi
- subscan.io
- vercel


Log in or sign up for Devpost to join the conversation.