Inspiration
Every student around me was taking loans — phone EMIs, education loans, bike loans — without knowing if they could actually afford them. I watched a friend default on 3 EMIs in the same month and lose his credit score at 22. The scary part? He had no idea it was coming. There's no simple tool that tells a young borrower "you will run out of money in 4 months if you take this loan." I built DebtTrap Scanner to be that tool.
What it does
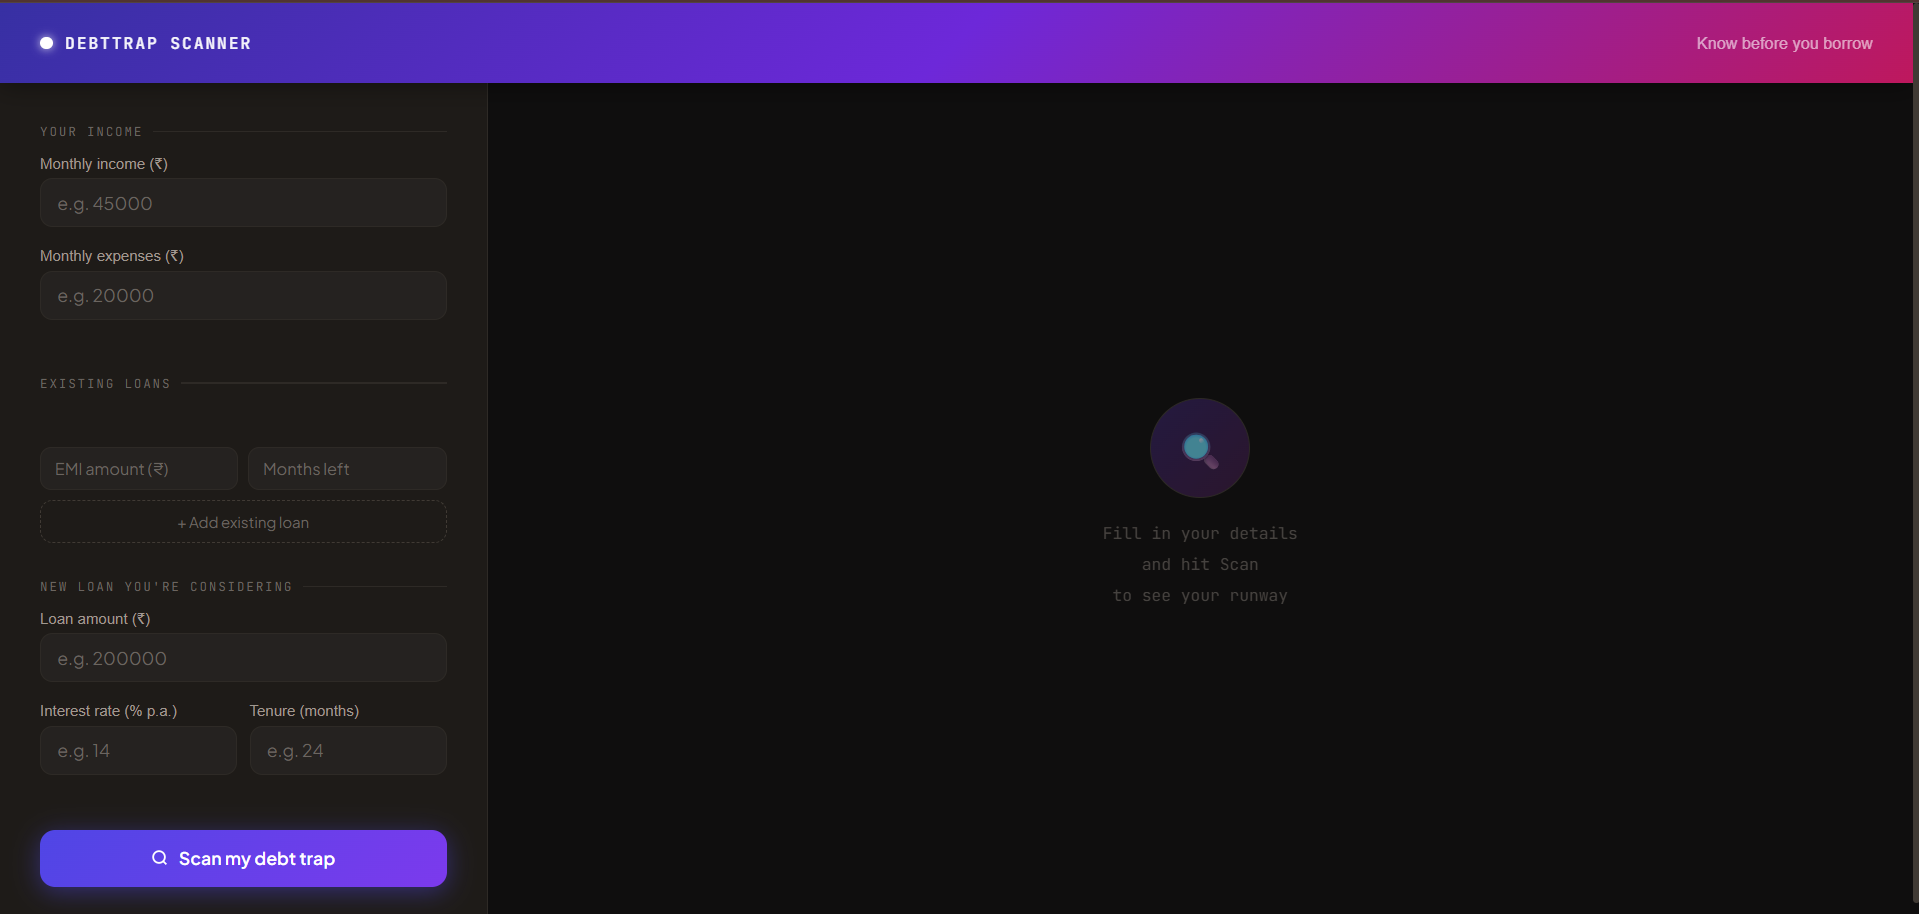
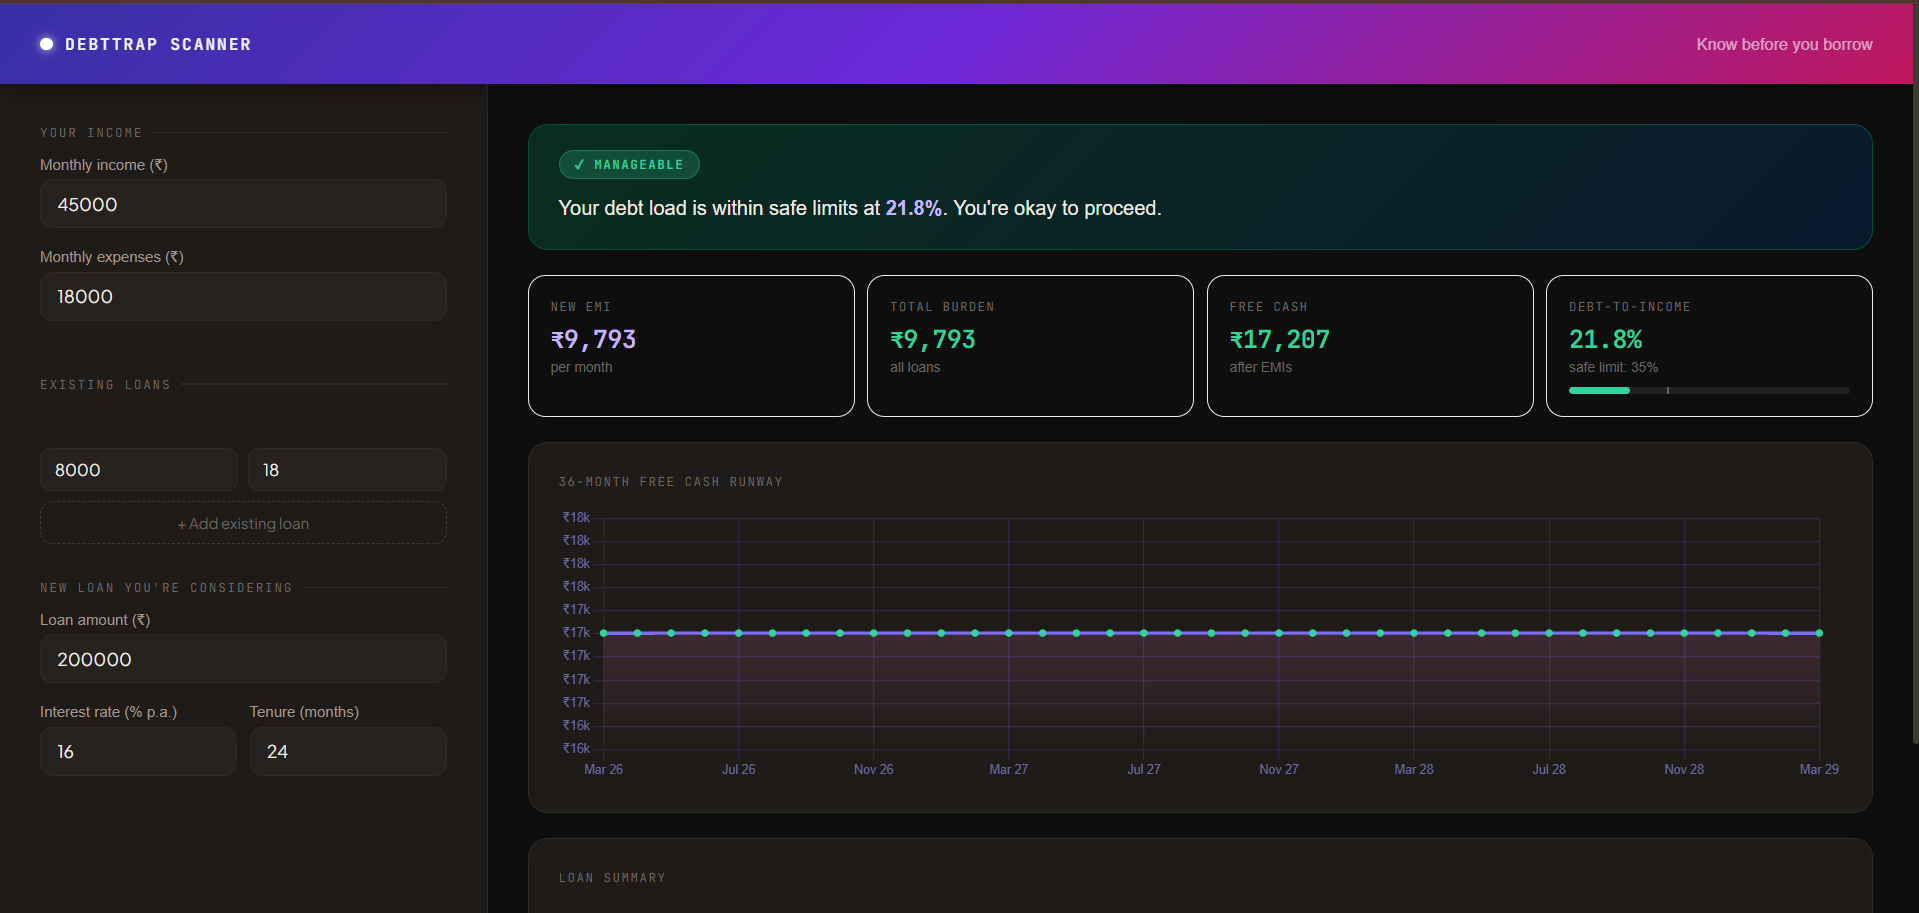
DebtTrap Scanner is a real-time debt spiral visualizer. You enter your monthly income, existing EMIs, and the new loan you're considering. In seconds it shows you:
- Your exact Debt-to-Income ratio vs the safe 35% limit
- Your free cash remaining after all EMIs every month
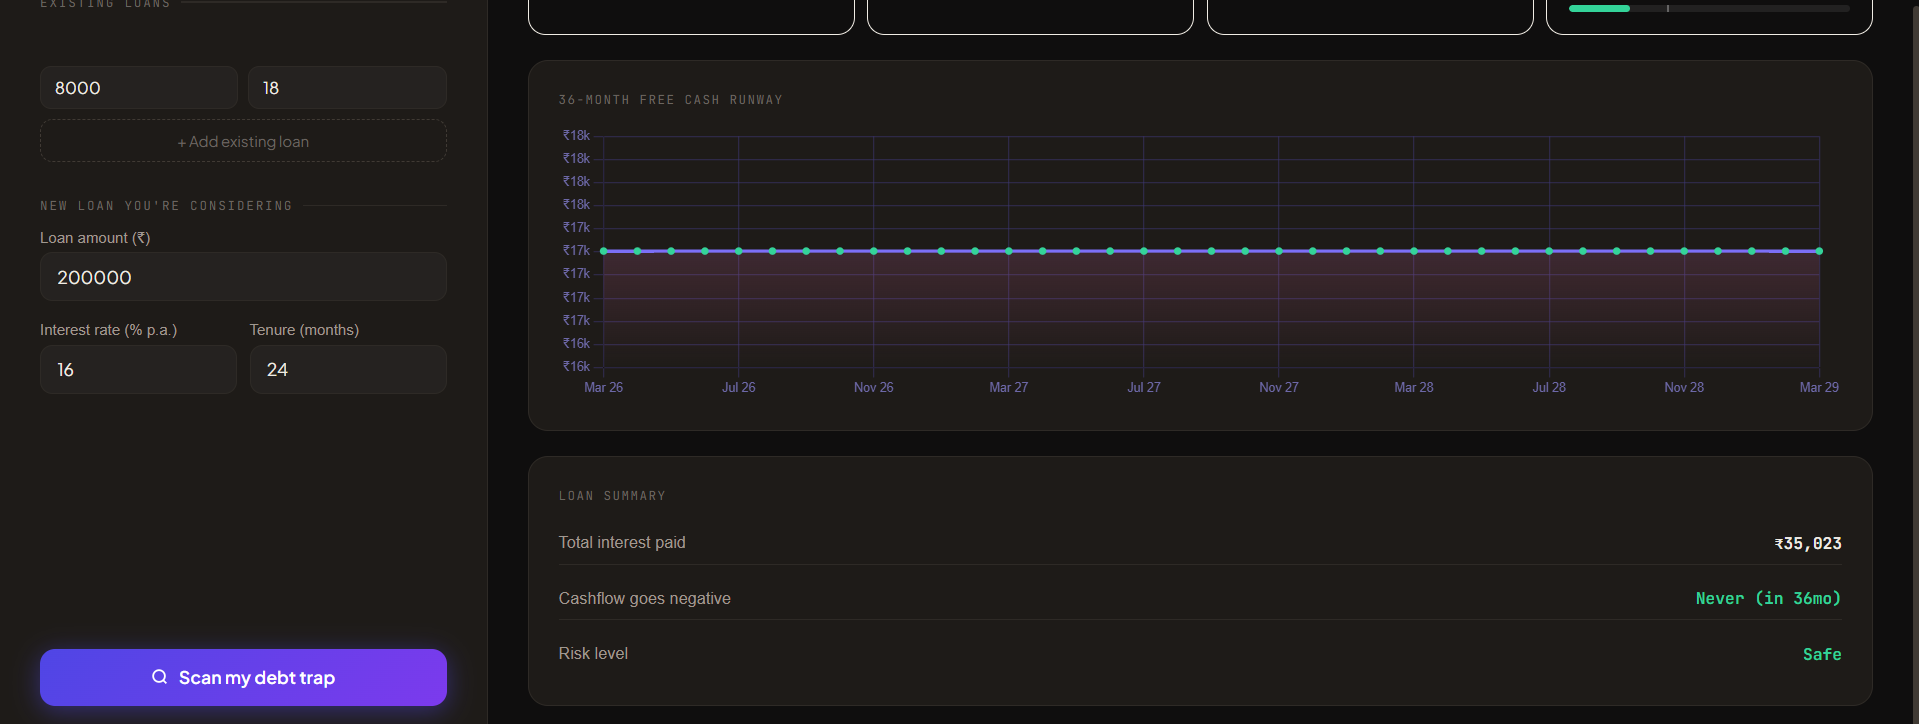
- A 36-month animated runway chart showing exactly when your cash flow hits zero
- The precise month you go cashflow negative — e.g. "You'll be insolvent by August 2026"
- A clear verdict: Debt Trap / High Risk / Manageable
No sign-up. No bank access. No API keys. Works entirely in the browser — even offline.
How we built it
Built with React 18 for the component architecture, Chart.js for the animated 36-month runway visualization, and pure JavaScript math for the EMI calculations using the standard reducing-balance formula. The entire app is frontend-only — no backend, no database, no API calls. Deployed on Vercel with auto-deploy from GitHub on every push.
The UI uses CSS variables for the dark purple/pink theme, with color-coded danger zones (red = debt trap, amber = high risk, green = safe) so the financial verdict is immediately readable at a glance.
Challenges we ran into
The biggest challenge was making the math feel human. Raw numbers don't create urgency — but "you go broke in 7 months" does. Getting the insolvency detection right (accounting for existing loans that expire mid-runway) took several iterations. Also handling the Chart.js gradient fill in React with proper canvas context timing was tricky.
Accomplishments that we're proud of
- Zero external dependencies for the core logic — pure math
- The insolvency month detection works across overlapping loan tenures (existing loans expiring + new loan continuing)
- The UI communicates financial risk without any financial literacy required — a 19-year-old can understand it instantly
- Built and deployed end-to-end as a solo project
What we learned
Financial tools don't need to be complex to be powerful. The single most impactful feature was the insolvency date — one specific future month shown in red. That's more emotionally resonant than any percentage or ratio. Simplicity is the real feature.
What's next for DebtTrap Scanner
- Loan Comparison Mode — compare Bank A vs Bank B side by side
- Escape Plan Generator — prepayment simulator showing how to get out of a debt trap faster
- AI Financial Advisor — natural language advice powered by Claude API ("Should I take this bike loan?")
- UPI Import — auto-fill EMI data from UPI transaction history
- PDF Report Export — shareable financial health report

Log in or sign up for Devpost to join the conversation.