Inspiration
As someone who watched friends and family struggle with unmanageable debt—juggling credit cards, student loans, and auto payments without a clear plan—I knew there had to be a better way than generic advice. The frustration of choosing between "Avalanche" and "Snowball" methods blindly, without seeing hard numbers on savings or timeline, sparked the idea: build a tool that turns abstract strategies into concrete, personalized plans.
What it does
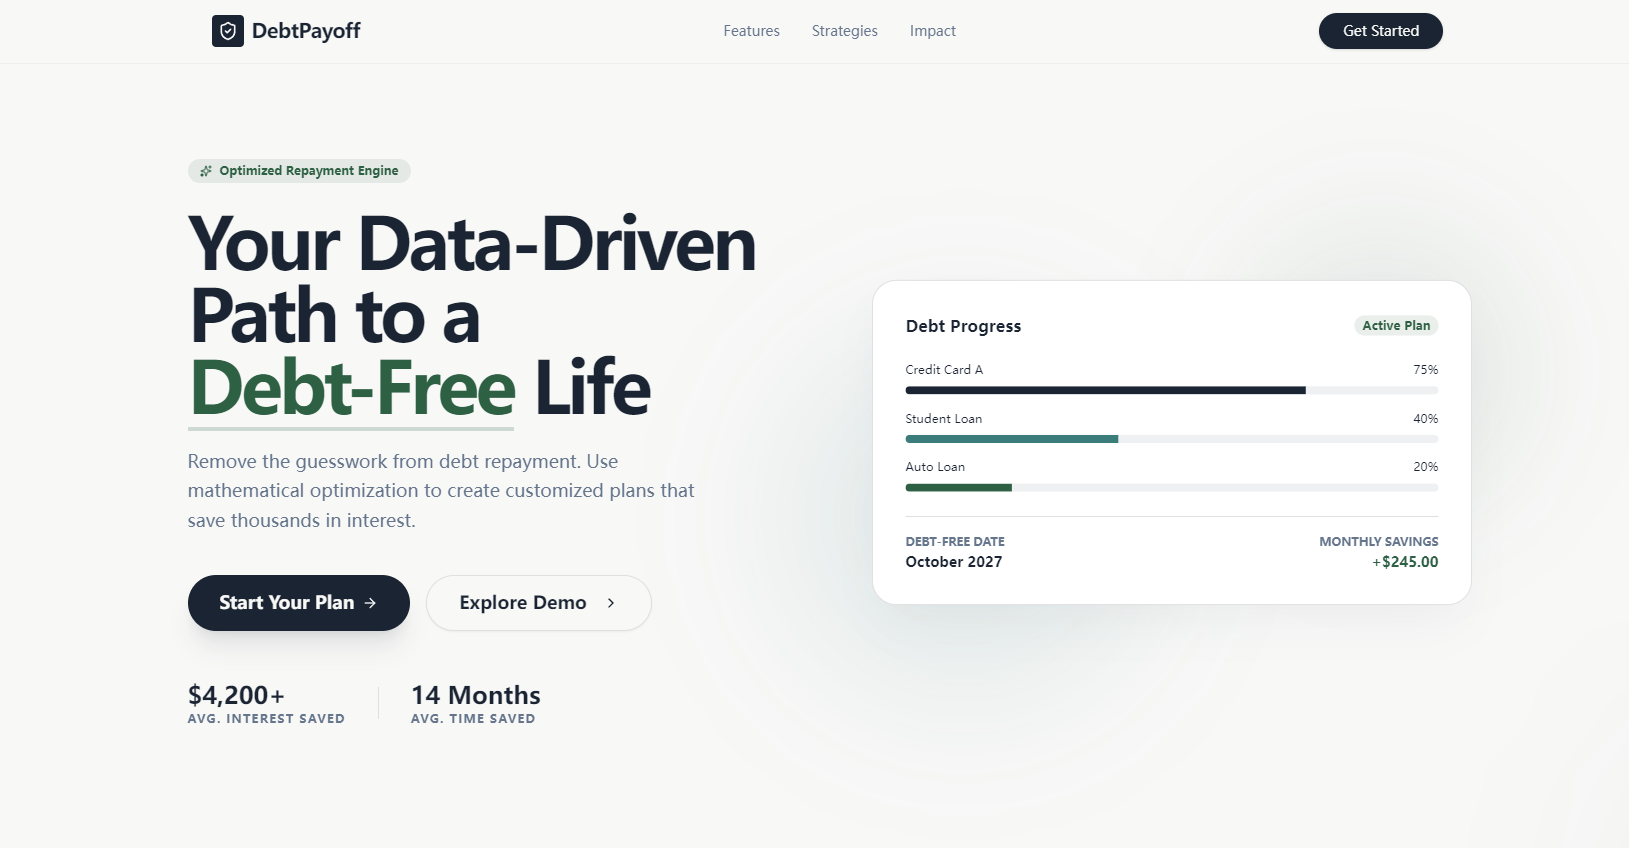
DebtPayoff Optimizer is a web app that demystifies debt repayment. It aggregates all your debts into a clear dashboard, compares Avalanche (highest APR first) and Snowball (smallest balance first) strategies side-by-side, generates monthly payment schedules, forecasts your exact debt-free date, and (for premium users) identifies balance transfer opportunities to cut high-APR costs. Every calculation is dynamic—adjust extra payments, and see instant updates to interest savings and timeline.
How we built it
We started with core financial logic: coding the Avalanche/Snowball algorithms using JavaScript, ensuring interest calculations followed the formula $Monthly Interest = (Current Balance × APR) / 12$. We built the frontend with React and Bootstrap for responsiveness, used D3.js and Chart.js for animated visualizations (donut charts for debt breakdown, bar charts for method comparisons), and hosted the app on Vercel with AWS for backend data handling. The UI was designed in Figma to prioritize clarity, with color-coded APR indicators and smooth animations to make complex data approachable.
Challenges we ran into
The biggest hurdle was ensuring mathematical accuracy—even small errors in interest/principal calculations would undermine trust. We spent weeks validating against manual financial calculations and edge cases (0% APR debts, extra payments exceeding total debt). Animation performance was another challenge: balancing engaging visuals (countdown timers, progress bars) with smooth load times required optimizing D3.js renders and adding graceful degradation for low-performance devices.
Accomplishments that we're proud of
We created a tool that turns overwhelming debt data into actionable, easy-to-understand plans. Users can see exactly how much to pay each month, which debt to prioritize, and the tangible impact of extra payments—down to the exact debt-free date. The animated visualizations make financial progress feel tangible, and the side-by-side method comparison empowers users to make informed choices, not just follow generic advice.
What we learned
Beyond technical skills (mastering financial algorithm logic, D3.js optimization), we learned the importance of user-centric design for financial tools. Complex math needs to be translated into intuitive visuals—users don’t care about the formula, they care about "how much will I save?" and "when will I be debt-free?". We also gained insight into the emotional side of debt: small wins (like milestone animations for 25% debt elimination) make the journey feel achievable.
What's next for this project
First, we’ll add manual debt entry (currently demo-focused) so users can input their real debts. Next, we’ll expand premium features: debt consolidation recommendations, credit score impact analysis, and PDF exports of payment plans. We also plan to add mobile optimization (beyond responsive design) and integrate bank account sync (with user consent) for automatic debt balance updates. Long-term, we want to add community features—success stories and progress tracking—to keep users motivated on their debt-free journey.

Log in or sign up for Devpost to join the conversation.