-
-

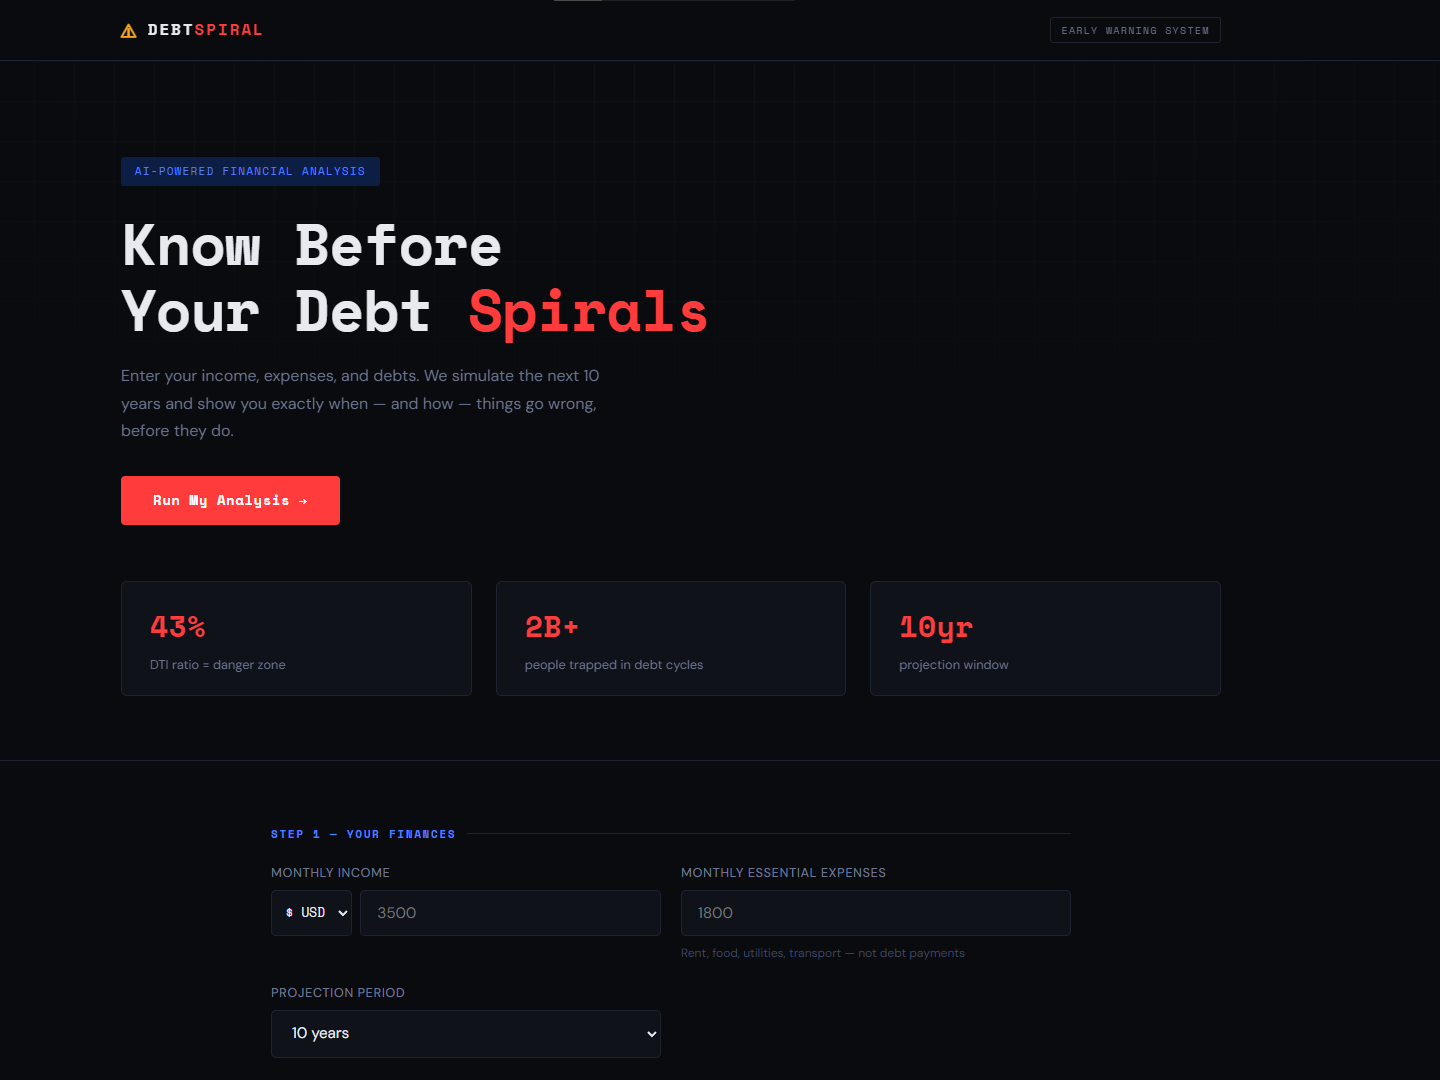
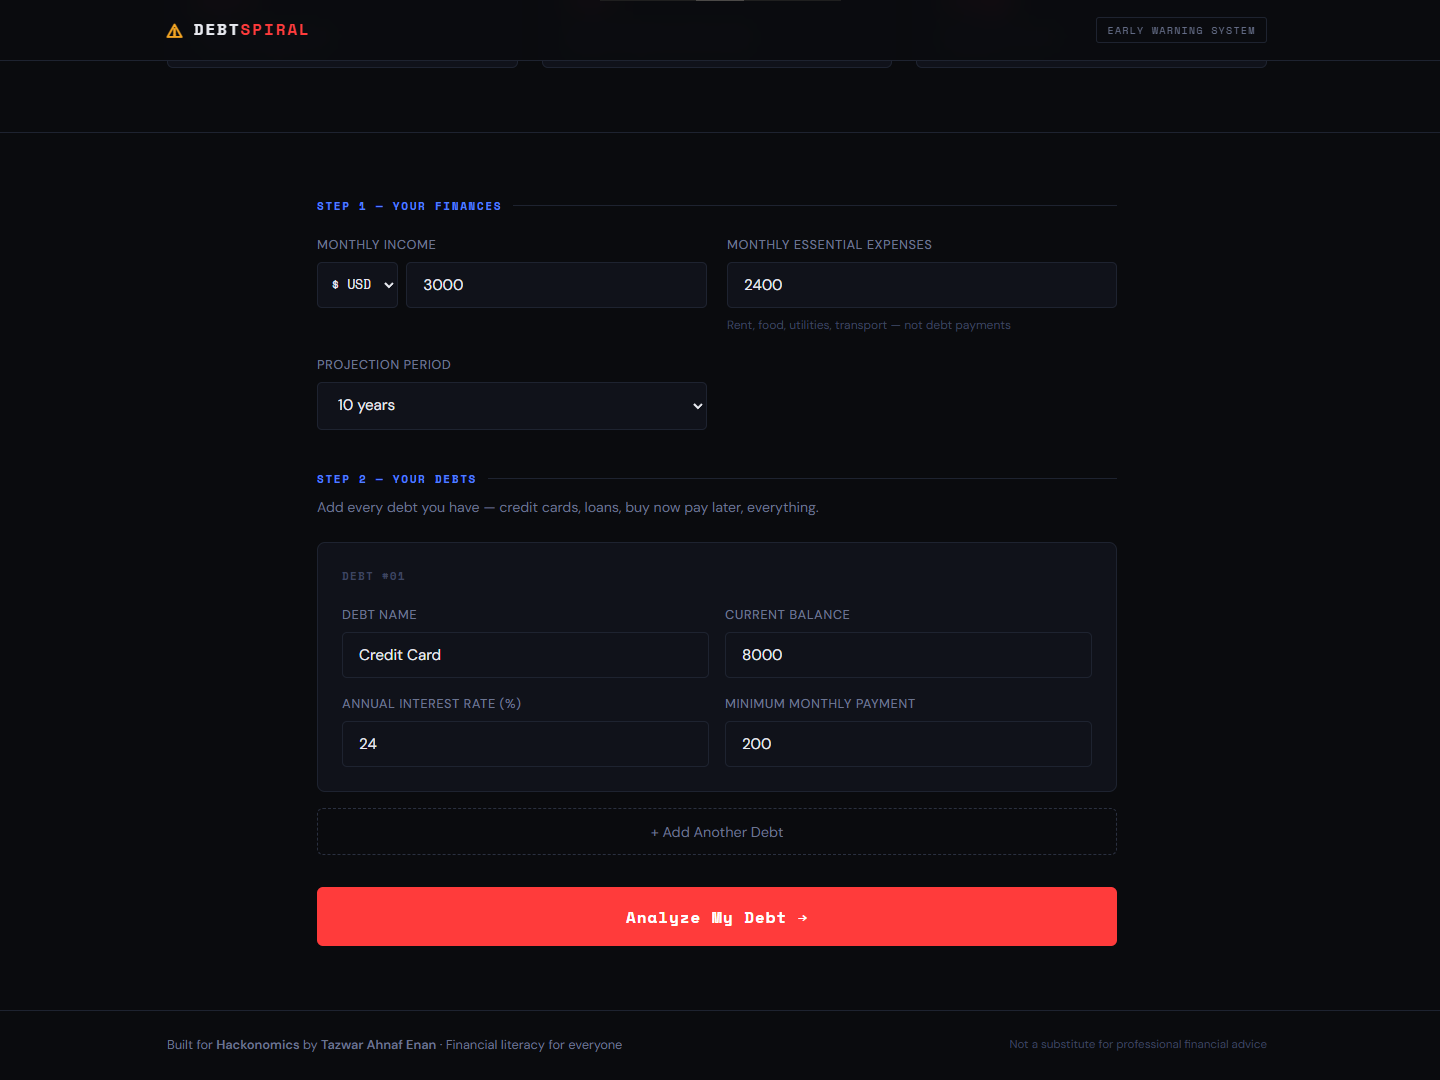
The landing page- clean entry point with key stats
-
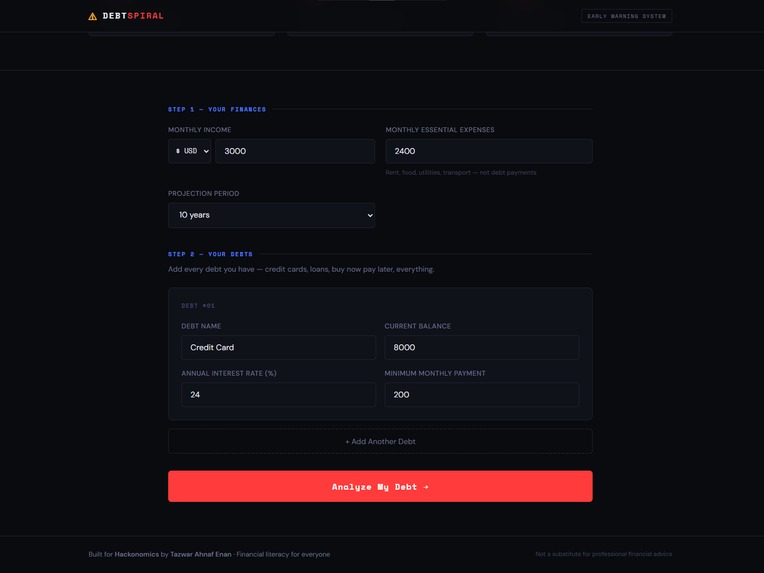
Step 1 & 2 - entering income, expenses, and debt details
-
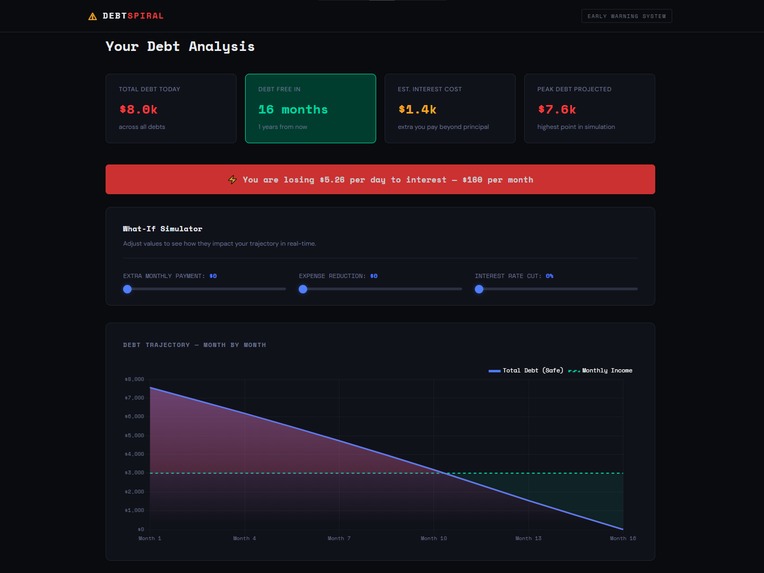
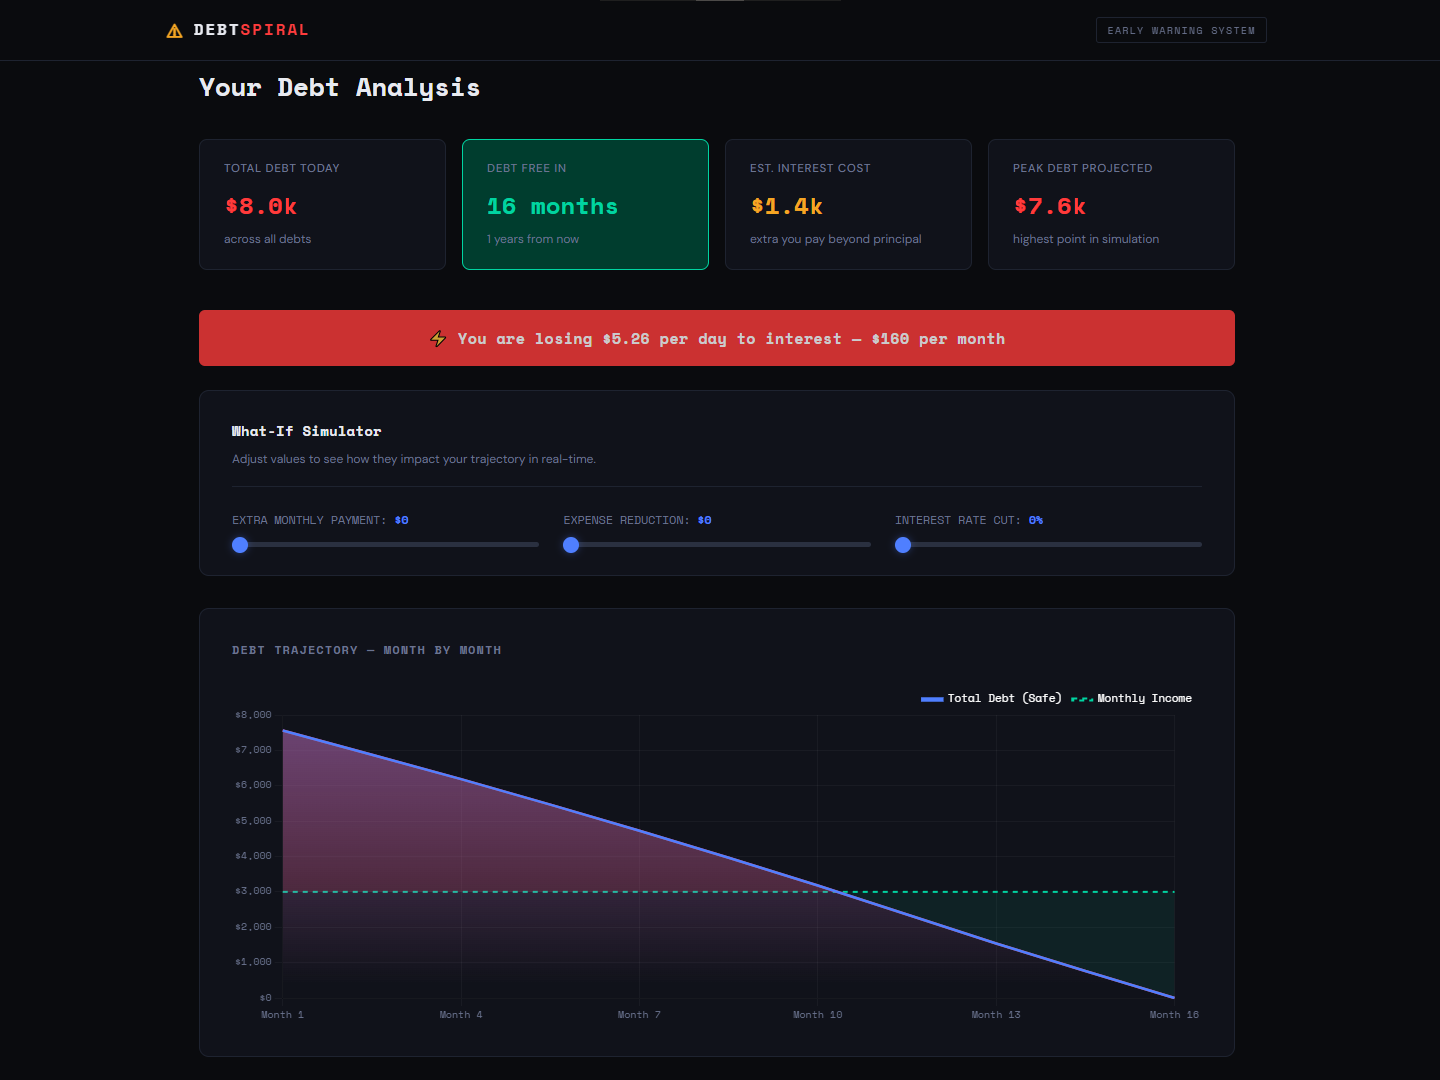
Debt trajectory chart with the Point of No Return annotation and Emergency Landing Mode
-
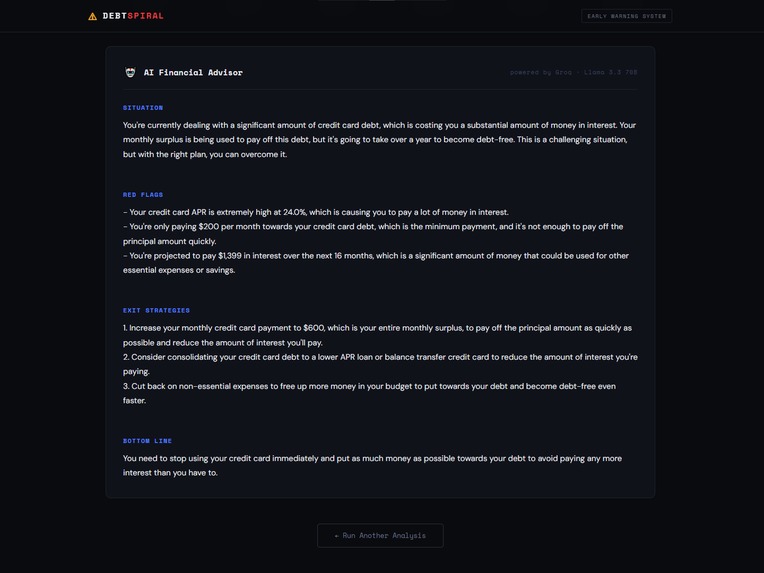
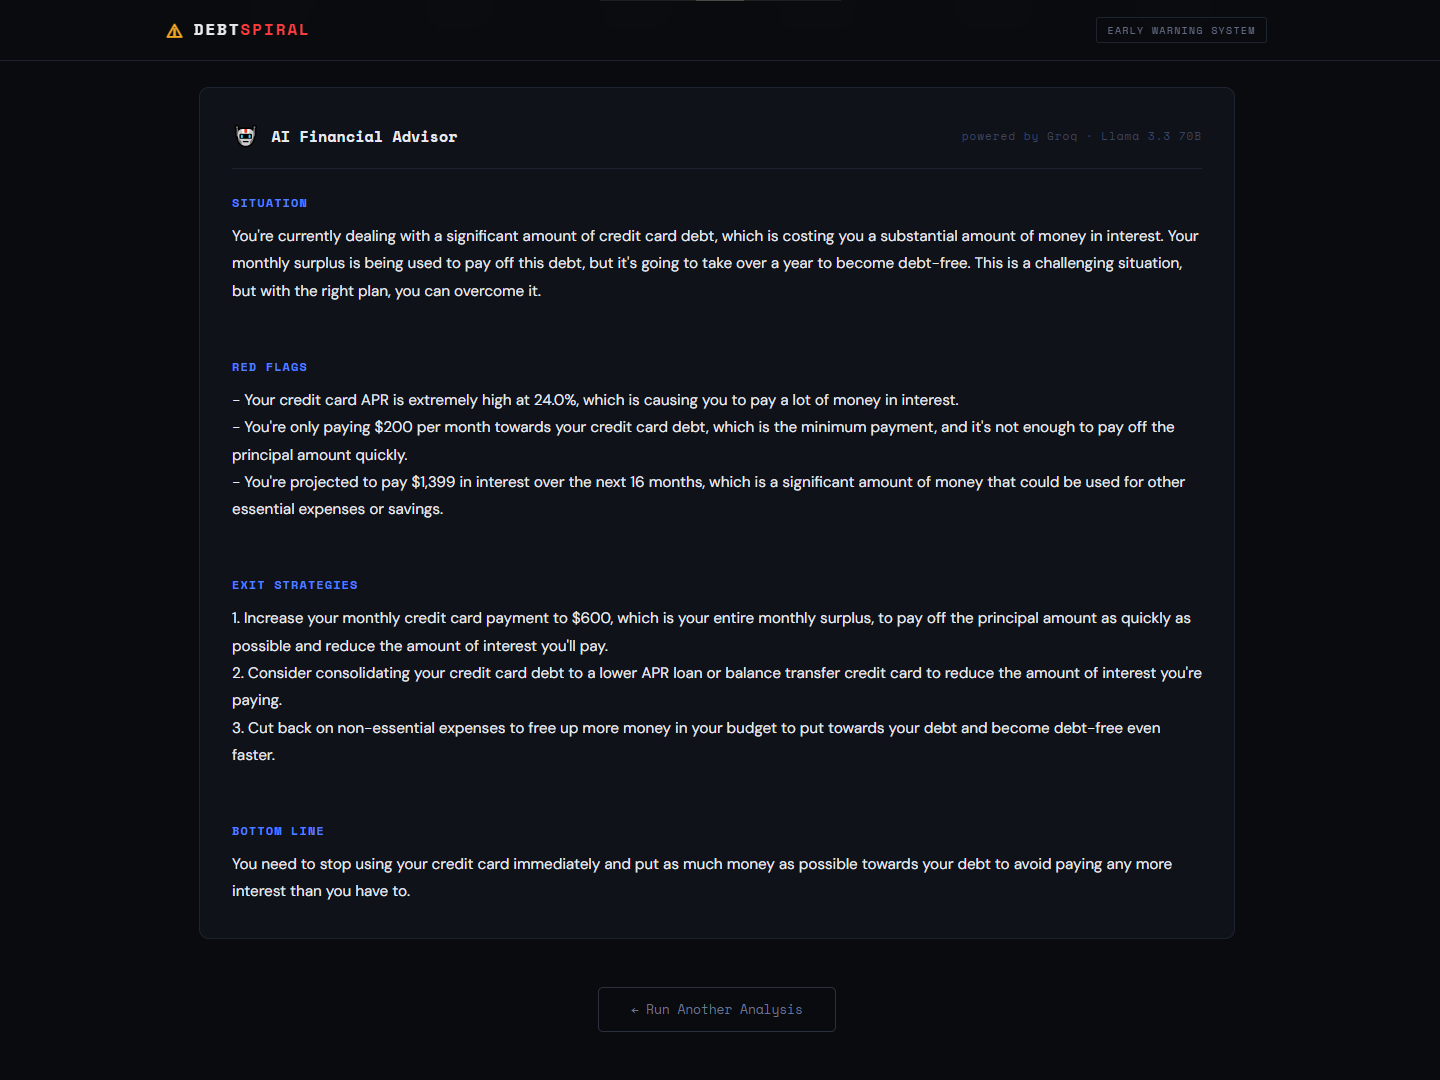
Groq-powered AI advisor generating a personalized recovery plan
Inspiration
I kept seeing people around me, family, friends slowly drowning in debt without realizing it. They weren't reckless spenders. They just had no way to see where things were heading until it was too late. Banks don't warn you. Nothing tells you "in 8 months you won't be able to recover from this." I wanted to build that tool.
What it does
Debt Spiral takes your income, expenses, and debts, then simulates your financial situation month by month for up to 20 years. It finds the exact month your debt becomes unrecoverable and shows it on a chart with a clear danger zone. A Groq-powered AI then gives you a personalized recovery plan with real steps. There's also a What-If simulator where you drag sliders to see how an extra $100/month physically moves your danger point further away.
How I built it
FastAPI backend with a custom debt simulation engine using the Avalanche repayment method. The AI layer calls Groq's Llama 3.3 70B with the simulation results and returns a plain-English breakdown. Frontend is Vanilla JS with Chart.js for visualization. Deployed on Render.
Challenges I ran into
The interest calculation had a bug giving wildly inaccurate numbers. Also hit Python 3.14 compatibility issues on Render with pydantic-core that took a few deploys to fix.
Accomplishments that I am proud of
The What-If simulator runs entirely in the frontend with no extra API calls. Drag a slider and the chart updates instantly. Also proud of the Emergency Landing Mode where the entire UI shifts into a red alert state when your finances enter the danger zone.
What I learned
How to properly model compound interest in code and the real meaning behind the 43% DTI threshold that lenders use to determine if someone is over-leveraged.
What's next for Debt Spiral
Bank statement PDF upload so users don't have to enter debts manually. And real local data by city and country so the advice is relevant to where you actually live.


Log in or sign up for Devpost to join the conversation.