-
-
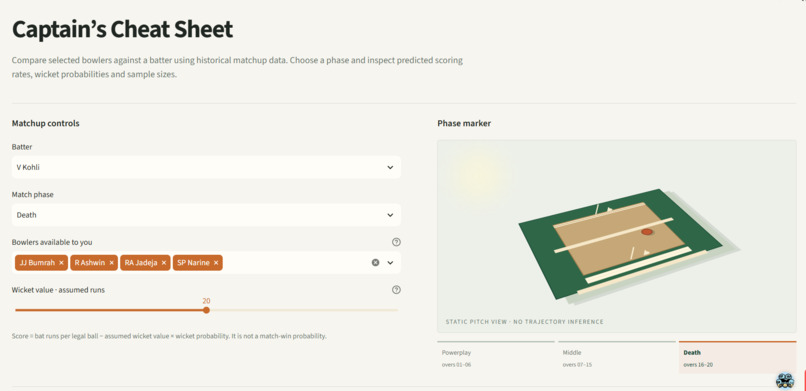
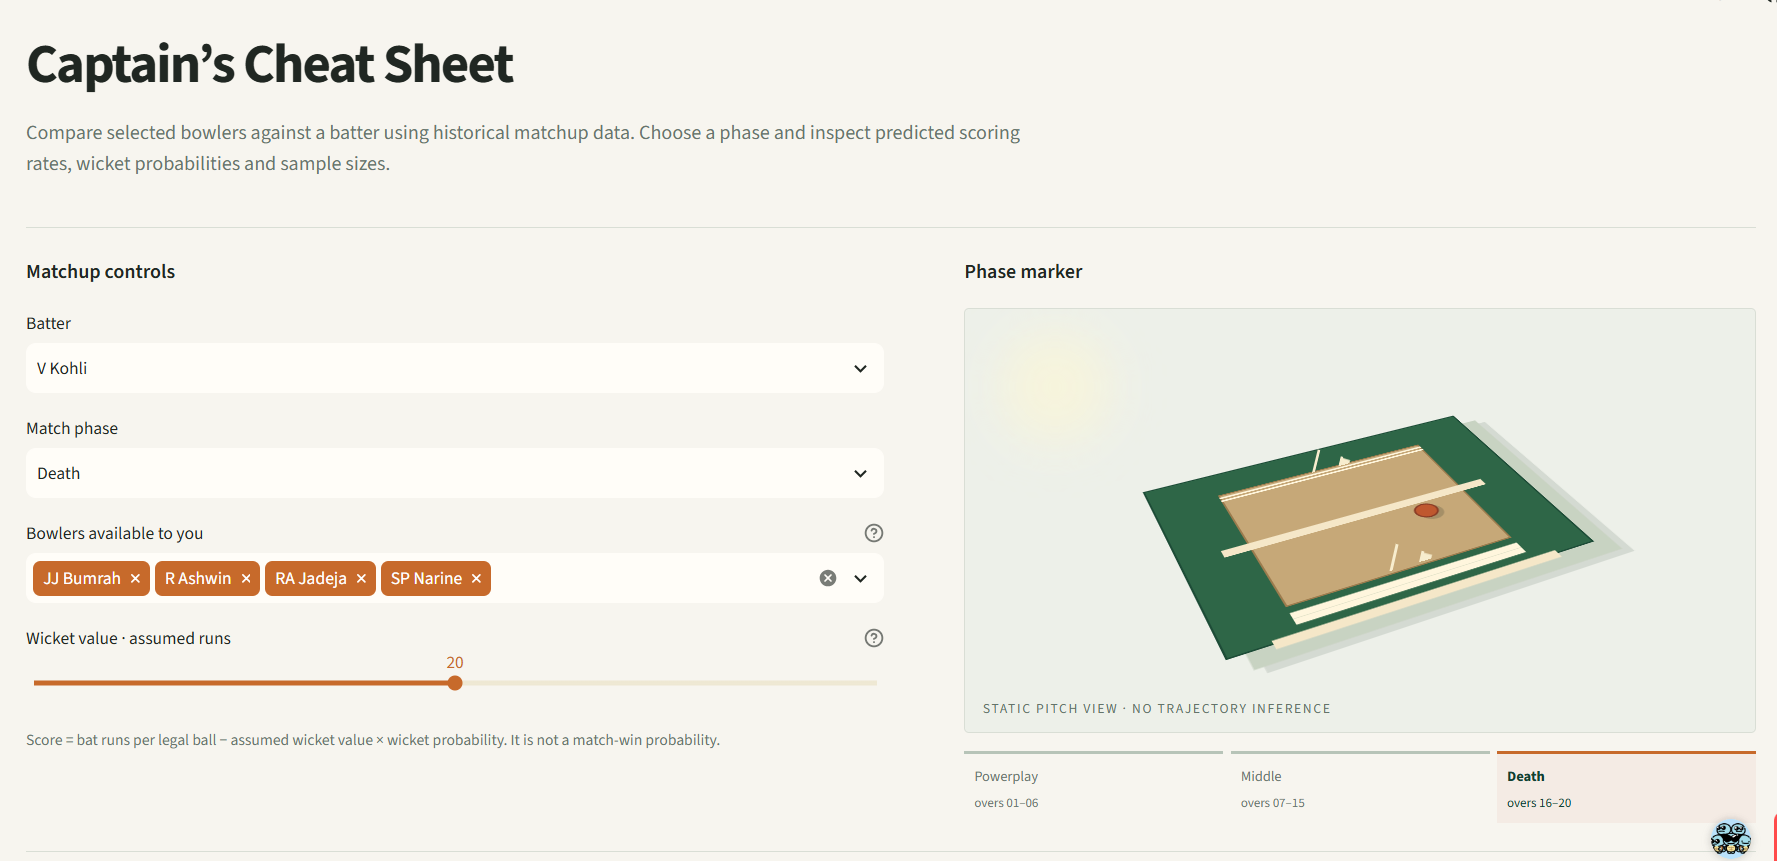
Select a batter, phase and available bowlers; adjust wicket value and compare historical recommendations beside a 3D pitch
-
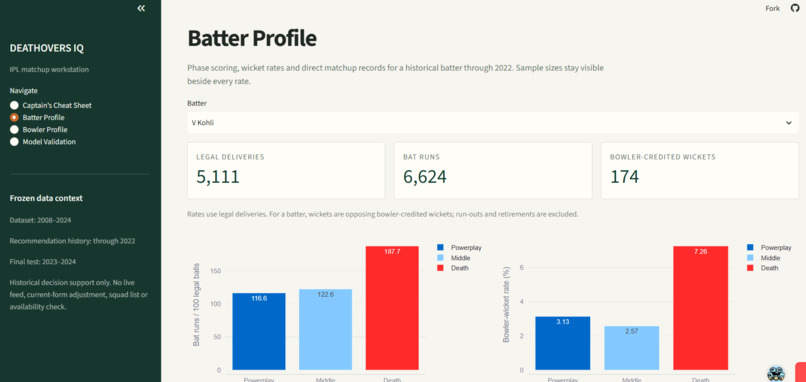
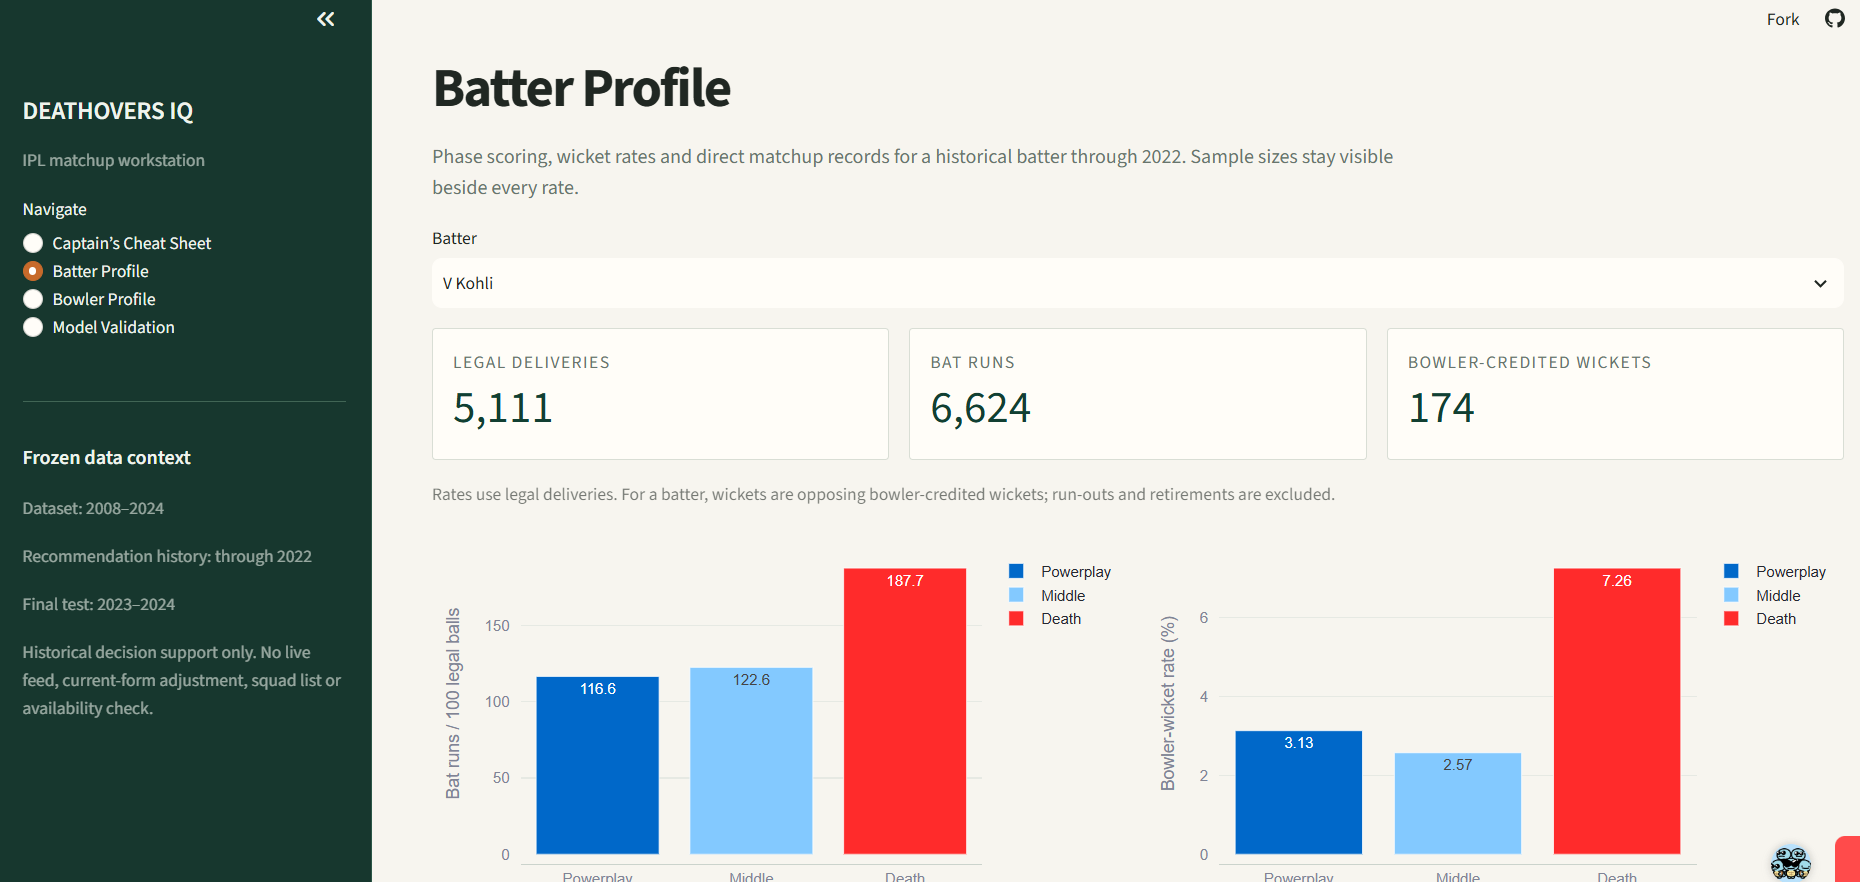
Explore batter scoring and wicket rates across Powerplay, Middle and Death overs, with sample sizes and direct matchup records
-
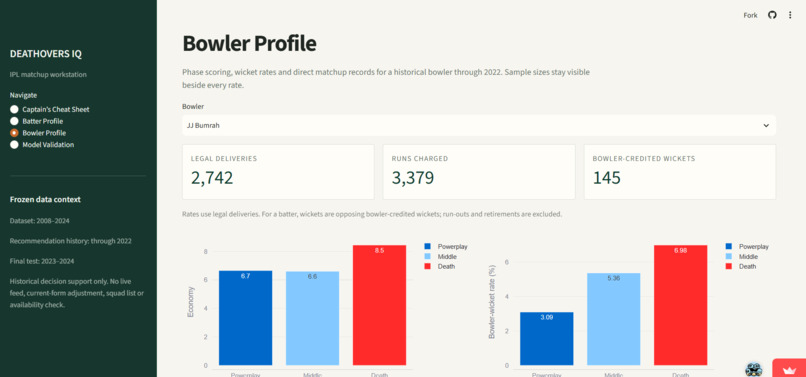
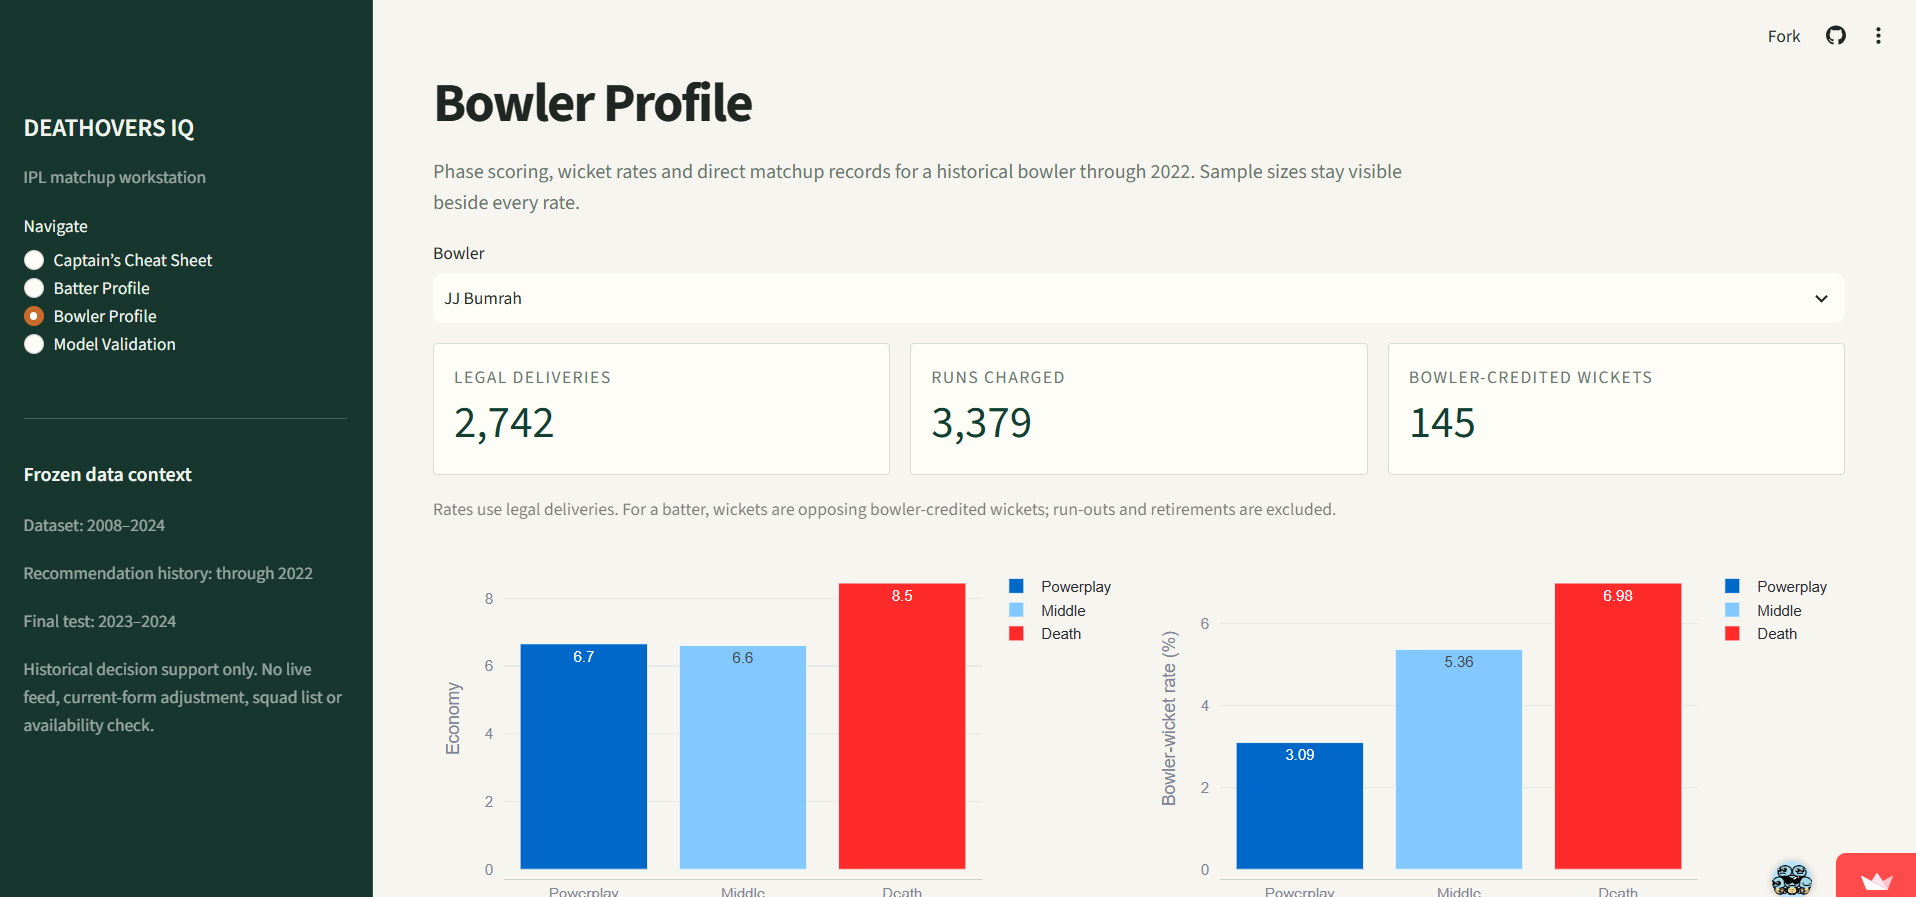
Inspect bowling economy, wickets and phase performance, then explore opponent records with historical sample sizes
-
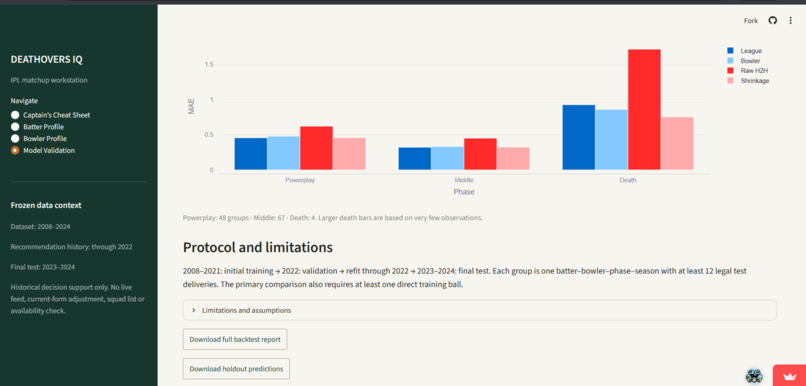
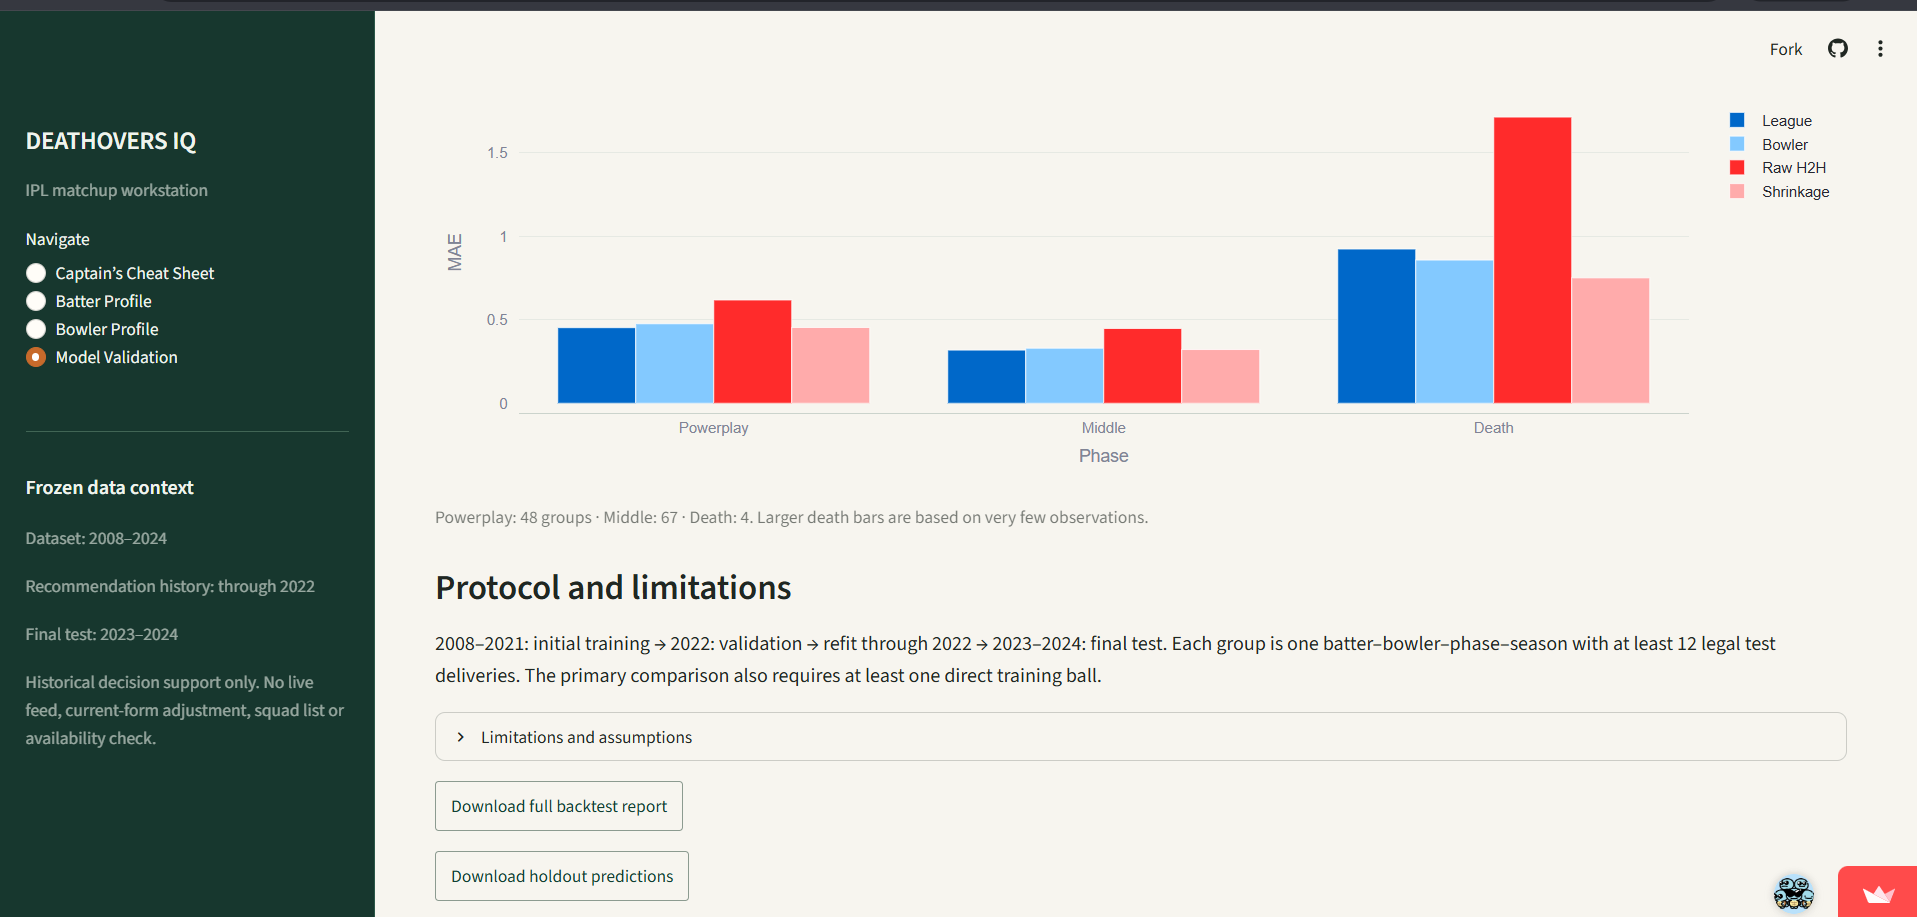
Compare held-out prediction errors against simple baselines, inspect phase results and review the limited death-over evidence
-
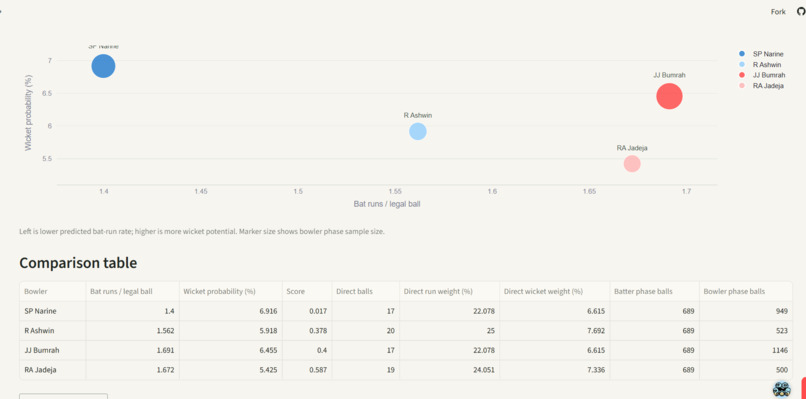
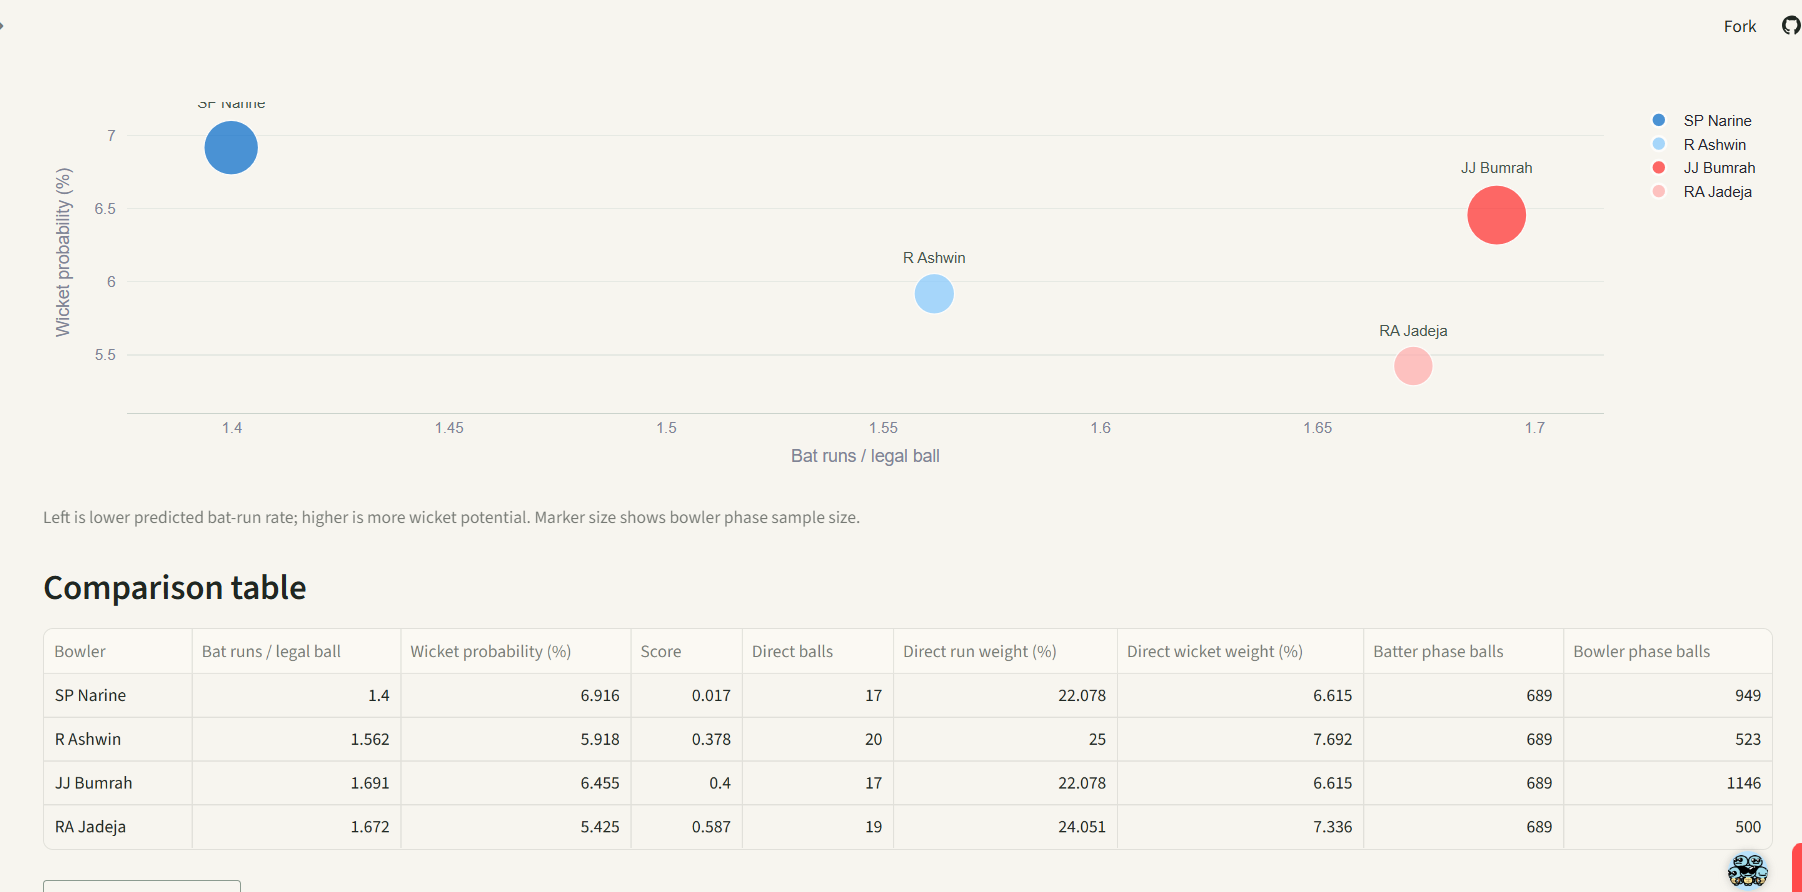
Compare predicted scoring rates and wicket probabilities, inspect sample sizes and download the detailed bowling shortlist
Inspiration
A batter scoring heavily against a bowler across ten deliveries does not necessarily establish a reliable matchup advantage. Small head-to-head samples can make uncertain patterns look convincing.
I built DeathOvers IQ to explore how historical IPL data can support bowling comparisons while showing the evidence behind each estimate.
What it does
DeathOvers IQ is an interactive historical IPL matchup dashboard for captains, analysts and cricket enthusiasts.
The Captain’s Cheat Sheet compares selected bowlers against a batter across Powerplay, Middle and Death overs. It displays predicted bat runs per legal delivery, bowler-credited wicket probabilities, direct matchup sample sizes and rankings under an adjustable wicket-value assumption.
Batter and Bowler Profile pages provide historical performance breakdowns. A Model Validation page presents baseline comparisons, limitations and downloadable predictions.
Its practical purpose is to help users build a historical bowling shortlist while recognising when matchup evidence is limited.
For example, an analyst preparing a historical matchup review can select a batter, choose a phase and compare available bowling options. The dashboard shows the trade-off between suppressing scoring and taking wickets, alongside the sample behind each estimate. It supports a shortlist for further review rather than establishing the best live-match decision.
How I built it
I used Python, pandas and SQLite to organise 1,095 matches and 260,920 recorded deliveries from IPL 2008–2024 into linked tables and season-specific summaries.
During data preparation, I identified legal deliveries, excluded run-outs from bowler wickets and separated Super Overs from standard innings.
I implemented a shrinkage model that blends phase-specific player profiles with direct head-to-head history. Smaller matchup samples receive less weight.
I selected settings using 2022 after initial training on 2008–2021. I then refitted the model through 2022 and tested it on 2023–2024, with training frozen across both test seasons.
I built the interface using Streamlit and Plotly, with comparison charts, CSV downloads and an isometric cricket pitch as a visual phase marker. I deployed the application on Streamlit Community Cloud.
The data comes from Prateek Bhardwaj’s IPL Complete Dataset on Kaggle, which acknowledges Cricsheet as its source.
Challenges I ran into
Cricket-specific details required careful handling: wides and no-balls, non-bowler dismissals, phase boundaries and Super Overs all affect the statistics.
Another challenge was preventing future-season information from entering training and ensuring all baselines were compared on identical test groups.
During deployment, I resolved Python dependency conflicts and ensured the database and evaluation downloads were included in the public repository.
Accomplishments that I'm proud of
I connected data preparation, SQL storage, modelling, held-out evaluation and an interactive dashboard in one working application.
On 119 held-out matchup–phase–season groups with prior direct history, shrinkage achieved a run-rate MAE of 0.3894, compared with 0.5591 for raw head-to-head, 0.4064 for the bowler baseline and 0.3928 for the league phase average.
That represents a 30.35% MAE reduction versus raw head-to-head and 4.19% versus the bowler baseline, but only 0.87% versus the league average.
I made this modest improvement over the simplest baseline visible in the dashboard. Only four death-phase groups qualified for the comparison, so death-specific predictive strength is not established.
What I learned
I learned that simple baselines are essential. More detailed player and matchup information does not automatically produce substantially better predictions.
The strongest measured benefit was stabilising raw head-to-head estimates. I also learned that sample sizes and limitations need to appear alongside recommendations so users can interpret them responsibly.
The wicket-value control demonstrates how assumptions can change rankings; it does not establish which choice wins matches.
In plain language, the model predicted historical scoring rates more accurately than raw head-to-head records, but performed almost the same as simply using the league’s average for that phase. This shows why small matchup samples need caution—and why a more complex model must earn its place against simple alternatives.
What's next for DeathOvers IQ
I plan to investigate recency weighting, handedness and venue context using additional chronological validation. More death-phase evidence is needed before making stronger claims about that phase.
My other priorities include uncertainty estimates and evaluating the ranking rule itself. The current application remains historical decision support, without live feeds, current squad availability or validated match-winning recommendations.


Log in or sign up for Devpost to join the conversation.