-
-
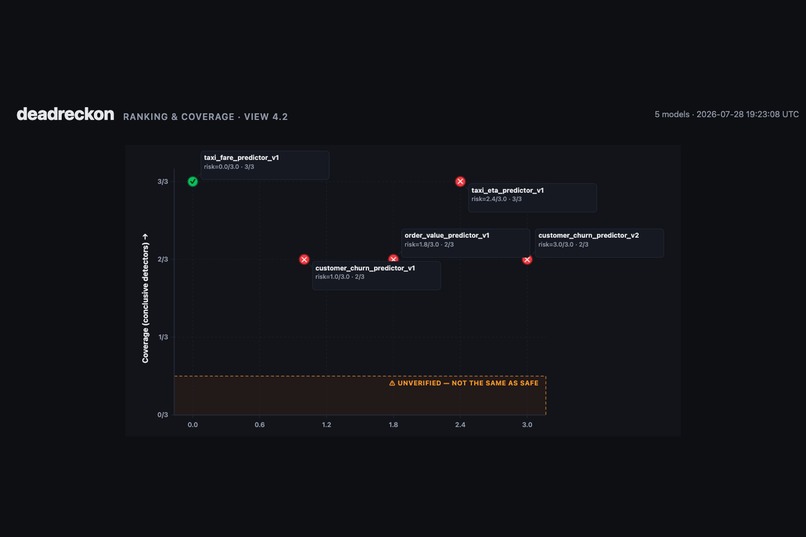
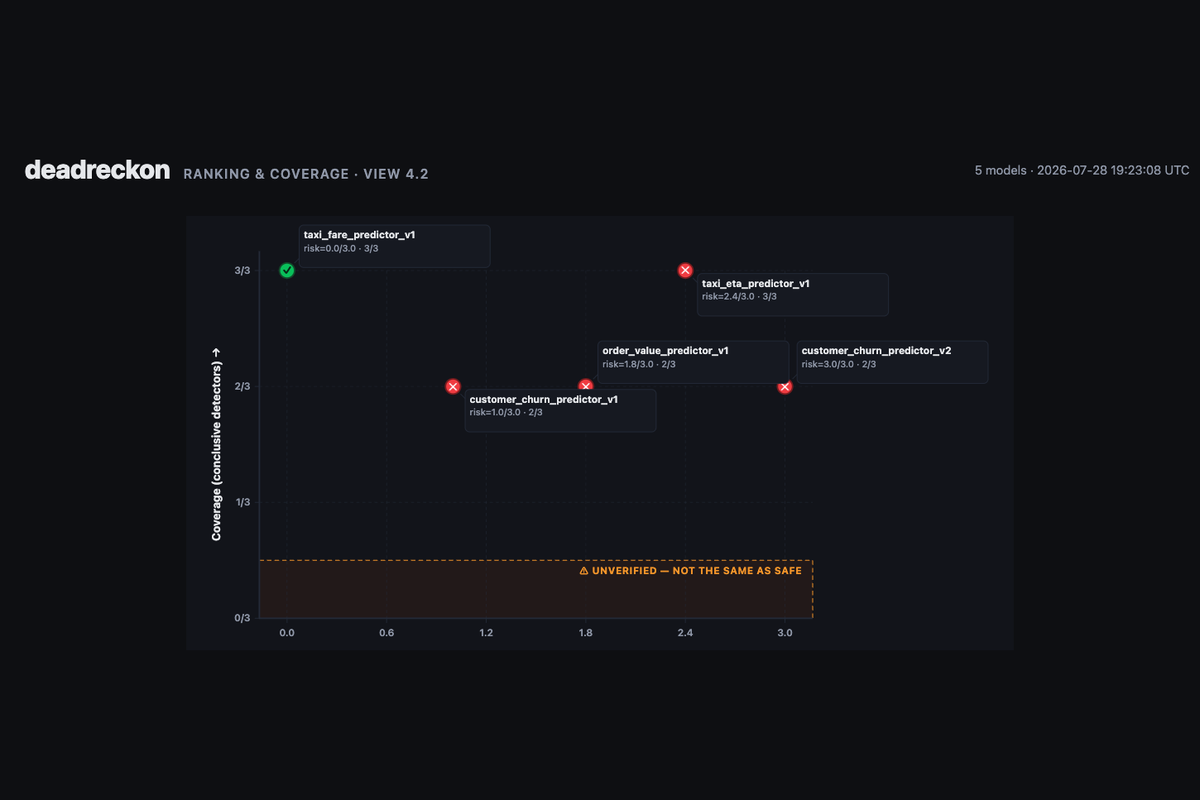
Risk and coverage as two independent axes — the "unverified" band is not the same as safe.
-
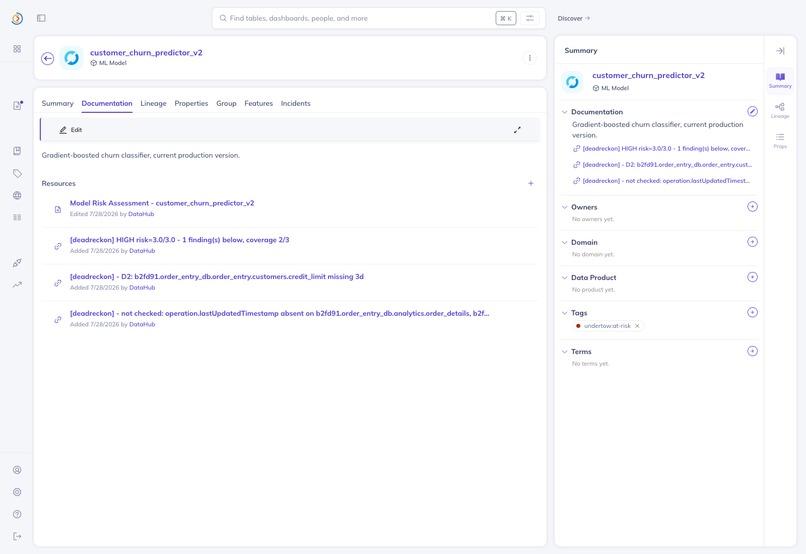
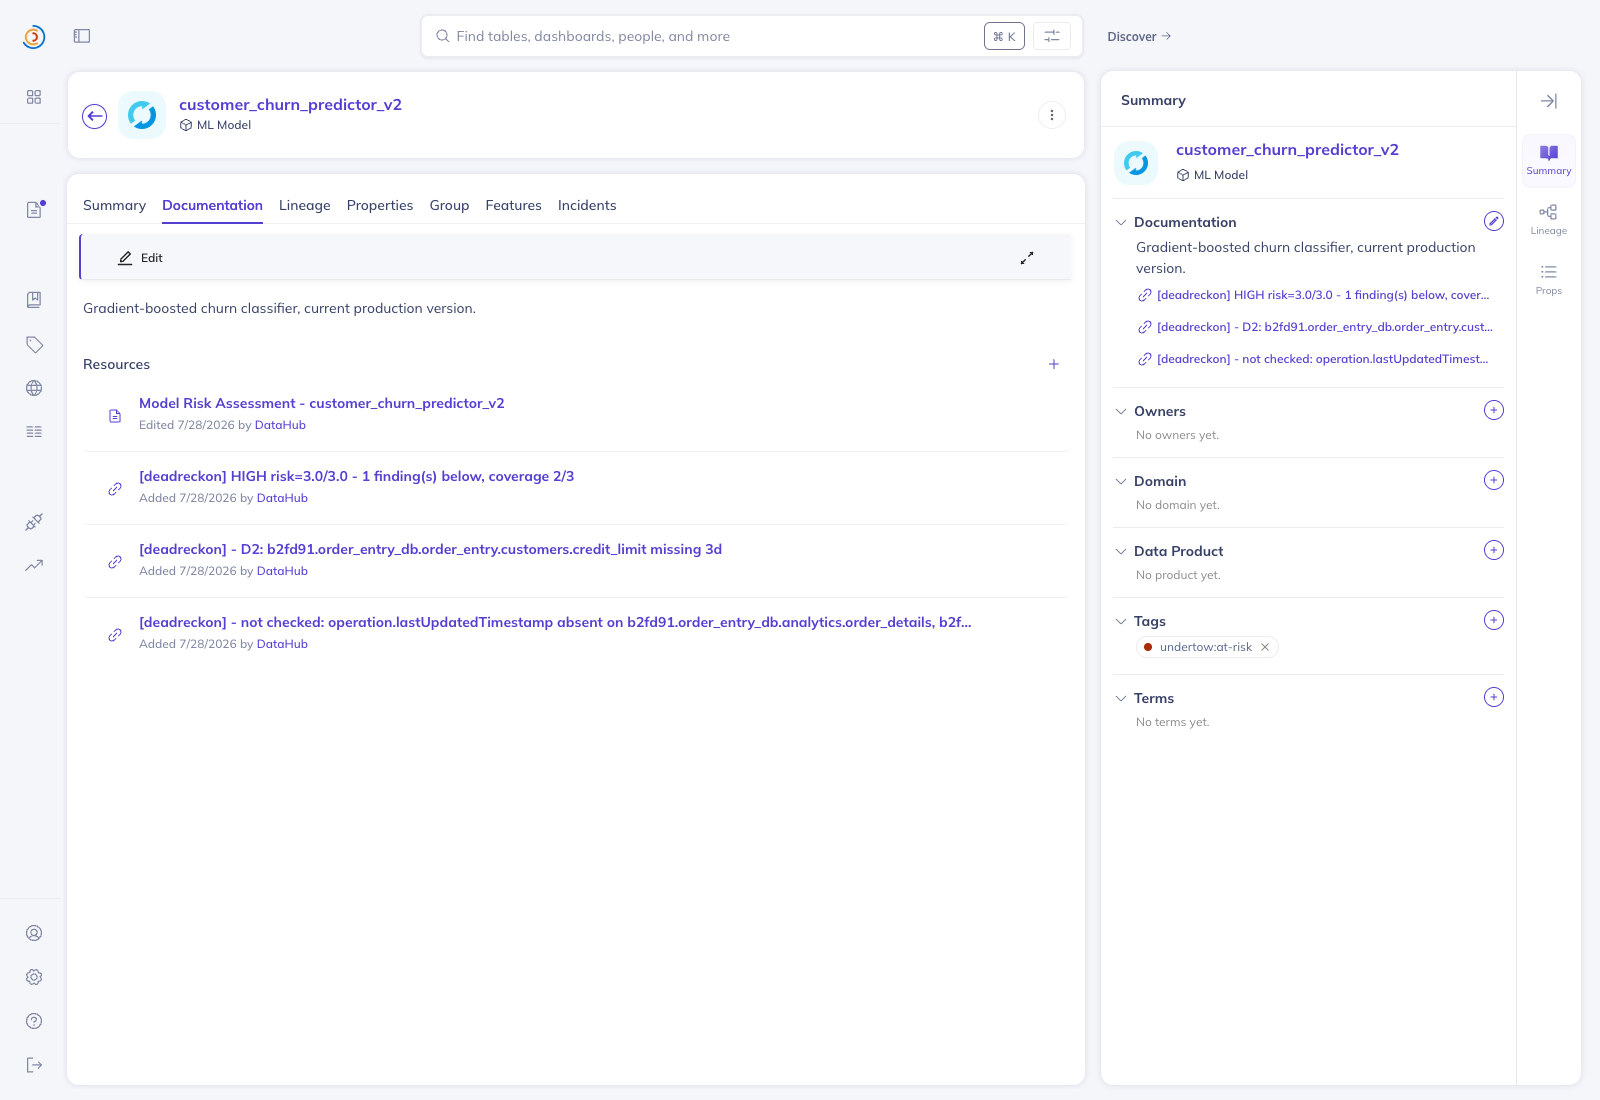
Per-finding [deadreckon] notes on the model's own Documentation tab — including what could not be checked, not just what was found.
-
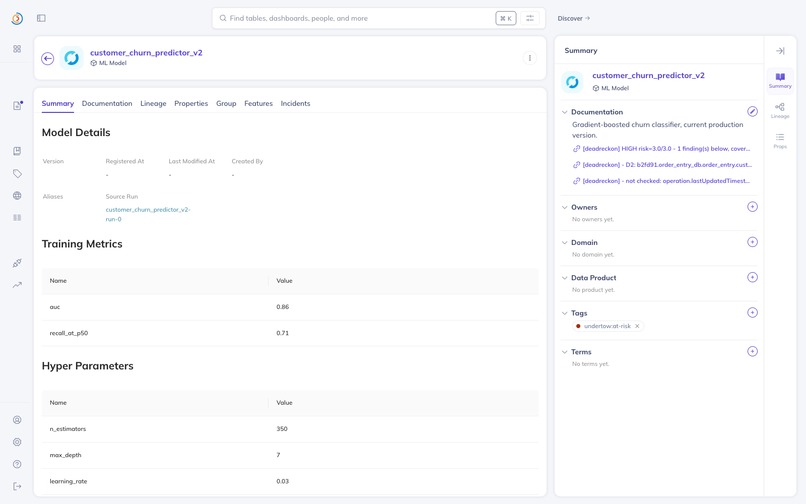
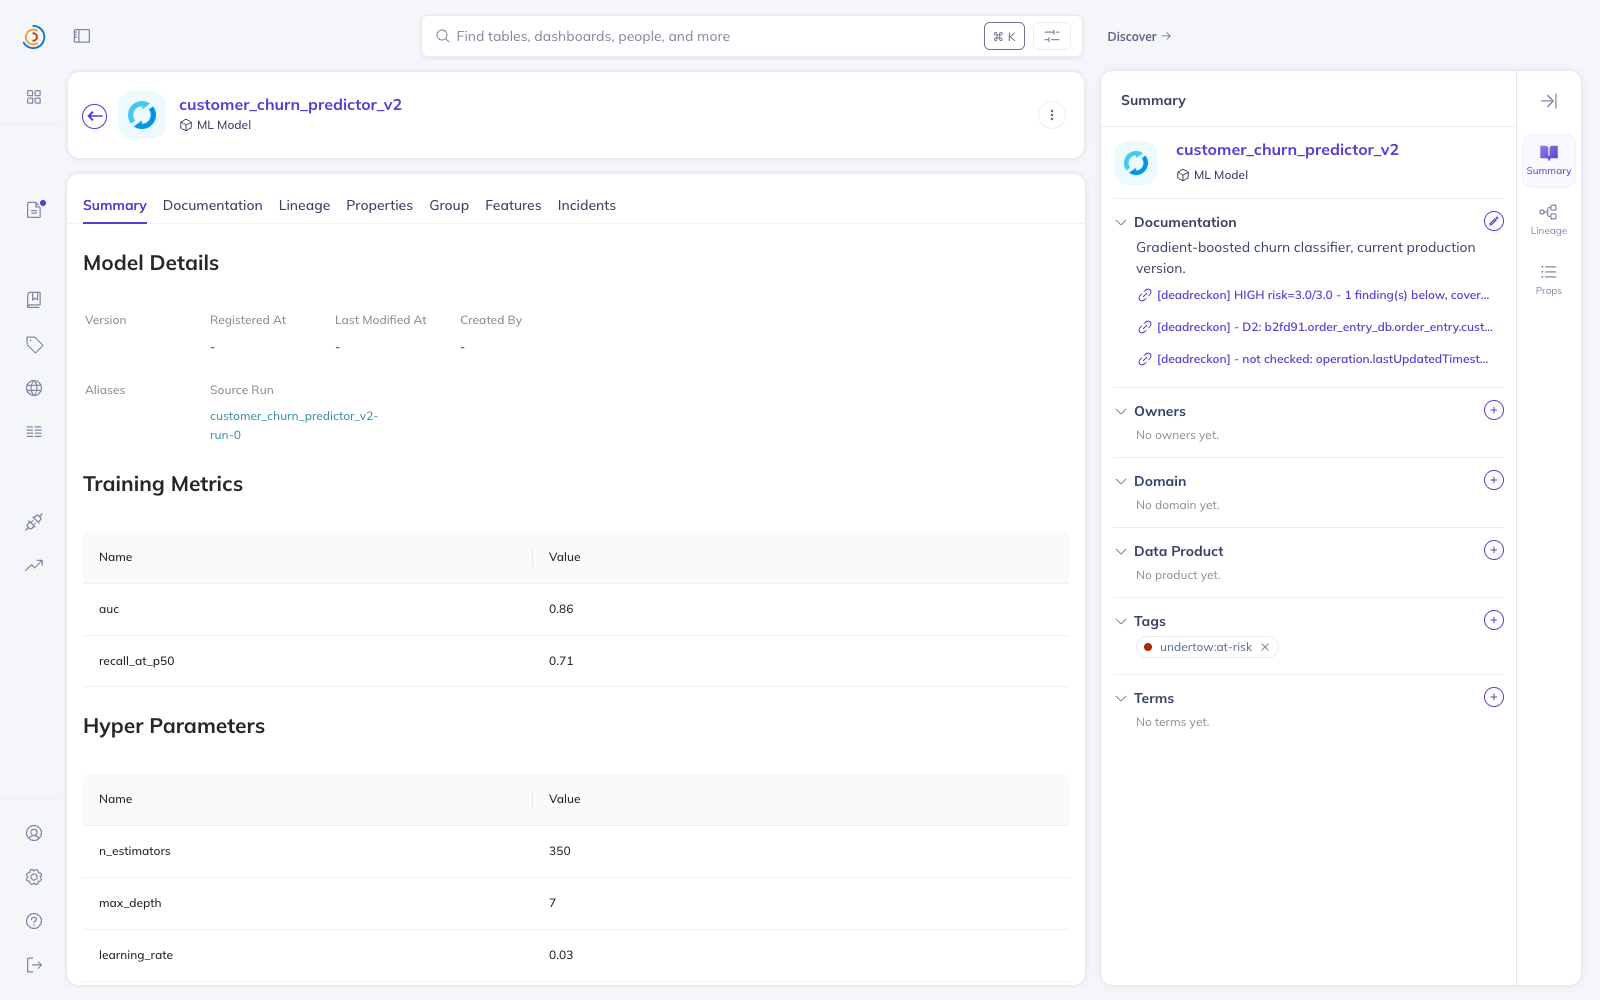
Writeback in a live DataHub: the undertow:at-risk tag applied to customer_churn_predictor_v2 by an actual agent run.
The problem
Production ML models rarely fail loudly. A serving metric still looks normal, a pipeline still runs on schedule — while four hops upstream in the data chain, a column got renamed, a table stopped refreshing, or a transformation's logic changed underneath the feature a model was trained on. ML monitoring and data monitoring are usually two separate systems, and the silence between them is where the money goes missing: nobody connects the table, the feature, the training run, and the deployed endpoint, because no single system owns that whole chain.
What it does
deadreckon walks a model's full lineage in DataHub — dataset → feature → training run → model → deployment — using metadata only: no model runtime, no serving access, no drift computed on live predictions. Three detectors each look for a distinct class of silent failure:
- D1 — Frozen training source: an upstream dataset stopped receiving real updates, but training keeps firing on schedule anyway.
- D2 — Schema drift under a feature: a feature's source column disappeared from the schema after the model's last training run — serving now reads nulls.
- D3 — Semantic change without retrain: an upstream transformation's logic changed after the last training run — same schema, different meaning.
Every detector reaches one of three states — PASS, FINDING, or INSUFFICIENT_DATA — not a binary pass/fail. "Checked and clean" and "had nothing to check with" are different claims, and a model's assessment coverage (how many detectors actually reached a verdict) is tracked as an independent signal alongside risk, never folded into it. A model can score 0.0 because it's genuinely clean, or 0.0 because nothing could be checked — coverage is the only thing that tells those two apart, and the dashboard makes that distinction impossible to miss.
Findings are scored (detector confidence × worst serving environment, i.e. blast radius), ranked, and written back into the DataHub graph next to the model they concern: an undertow:at-risk tag (gated on severity, removed automatically if the model recovers), a separate undertow:unassessable tag for models nothing could be checked on, four deadreckon.* structured properties, and per-finding notes on the model's own Documentation tab — including an explicit note for the fully-clean case and the fully-unassessable case, not just for findings.
A static dashboard (opens with a double-click, no server, no Docker) presents one completed run across four views: a model × detector risk matrix, a risk-vs-coverage plot with an explicit "unverified — not the same as safe" zone, a per-finding drill-down with detector-specific evidence and verified DataHub deep-links, and a narrow, annotated ignition subgraph showing exactly where and why a problem originated.
How it's built
- Python 3.10+, the datahub Python SDK and CLI, uv for dependency management.
- mcp-server-datahub for reading lineage (search, get_entities, get_lineage) from a Claude Code agent session; graph writeback goes through the same GraphQL mutations those tools wrap, called directly so the pipeline runs headlessly.
- DataHub Core, self-hosted via Docker quickstart.
- The dashboard is a single self-contained static HTML/CSS/vanilla-JS file — no build step, no framework, no backend — with a real sample run embedded directly in it. Built by Kimi K3 from a series of written briefs, reviewed and independently verified in a real browser before each was merged.
- pytest for detector/scoring unit tests, run against synthetic inputs so they don't require a live DataHub instance.
Data used
- showcase-ecommerce — the official DataHub demo datapack (Snowflake, dbt, Looker, Tableau; ~1049 entities), which deadreckon's ML lineage layer wires directly into.
- nyc-taxi — the community-shipped DataHub fixture (SQLite), which has a real freshness gap in its raw data that D1's frozen-source detector reads once that gap is made metadata-visible; nothing about that gap was fabricated for this project.
- A disclosed, deliberate fault injection for D2 and D3 (a real column rename, a real dbt view-logic edit) — necessary because verifying a detector against a failure mode requires a controlled instance of that failure, not a live incident that isn't reproducible on demand. Fully documented, timestamps and all, in NOTES.md.
- Two example run outputs (examples/sample-run.json, examples/sample-run-edge-cases.json) against a frozen, versioned JSON schema (docs/output-schema.md).
Open-source contributions
Filed upstream while building this, across both repos this project touches:
datahub-project/datahub:
- #18657 (https://github.com/datahub-project/datahub/issues/18657#issuecomment-5108977744) — root-caused a zombie-process leak in the quickstart's OpenSearch healthcheck that kills the container roughly once a day; shipped a fix as a Docker Compose overlay in this repo.
- #18675 (https://github.com/datahub-project/datahub/issues/18675#issuecomment-5108983658) — confirmed standalone Document entities have no working profile route anywhere in this DataHub version's frontend, which directly shaped how this project surfaces its own writeback (Documentation notes on the model itself, not a document link that 404s).
acryldata/mcp-server-datahub:
- #164 (https://github.com/acryldata/mcp-server-datahub/issues/164) — get_entities on an mlModel URN drops hyperParams, trainingMetrics, mlFeatures, groups, and trainingJobs.
- #165 (https://github.com/acryldata/mcp-server-datahub/issues/165) — same gap for mlFeature: get_entities returns only name/description, dropping sources, dataType, and customProperties.
- #166 (https://github.com/acryldata/mcp-server-datahub/issues/166) — dataProcessInstance (training runs) fares worst: get_entities returns the bare URN and nothing else, and get_lineage shows the same runs as timestamp-less stubs.
All three trace to the same missing-GraphQL-fragment mechanism (confirmed independently by another reporter for a different entity type, #157 — https://github.com/acryldata/mcp-server-datahub/issues/157) — and that's exactly why deadreckon's own ML lineage pipeline reads through the DataHub Python SDK/GraphQL directly rather than through these MCP tools, and writes every detector-relevant value back as a structured property instead of a native field. Not an arbitrary architecture choice — a direct consequence of what this MCP server version can and can't reliably project for ML entity types.


Log in or sign up for Devpost to join the conversation.