-
-
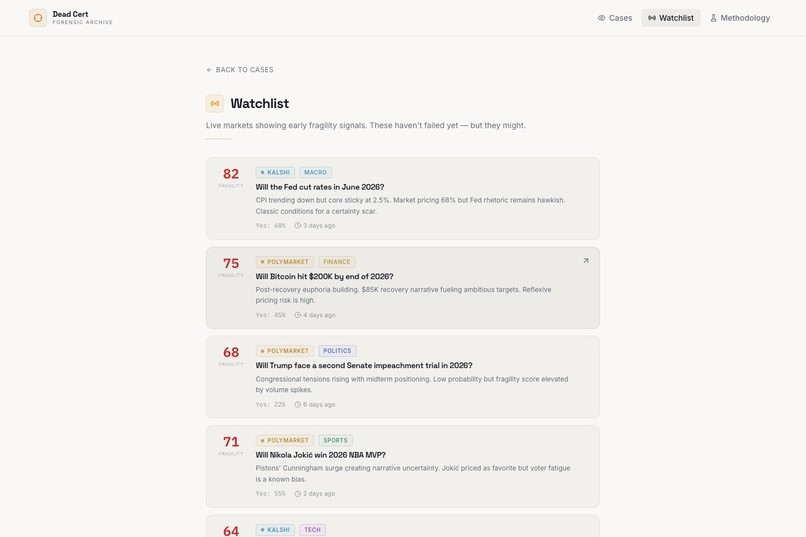
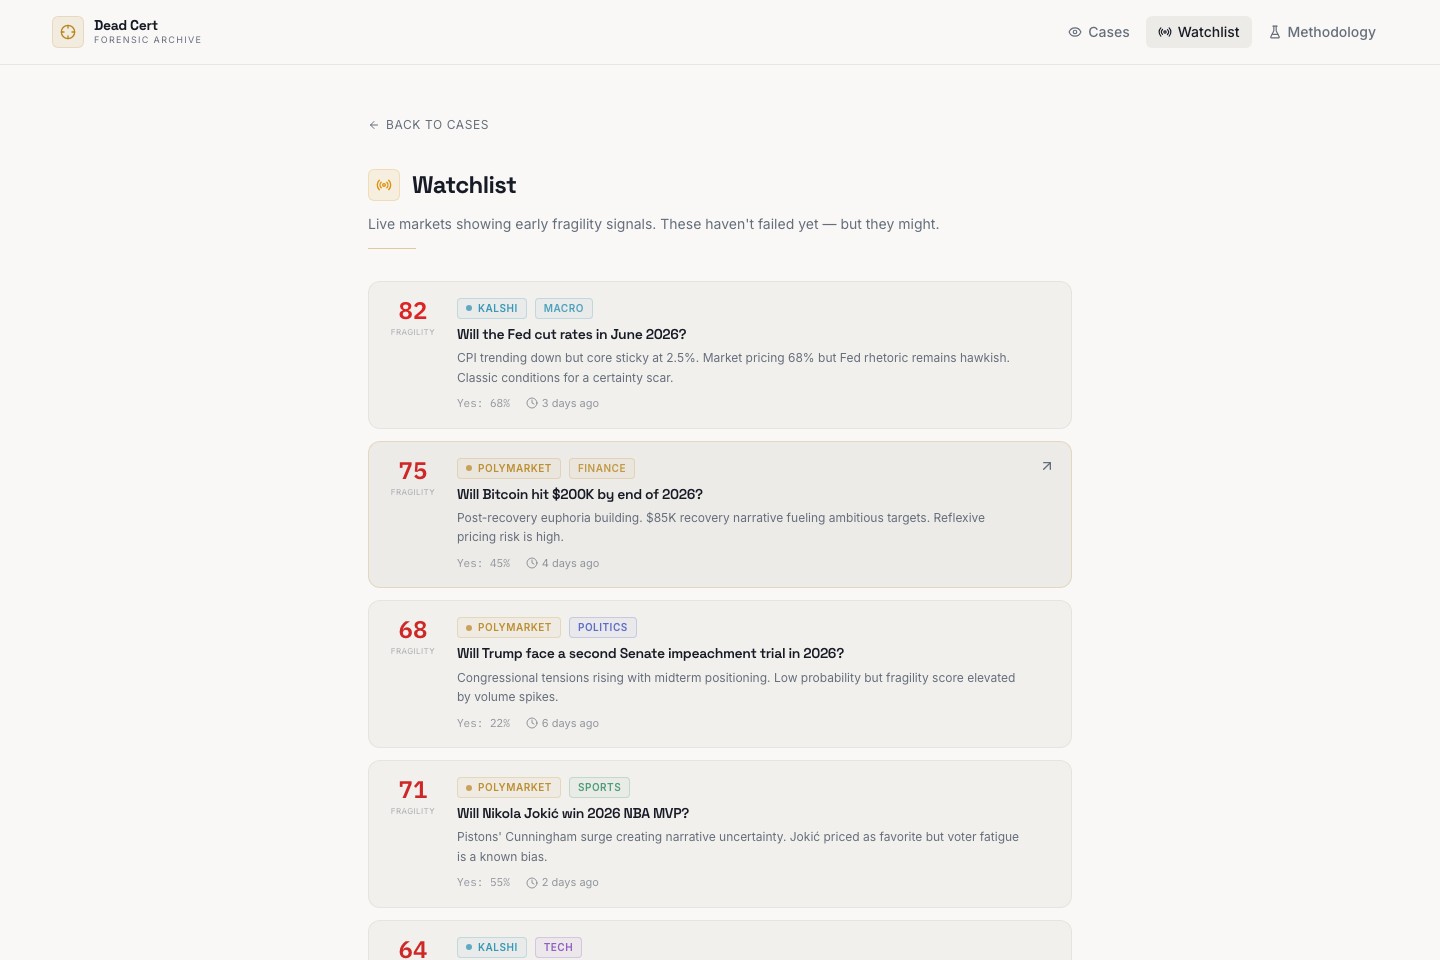
A deeper look at the watchlist reveals high-fragility markets across politics, sports, finance, and tech.
-
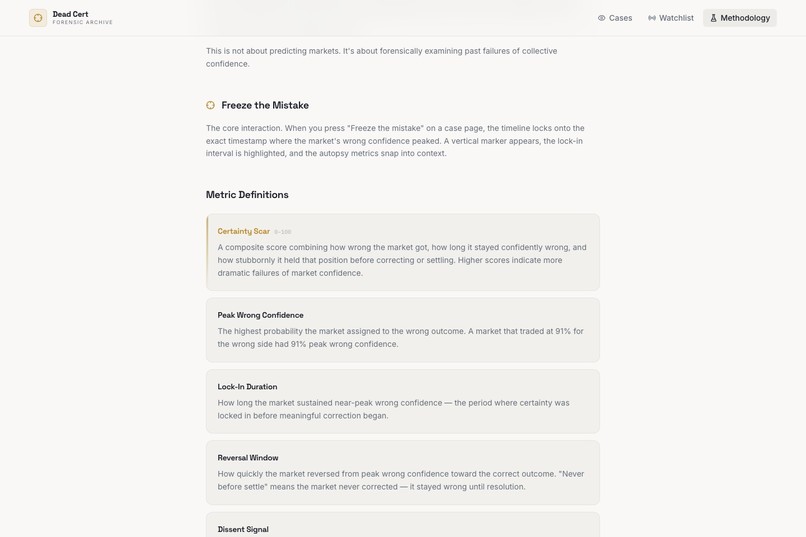
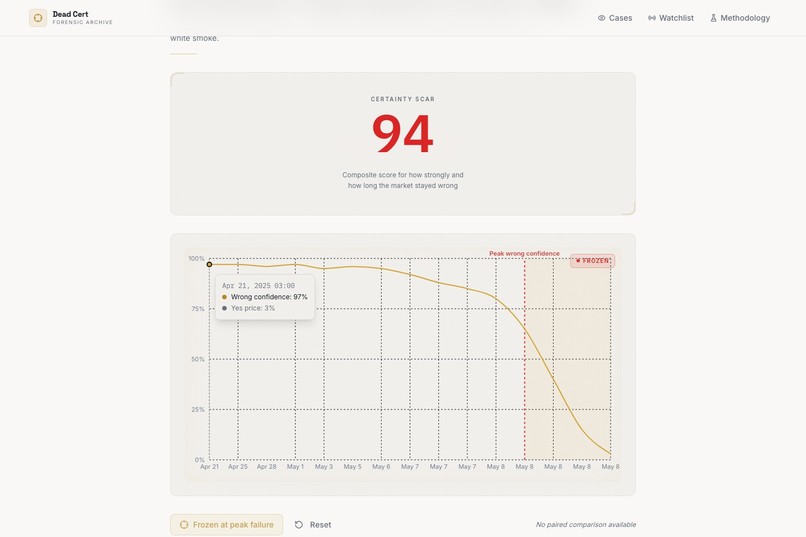
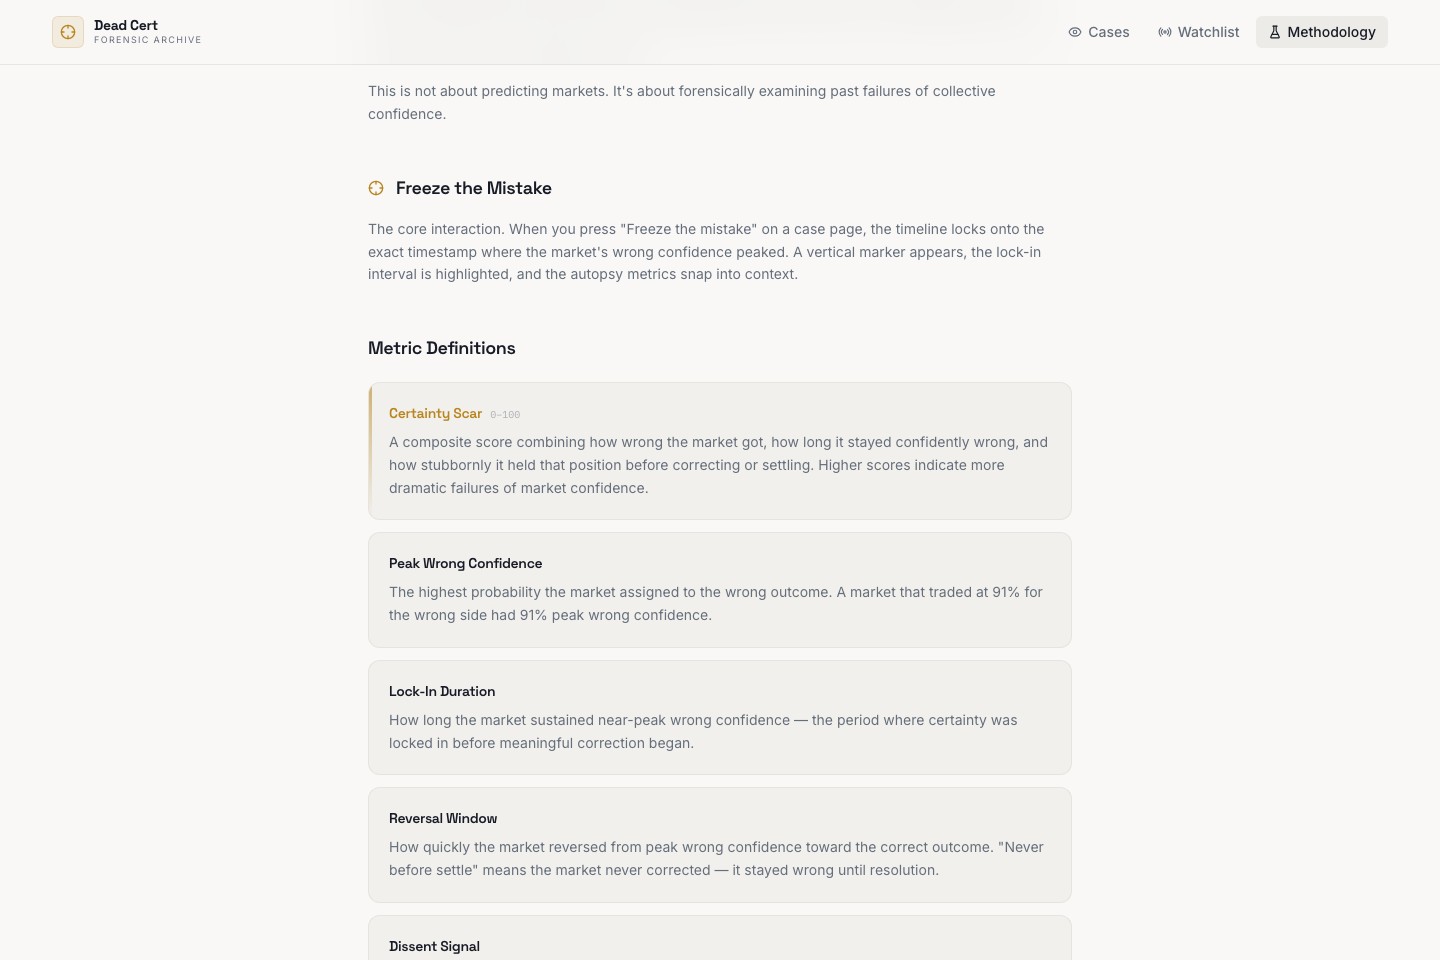
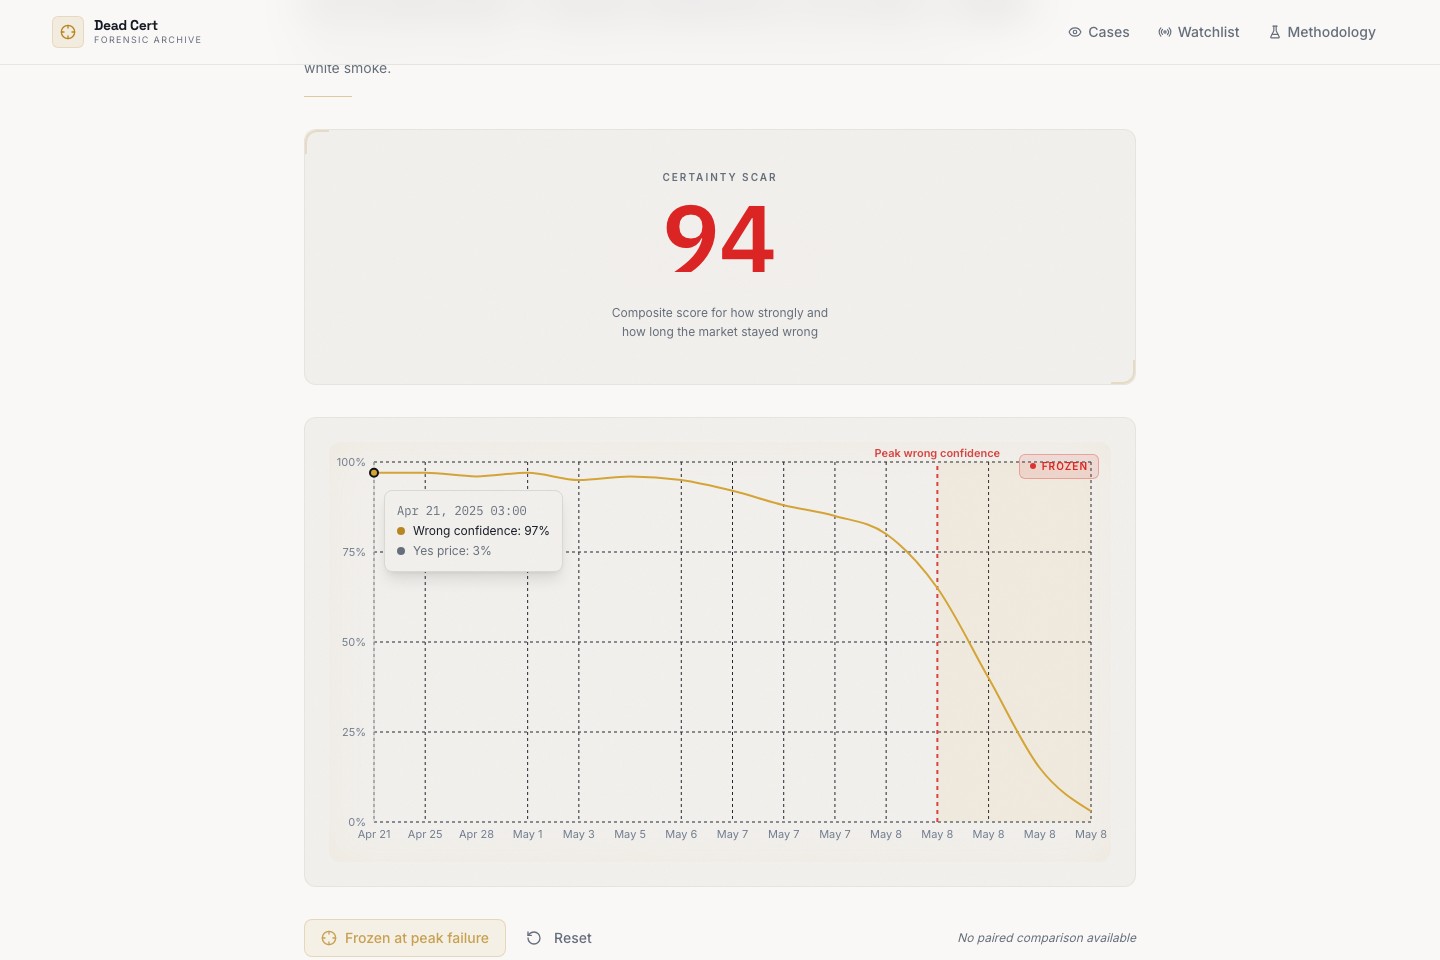
“Freeze the Mistake” locks the chart to peak wrong confidence, turning a vague market miss into a precise forensic moment.
-
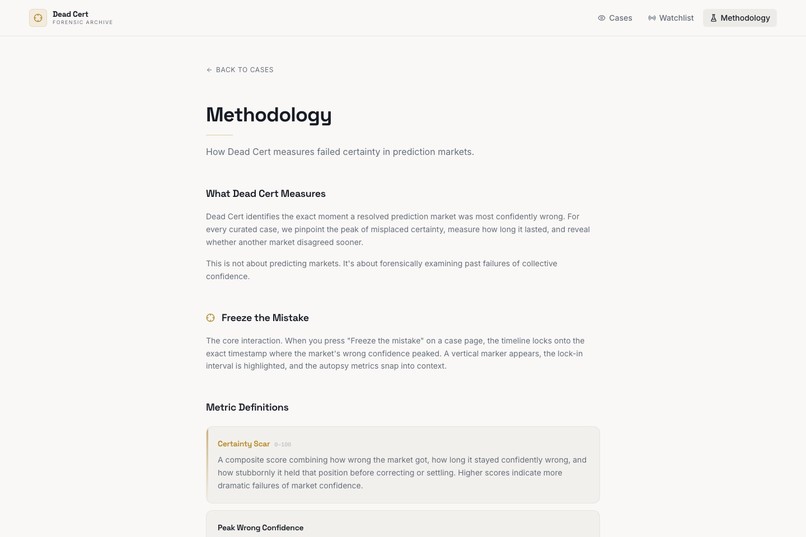
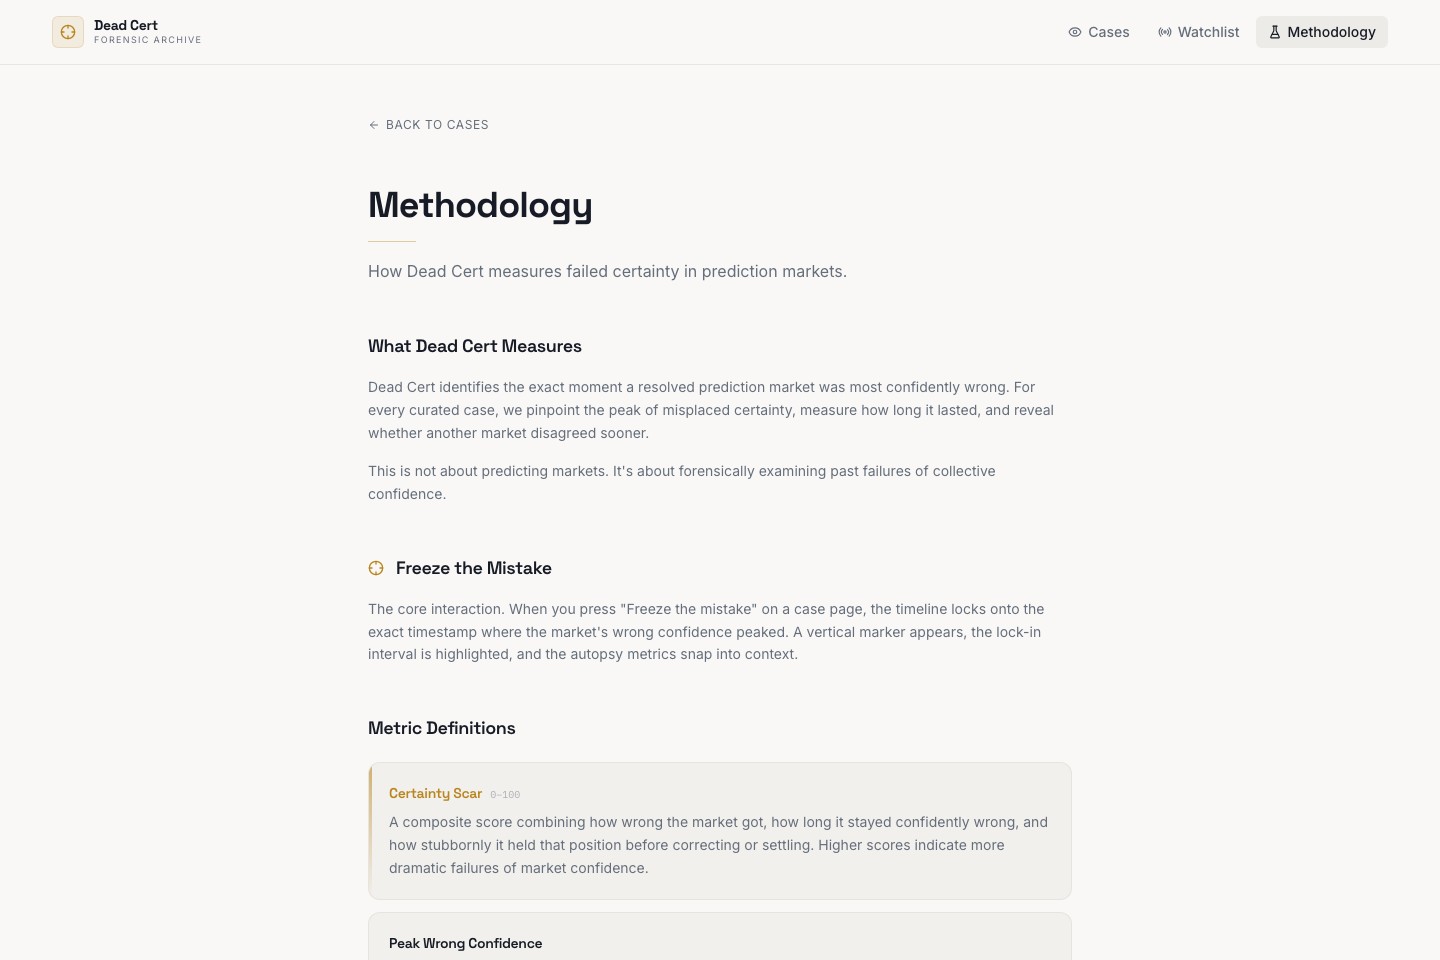
The methodology page explains how Dead Cert identifies the exact moment a resolved market was most confidently wrong.
-
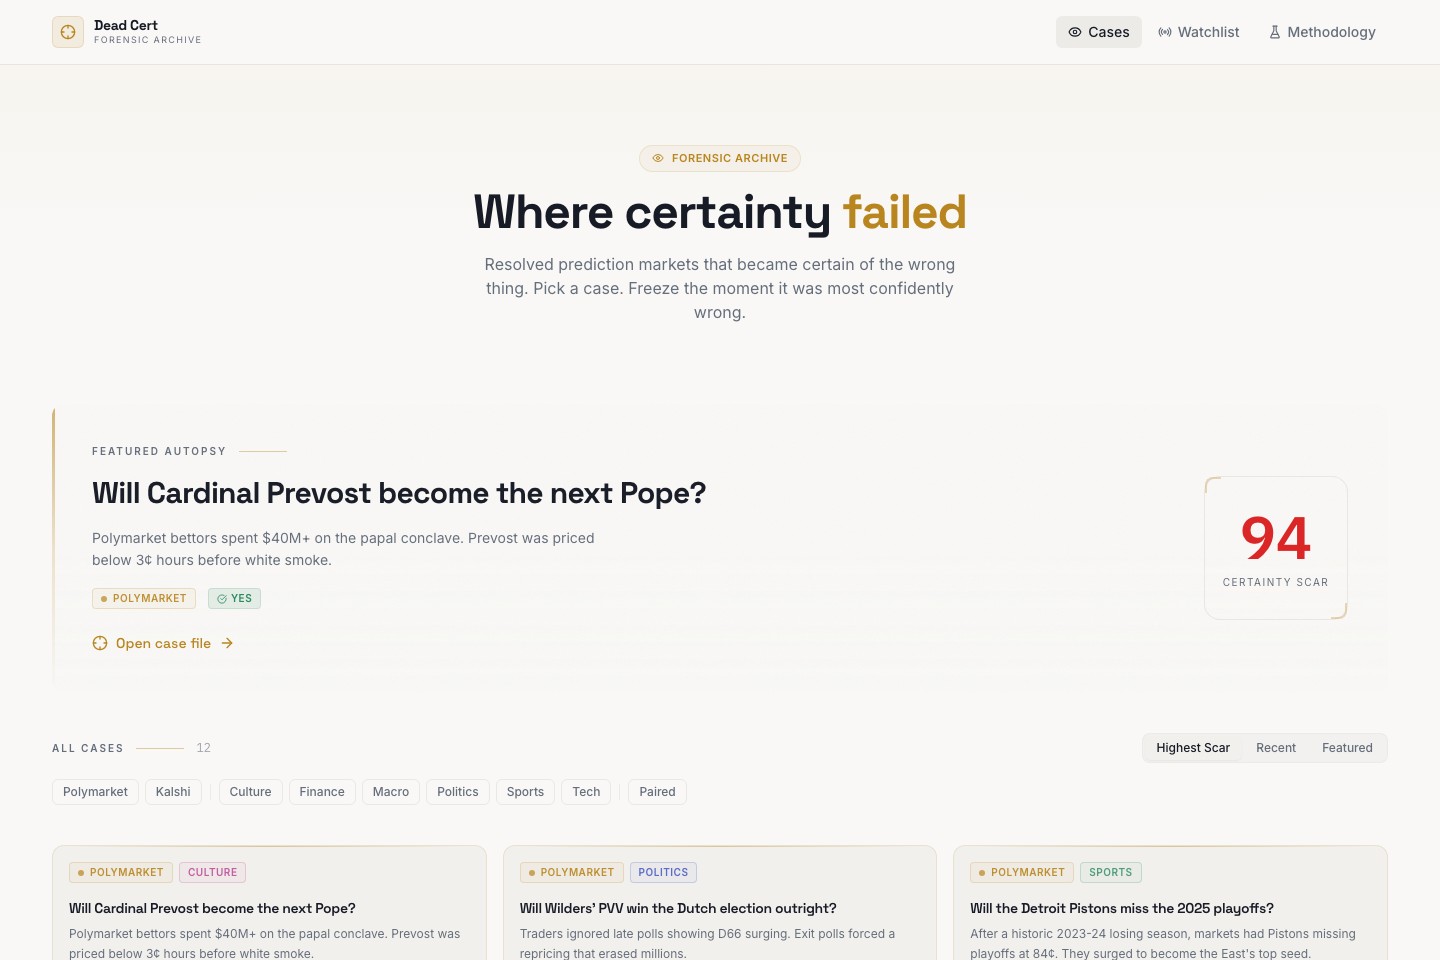
Dead Cert’s homepage introduces a forensic archive of prediction markets that became certain of the wrong outcome.
-

Metric definitions break down Certainty Scar, lock-in duration, reversal window, and dissent signal in plain language.
-
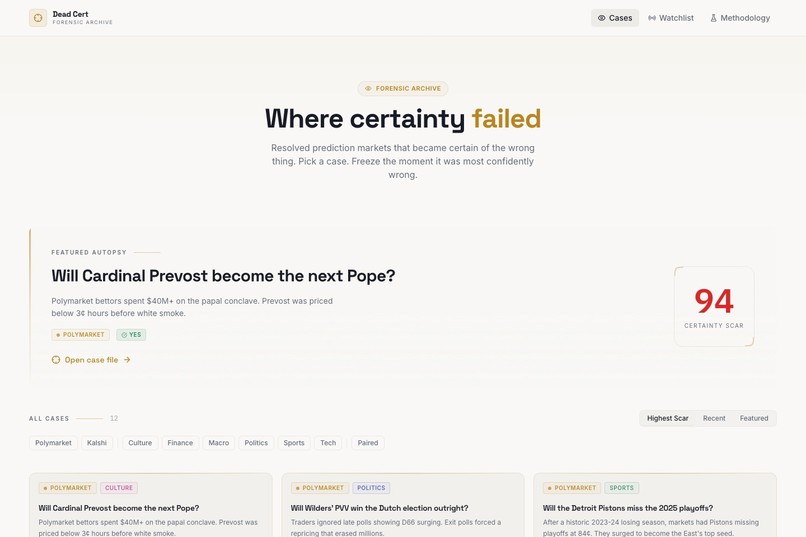
A live case file showing the Certainty Scar and full market timeline before the mistake is frozen in place.

Inspiration
Dead Cert started from a simple question: what if the most interesting part of a prediction market is not when it is right, but when it becomes confidently wrong?
We kept coming back to the same pattern across totally different topics: opaque events like the papal conclave, hype-driven tech timelines, political narratives, sports momentum, and macro calls that looked obvious until they suddenly were not. Most tools show the market price now, or the final outcome later. Very few preserve the exact moment when collective confidence hardened around the wrong answer. That gap became the inspiration for Dead Cert.
We wanted to build something that treated those failures seriously, almost like investigative journalism for market misses. Instead of saying "the market got this wrong," we wanted to turn each miss into a browsable case file: what the market believed, how strongly it believed it, how long it stayed there, and how quickly reality broke the illusion.
What it does
Dead Cert is a forensic archive of resolved prediction markets that became certain of the wrong thing.
Users can browse cases across politics, sports, macro, finance, tech, and culture; open a case file; and hit Freeze the mistake to lock the chart onto the exact timestamp where wrong confidence peaked. From there, the app surfaces the key diagnostics behind that failure: Peak Wrong Confidence, Lock-In Duration, Reversal Window, and Dissent Signal when a paired market exists.
The product also includes a live watchlist for markets showing early fragility signals. The point is not to claim we know the future. The point is to flag markets that already look structurally shaky based on the same patterns that produced past failures.
Conceptually, the main scoring idea looks like this:
$$ \text{Certainty Scar} \approx f(\text{Peak Wrong Confidence},\ \text{Lock-In Duration},\ \text{Reversal Stubbornness}) $$
And for paired markets, the disagreement signal can be thought of as:
$$ \Delta_{\text{dissent}} = p_{\text{wrong, primary}} - p_{\text{wrong, paired}} $$
So if one venue was dramatically less wrong at the same moment, that disagreement becomes part of the story.
How we built it
We built Dead Cert as a split system: an analysis pipeline upstream, and a storytelling product downstream.
On the frontend, we used Vite + React + TypeScript to build the public archive and admin experience. We used TanStack Query for data fetching and caching, Recharts for the time-series autopsy charts, Framer Motion for the freeze interaction and UI transitions, and shadcn/ui + Radix primitives to keep the interface consistent and composable.
On the backend, we used Supabase for the database, authentication, row-level security, and Edge Functions. The schema stores builds, cases, case points, paired comparisons, watchlist items, site settings, and admin roles. We created an admin workflow where a curated build manifest can be imported, reviewed, and then published so one build becomes active while the previous one is archived.
The most important architectural decision was keeping the heavy analytical work outside the browser. The site is the forensic surface, not the calculation engine. Case data, chart points, metadata, and methodology artifacts are produced upstream and then ingested into the app, which keeps the UI fast and the metric definitions stable.
We also invested in quality early. We used Vitest and Testing Library for component and service tests, live Supabase contract tests for security and import/publish behavior, and Playwright for end-to-end flows like navigation, admin login, case editing, and builds. On top of that, we added a small Remotion + Playwright + TTS demo pipeline to generate a narrated product walkthrough.
Challenges we ran into
- Defining a metric like Certainty Scar without making it feel arbitrary. We needed it to be opinionated enough to be useful, but intuitive enough that users could understand what it represented immediately.
- Turning charts into explanation, not decoration. A normal market chart is easy to build; a chart that clearly communicates "this is the exact moment confidence failed" is much harder.
- Handling the tension between retrospective analysis and live-market language. The watchlist had to feel useful without pretending it was a prophecy engine.
- Designing a backend flow that let admins import and publish new builds safely while ensuring the public could only see published data. That meant getting row-level security, roles, and Edge Function contracts right.
- Aligning paired comparisons across markets and timestamps in a way that still tells a clean story. Cross-venue disagreement is valuable, but only if the comparison is legible and trustworthy.
- Building a product that feels editorial instead of dashboard-like. Dead Cert needed to feel like a case archive, not just another analytics console.
Accomplishments that we're proud of
- We turned resolved prediction market misses into interactive case files with a clear narrative structure instead of a pile of raw numbers.
- We created a product vocabulary that gives the idea a strong identity: Freeze the Mistake, Certainty Scar, Dissent Signal, and Fragility Score.
- We shipped both sides of the product: a public-facing archive and a private admin system for importing, editing, and publishing builds.
- We built a testing stack that covers UI behavior, backend contracts, and end-to-end flows, which makes the project feel much more production-ready than a typical prototype.
- We made the interface explain the analysis. The freeze interaction, highlighted lock-in window, paired comparison overlay, and methodology page all work together to make the metric system understandable.
- We created a media pipeline for demo storytelling, which helped us present the product as a coherent experience rather than just a collection of screens.
What we learned
- People understand uncertainty better through moments than through raw probability tables. Showing the exact point where the market was most wrong is more powerful than simply saying it missed.
- Separating analysis from presentation was the right move. Precomputed artifacts make the frontend simpler, faster, and easier to reason about.
- Security is a product feature. The combination of Supabase Auth, role checks, and row-level security shaped how we designed the admin and public surfaces.
- Motion can clarify data when it is used with purpose. The freeze state is not there to be flashy; it helps users understand what they are looking at.
- Cross-market disagreement is often more interesting than a single market being wrong. Seeing that another venue started repricing earlier adds real explanatory value.
- The hardest part of a product like this is not building the chart. It is deciding what story the chart should tell, and then making the interaction support that story cleanly.
What's next for Dead Cert
- Expand the case library with more categories, more historical examples, and richer paired-market comparisons.
- Tighten the build ingestion pipeline so cases, comparisons, watchlist items, and methodology metadata all flow through one clean publishing path.
- Add stronger validation and diffing before publish, so admins can inspect what changed between builds before making a new one live.
- Improve the watchlist so fragility scoring becomes more nuanced, explainable, and grounded in larger market-history patterns.
- Publish deeper public methodology links and analysis context so users can audit how each case was assembled.
- Add shareable case snapshots, annotated timelines, and richer storytelling surfaces so each failure can be cited and discussed outside the app.
- Push Dead Cert further from “interesting visualization” toward “new lens on collective overconfidence.”
Built With
- javascript
- postgresql
- python
- react
- supabase
- tailwind
- typescript
- zerve

Log in or sign up for Devpost to join the conversation.