-
-
The home page of the site
-
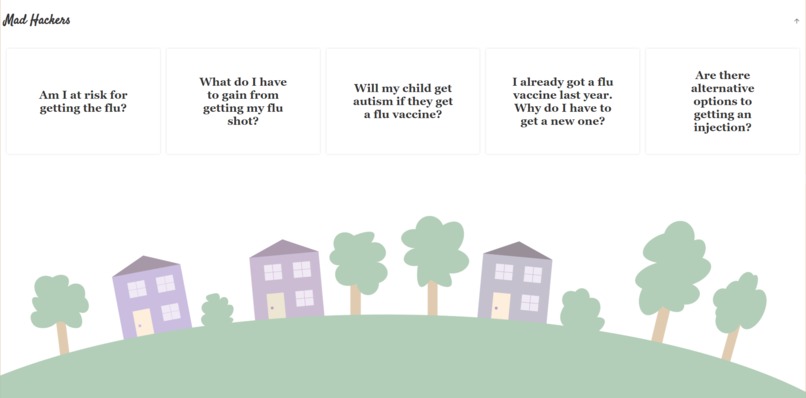
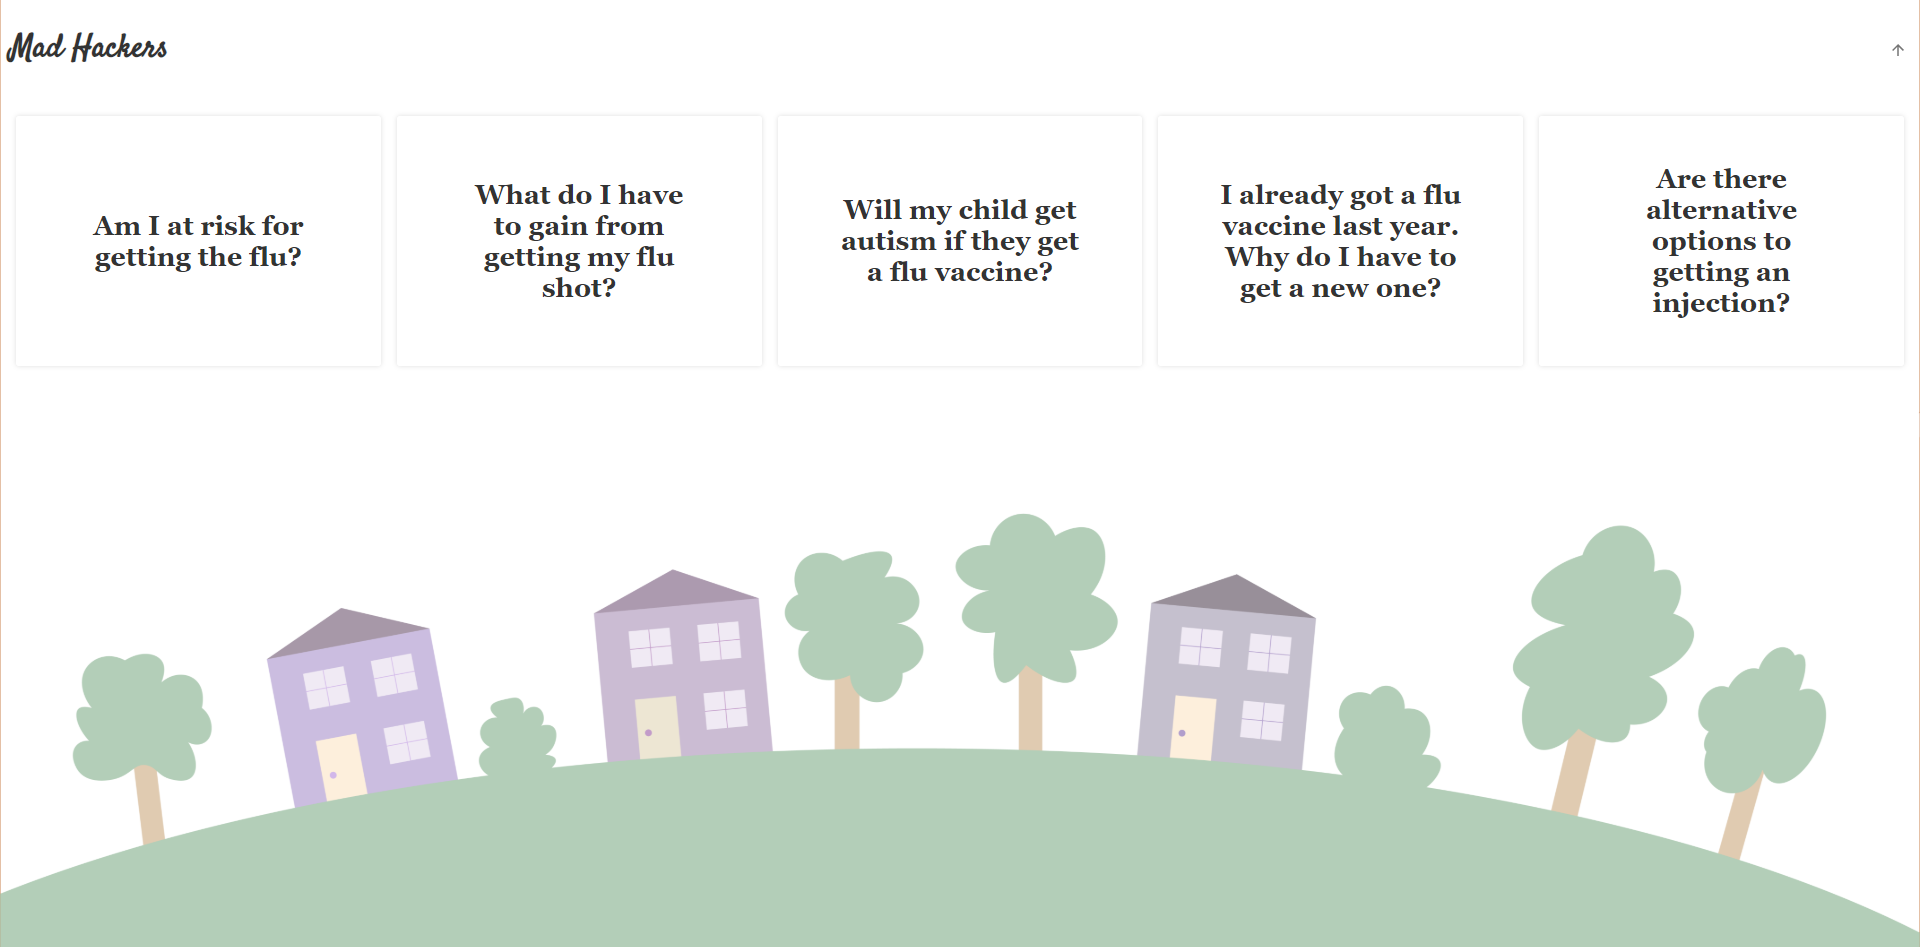
The next page transitions in to show the question cards
-
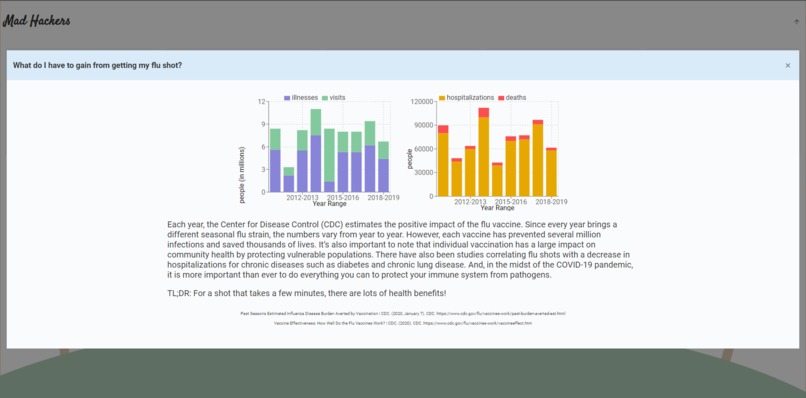
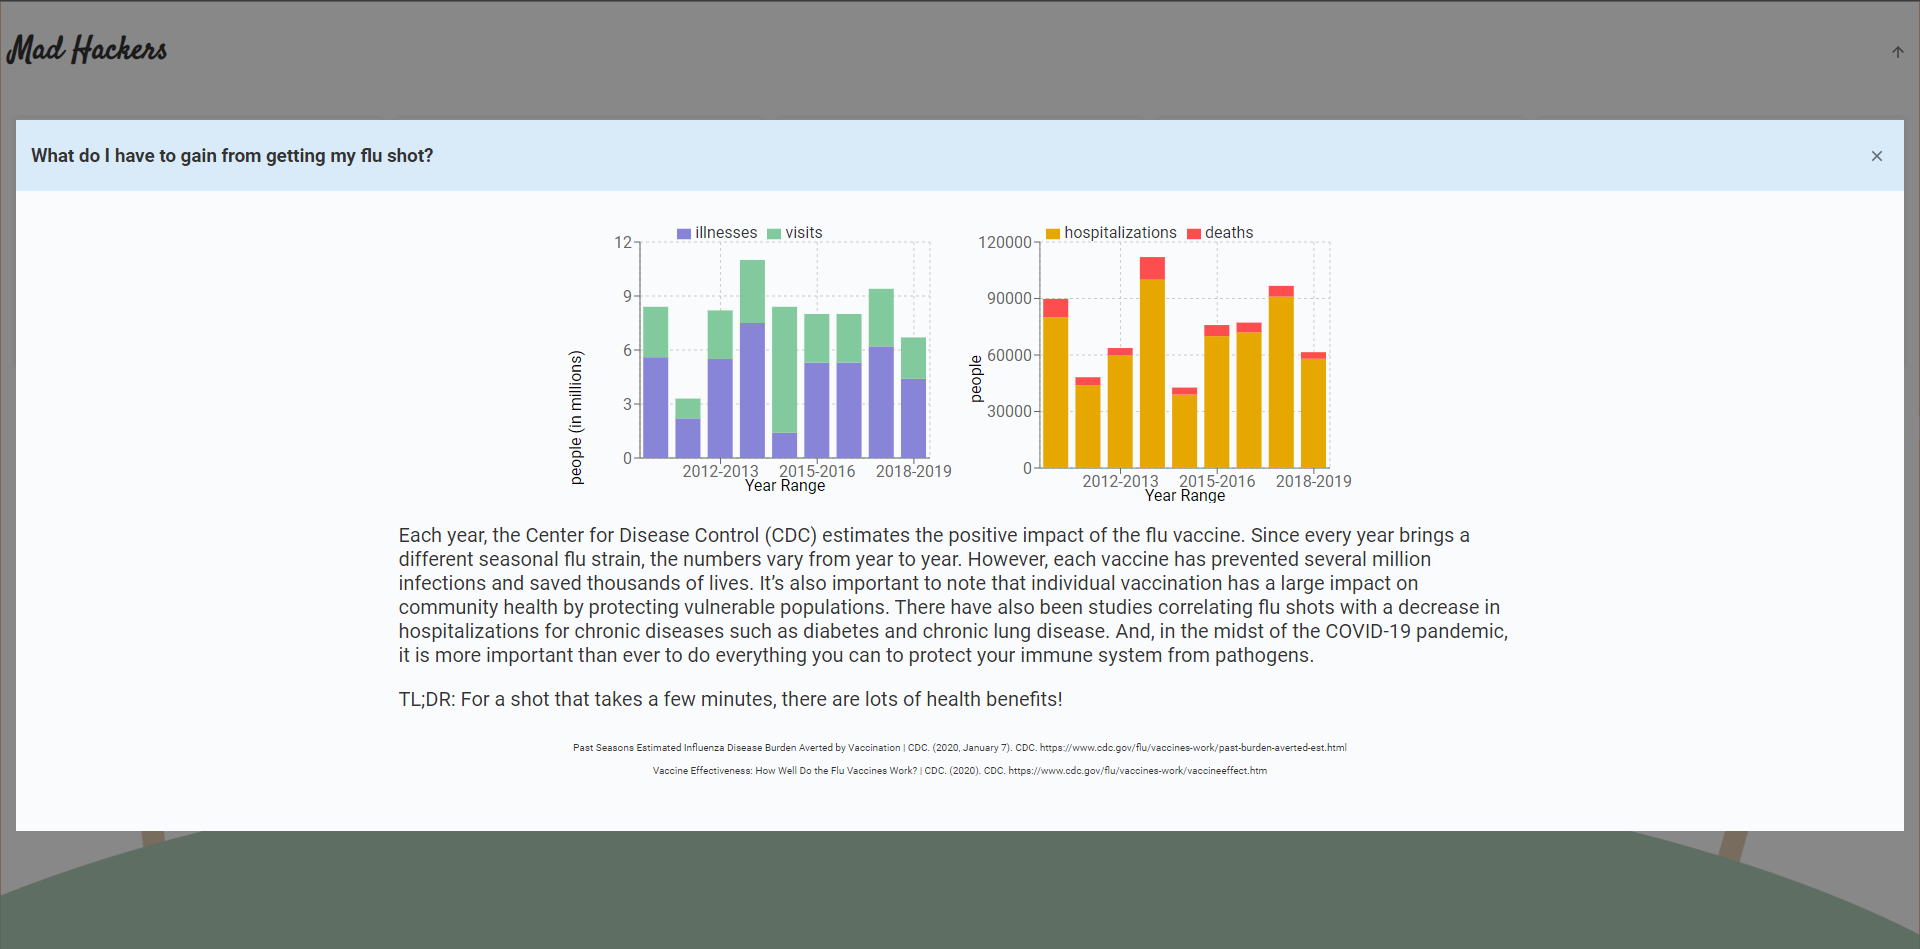
Each question card has a pop up with cited information
Inspiration
When we started our project, we immediately started discussing issues related to health misinformation and distrust of the public health system. While we considered doing a project related to COVID-19, we ended up focusing on the seasonal flu since it poses a unique threat to public health this season (the COVID-19 and flu “twin-demic”).
What it does
We approached flu vaccination from the perspective of someone who might not be sure about whether or not to get their flu shot, so we created a web app with questions we thought were important and interactive data to show the answers. Since vaccination is a particularly polarizing issue this year, we put special effort into making the questions and answers kind rather than condescending towards the people who may have them. We came up with the questions based on the health belief model, hypothesizing that the most important factors are perceived susceptibility to flu viruses, perceived benefit of the flu vaccine, and perceived threats or health dangers associated with vaccination. Every one of our questions addresses one of these three categories.
How we built it
The website is built using React and it is hosted by github pages. The site is all on one page and uses css transitions to navigate the pages. We created a QuestionCard component that maintains a pop up with the information. These cards are displayed using css grid to have a responsive design. We used React’s state functionality so when you click on the box it opens a popup with interactive data, a paragraph answer, and citations. The information popup component uses the rechart graph library to display data we manually entered.
Challenges we ran into
Data collection was difficult because we couldn’t find any easily accessible API’s for this type of dataset. So, we gathered the data manually and used a graph library called recharts to display the data. Another challenge was the time. We wanted to have more interactivity and options on the website but as we were new to this, we couldn’t do all of it in the allocated time. Therefore, we restricted ourselves to only five key questions, and focused on making the answers and graphics the best that we could. Finally, styling and creating the layout proved difficult as CSS doesn’t always play nice.
Accomplishments that we're proud of
This is our first completed hackathon project!! We are very proud of completing our project on time! We are also very proud of how this project incorporated the diverse skill sets of our 3 group members. We only had one official coder, yet all of us were working the whole time. And, despite the virtual environment, our team maintained good communication throughout the process and worked together very well. It was a really great learning experience and we are excited for more hackathons in the future.
What we learned
Each member of our group has done something outside of their normal comfort zone. One member used the recharts library for the first time to make several really cool interpretations of CDC data. Another member learned some Javascript to work with the data. The last group member designed all the graphics and user interface details, and learned several new skills in Adobe Illustrator.
What's next for De-Mist-ifying the Flu Vaccine
We had several ideas for expanding our idea, including adding a drop-down menu to the front page (to cover topics other than flu vaccination) as well as adding more interactive graphs and charts. Also, it would be very interesting to embed videos of doctors answering questions to give the webapp a more personal touch. However, the lofty goal we have is to centralize this type of data for users, so in the future, we would be able to automate these questions using a language API.
Built With
- react
- recharts


Log in or sign up for Devpost to join the conversation.