-
-
Logo
-
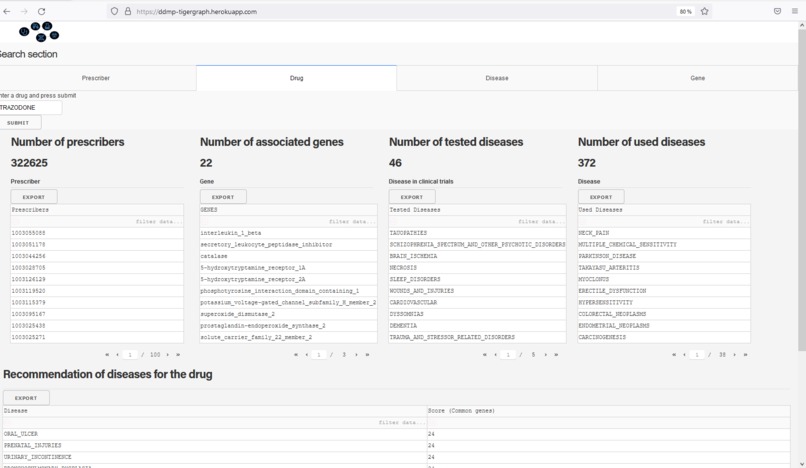
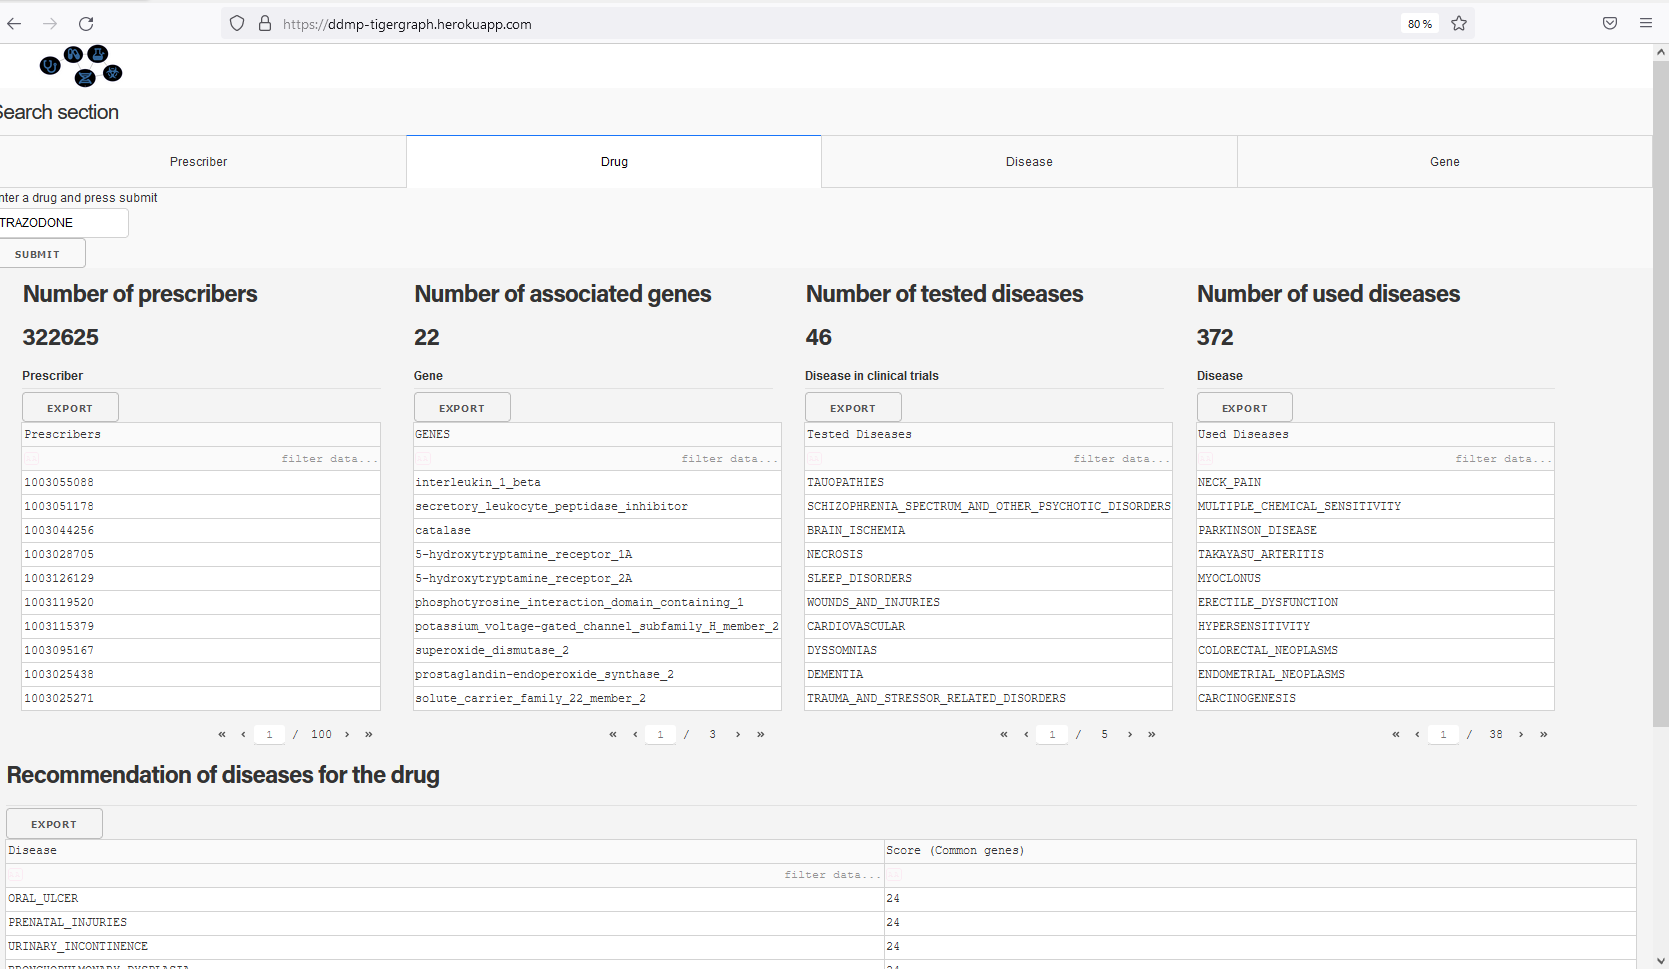
Search engine for a drug: shows doctors prescribing the drug, associated diseases, and gene. Recommands such a drug for a list of diseases
-
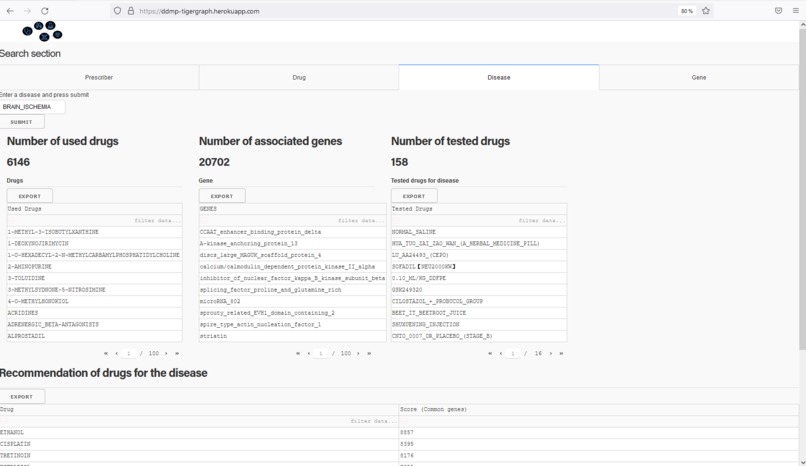
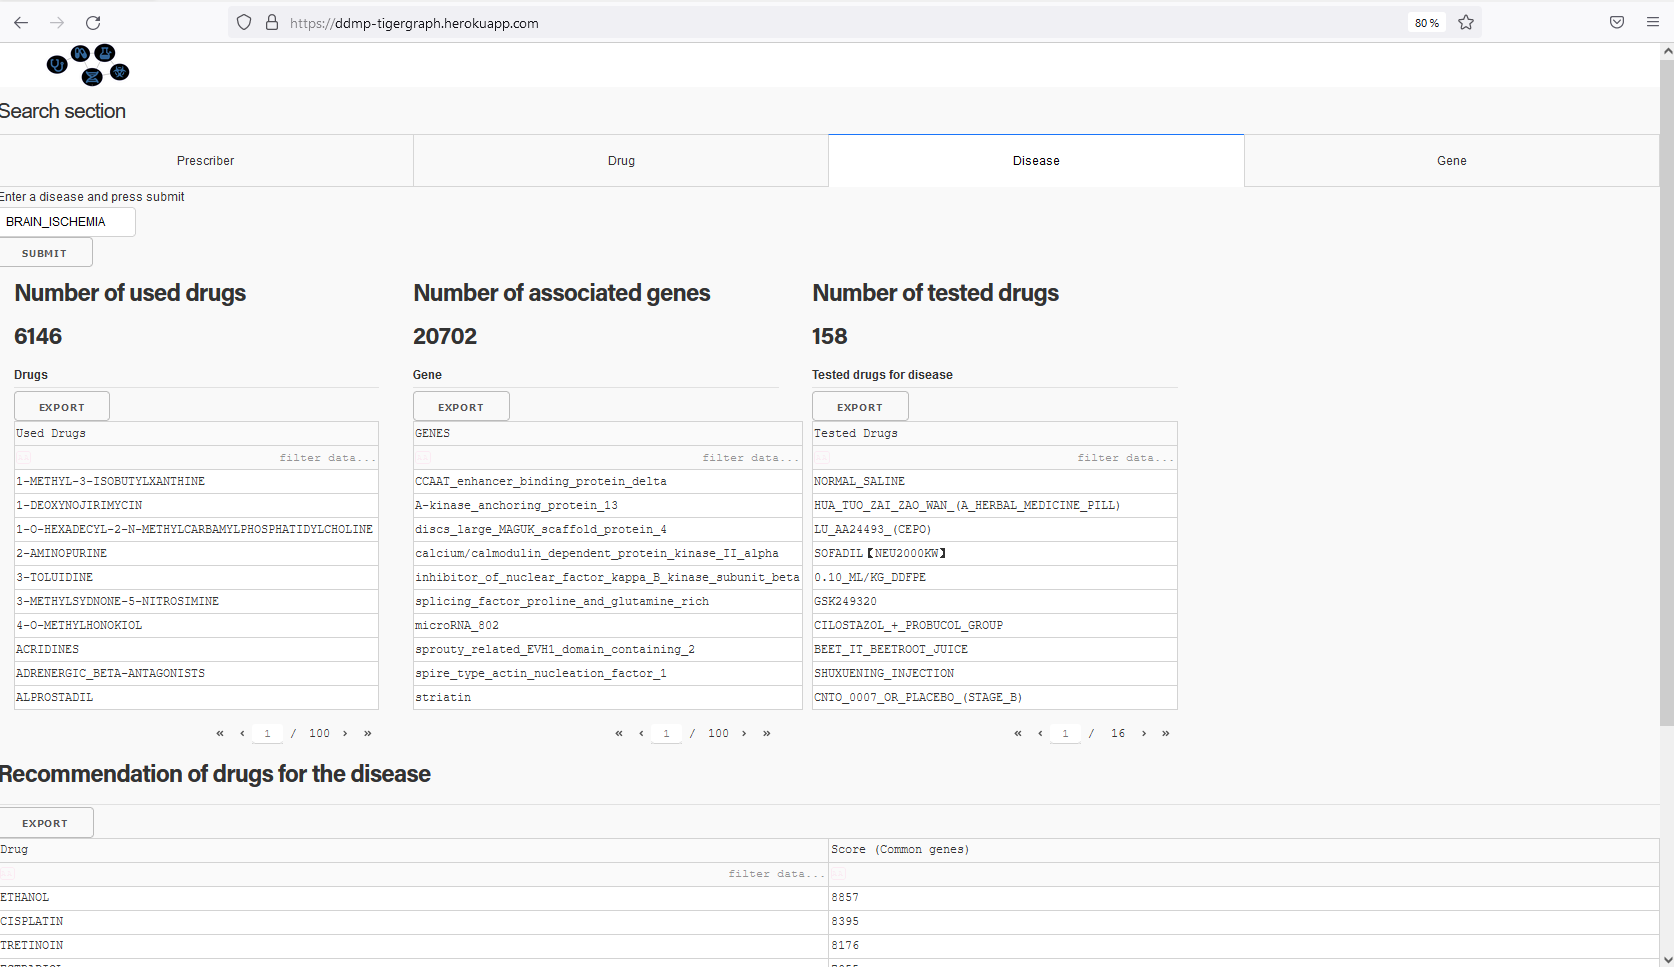
Search engine for a disease: shows associated drugs, and gene. Recommands drugs for a such disease.
-
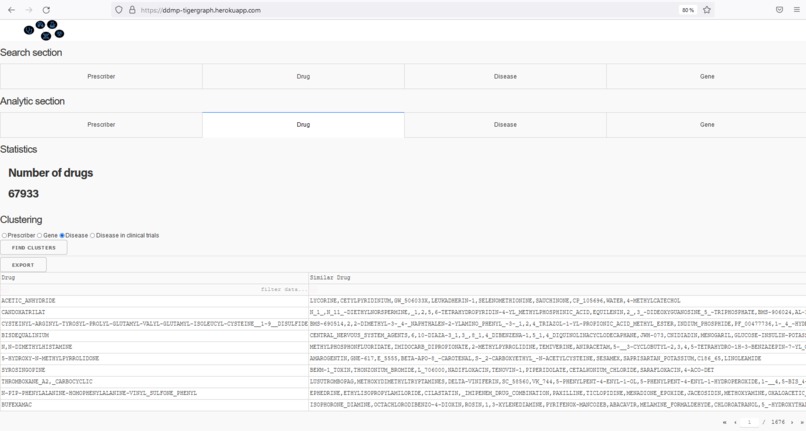
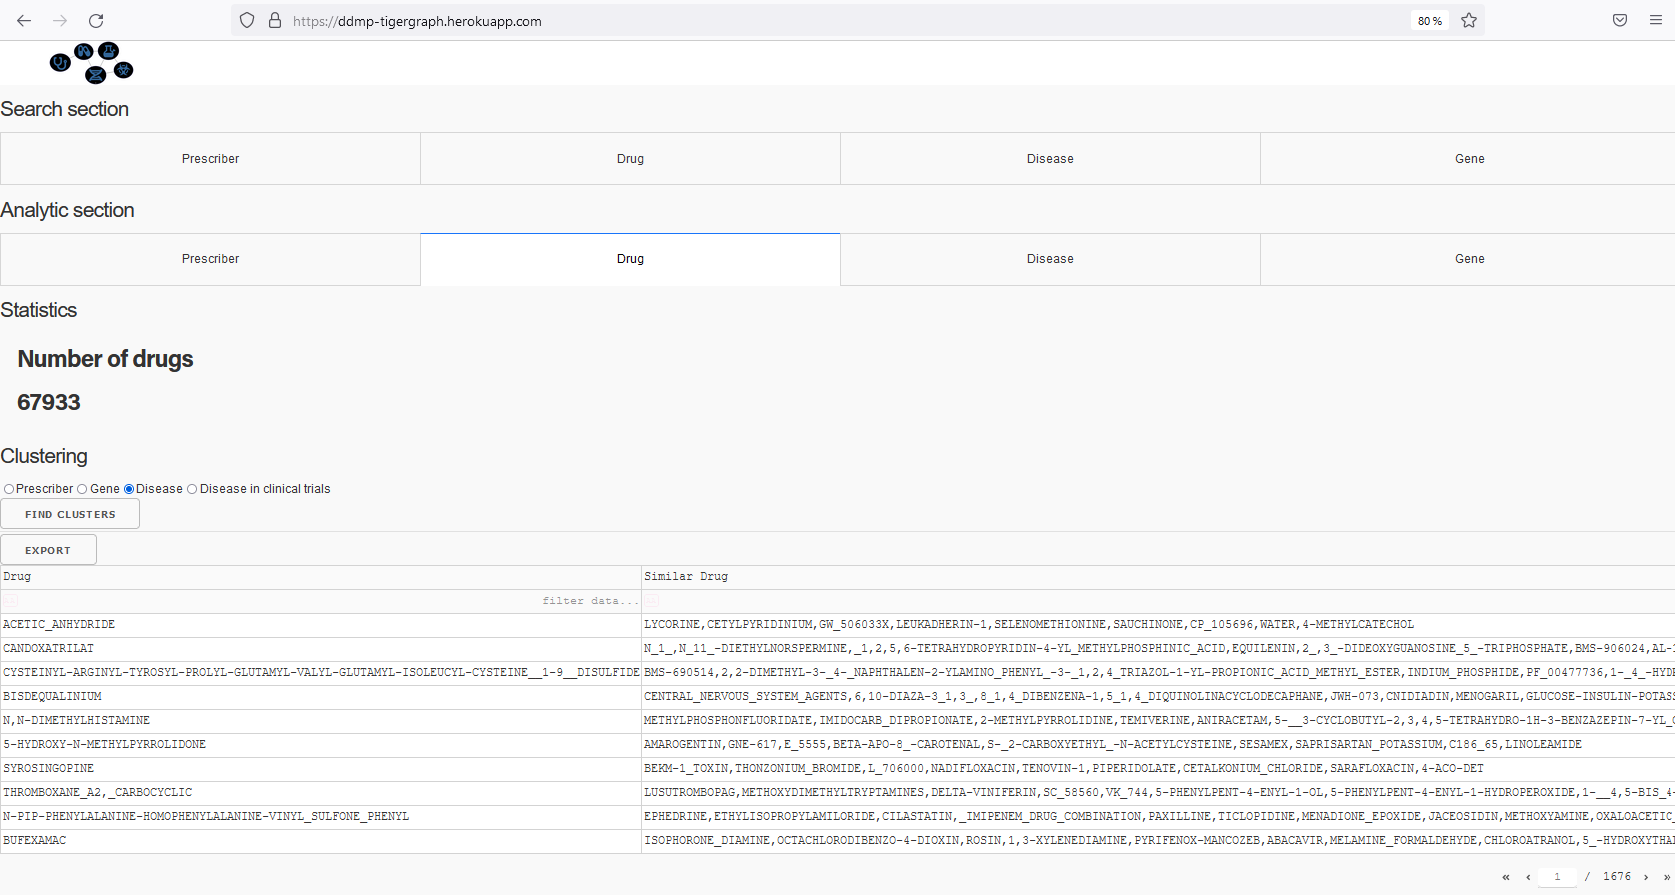
Find similar drugs based on treated diseases
-
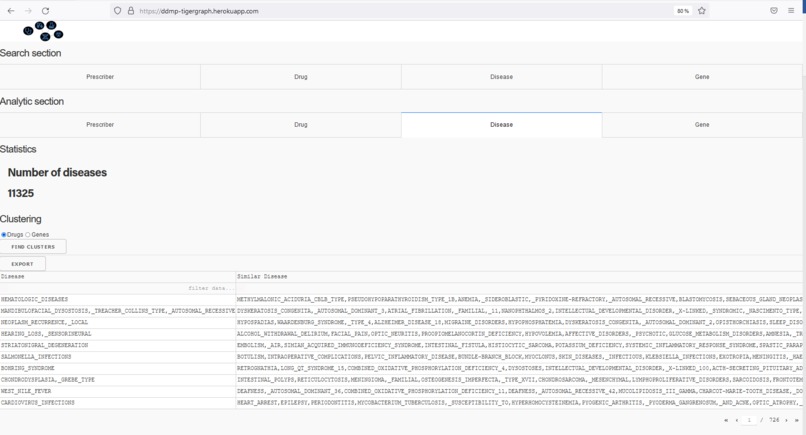
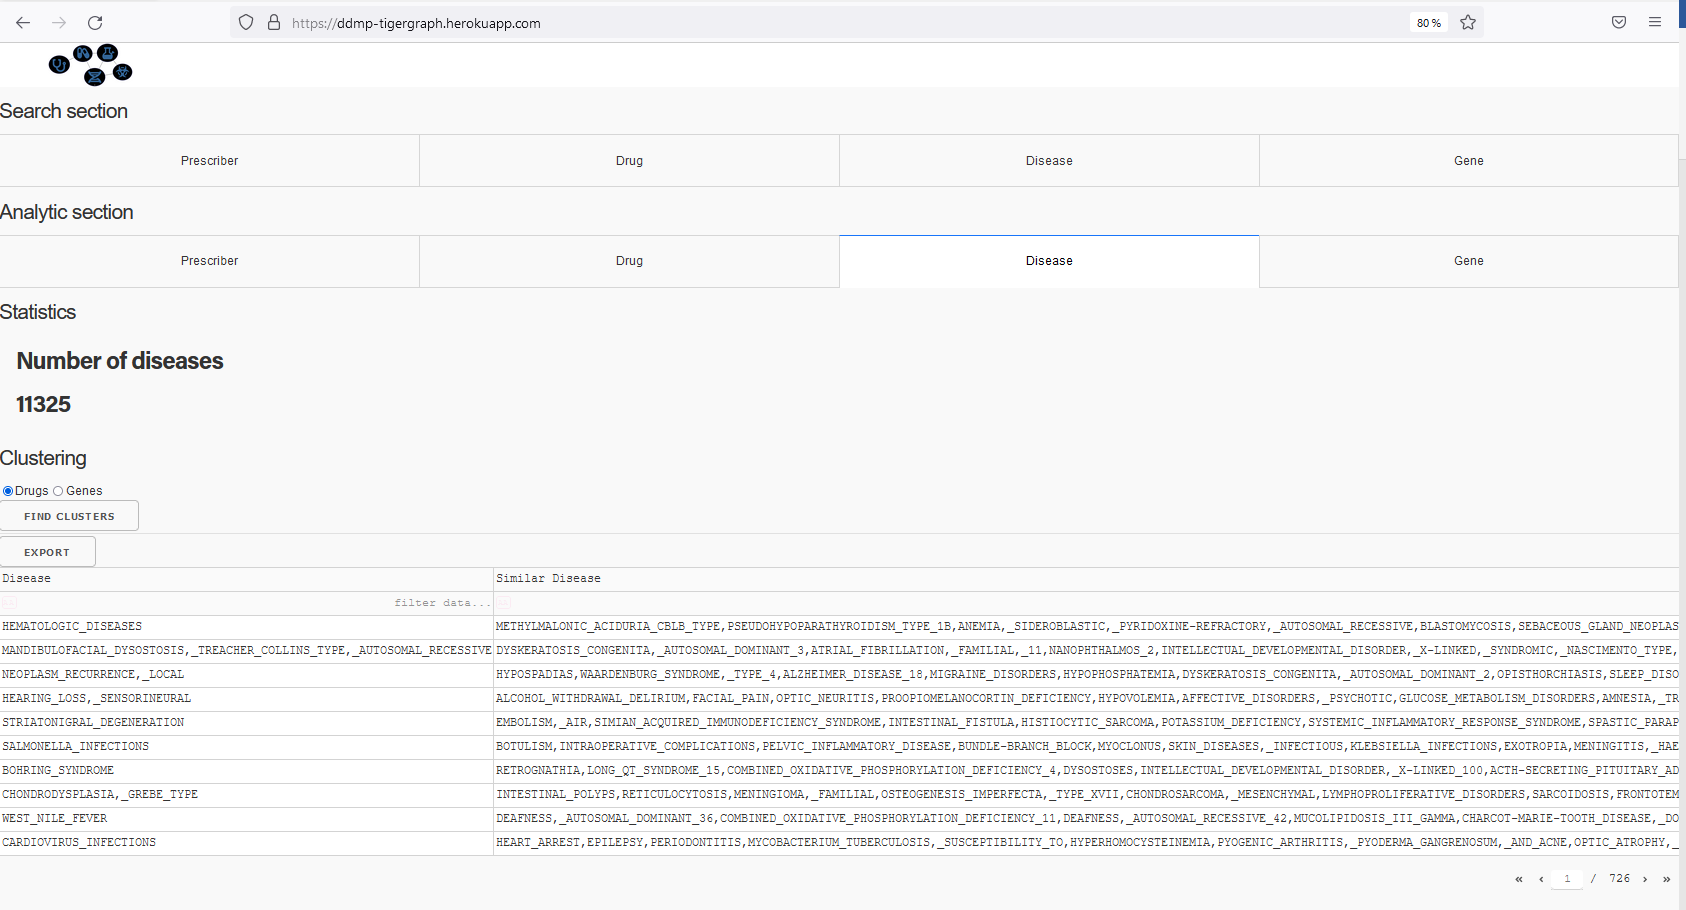
Find similar diseases based on used drugs
-
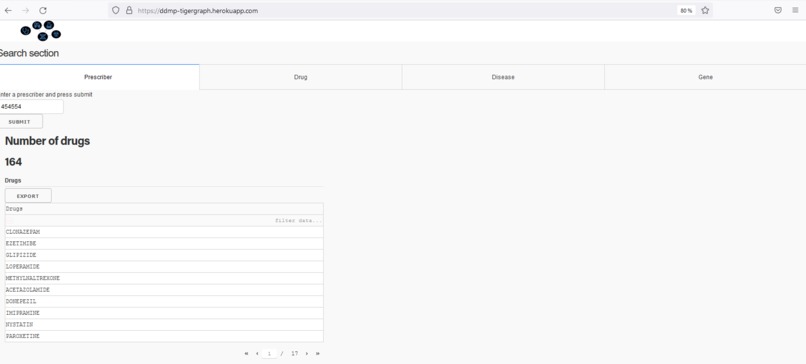
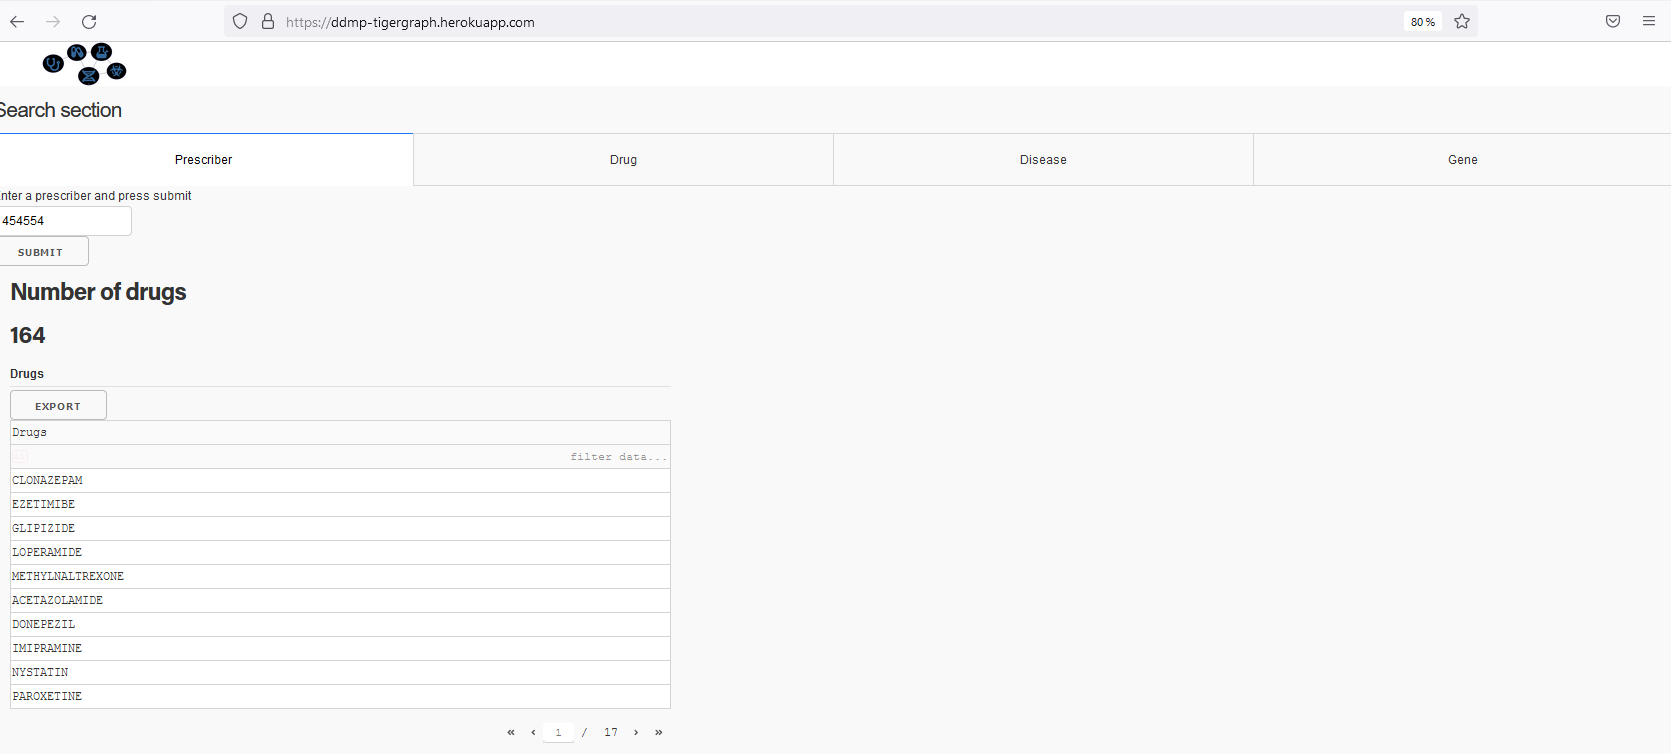
Search for a docter and provides a list of drugs who prescribe
-
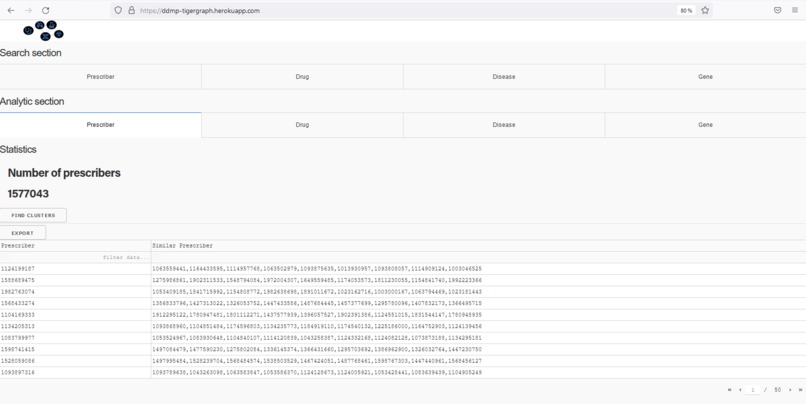
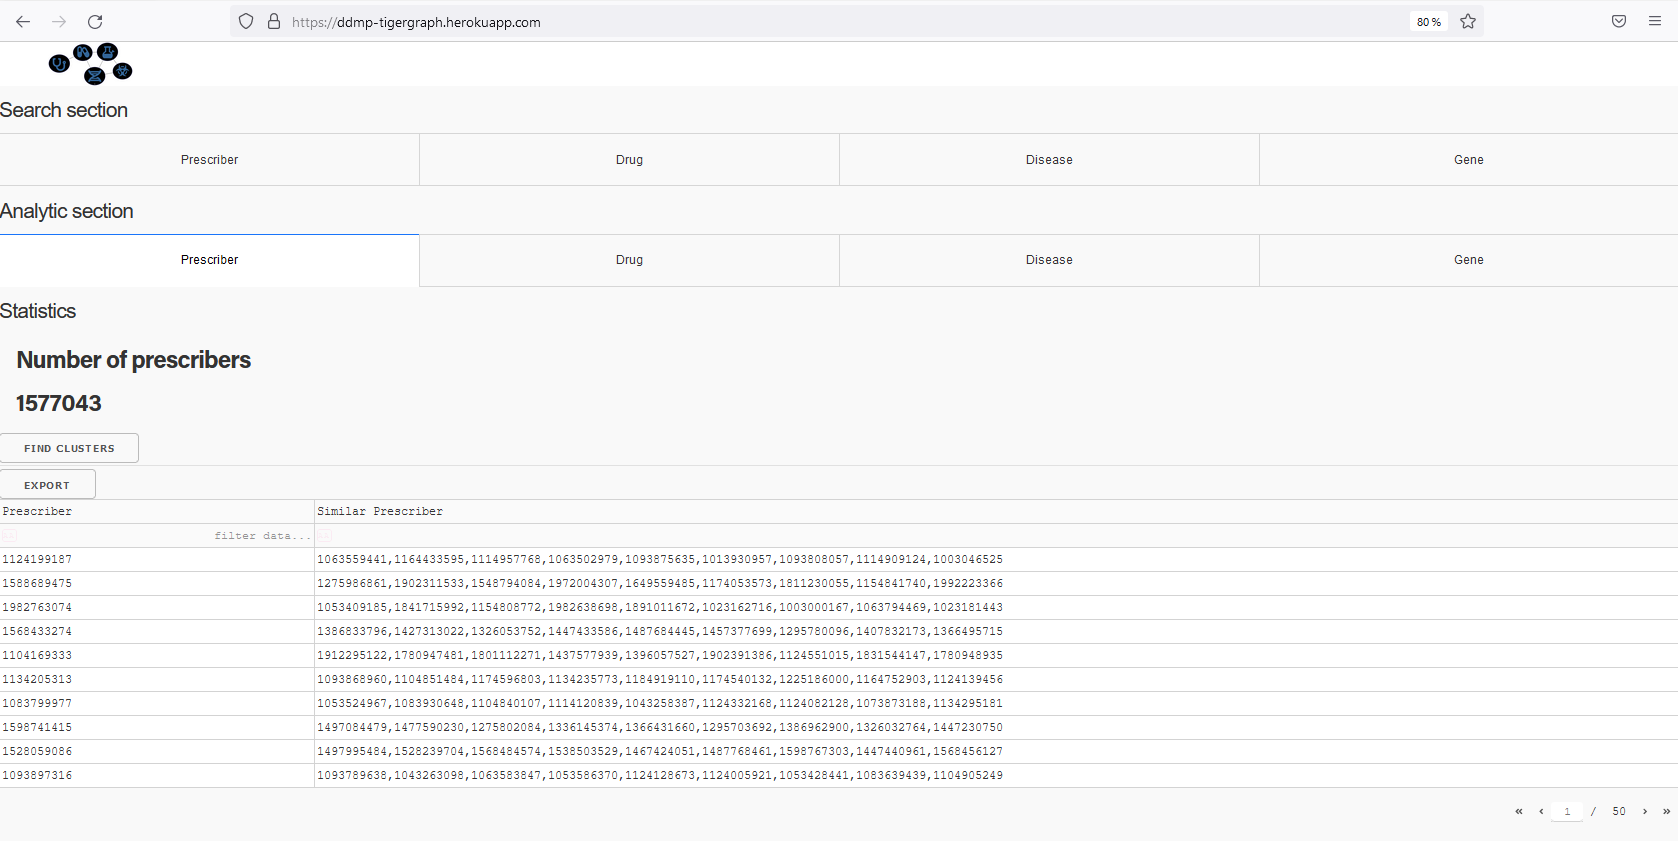
Find similar doctors prescribing the same drugs
-

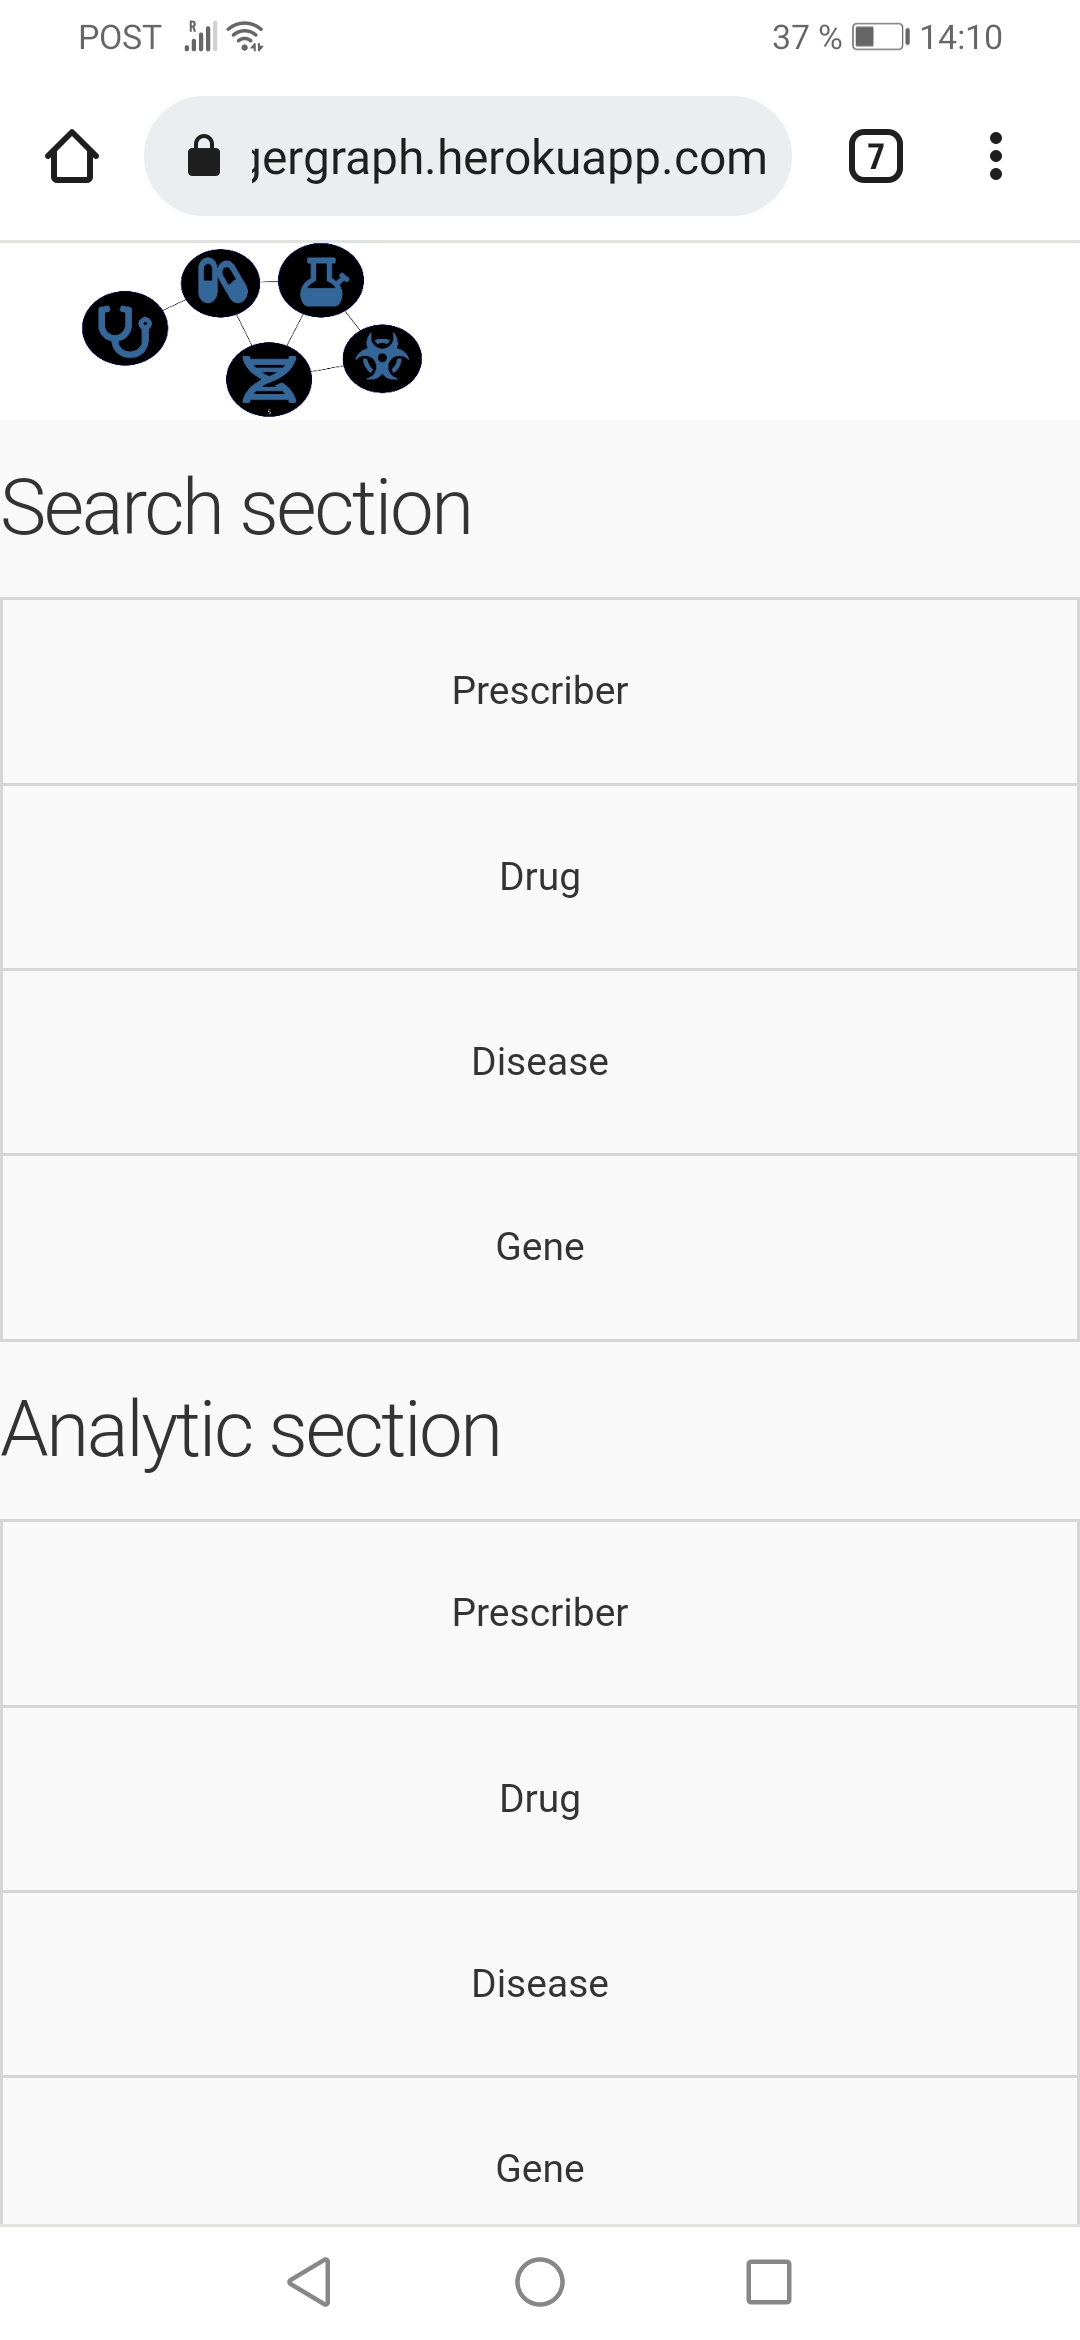
Use in a smartphone

Inspiration
I was inspired by helping doctors as well as researches by discovering new drugs based on the existing data associations between drugs, disease, and genes as well as the clinical trials. Another inspiration was to create connections and collaborations between doctors and researchers (pharmacists) which has a positive effect on healthcare outcomes. The fundamental principles of healthcare practices and policies are derived from good quality research. In fact, doctors collectively are a source of vast sums of invaluable information. This information if effectively utilized can improve and strengthen the healthcare system.
What it does
The developed solution proposed three key modules:
Search engine module: helps doctors and researchers to find the information they are looking for using drug, disease, doctor, or gene name as a keyword. It includes a drug search engine, disease search engine, gene search engine, and doctor search engine.
Recommendation system module: recommends drugs for a disease, recommends to use a drug for a set of diseases.
Analytical module: helps to provide clustering and statistics of doctors, drugs, diseases, and genes. It provides: * clusters of doctors with the drugs they typically prescribe, clusters of drugs associated to proscribed diseases, tested diseases in the clinical trials and genes, clusters of disease associated to drugs and genes.
How we built it
The project are build based on the availabilities of the data, and how can I create relationships between them into a graph database, and how can I visualize the results such as every user can easily used it. First: the data was collected and processed from different heterogeneous sources. The processing step consists in cleaning the data by removing special characters, performing a data harmonization from different sources and provide a comparable view of data from different studies. Second, the graph schema and data mapping are automatically performed in the python code using the tigergraph api. Third, 30 GSQL queries were created and installed in the graph database. Finally, a dashboard was developed using the framework dash-plotly. The dashboard is a web-app containing a search engine, analytical results, and a recommendation system. The web-app can be used in a laptop or a mobile.
Challenges we ran into
The challenges I faced are: Developing a solution to combine various healthcare data sources to understand patterns of diagnosis and treatment that point to potential off label usage of drugs. Developing a search engine to find a group of doctors with the drugs they typically prescribe, a group of drugs prescribed or tested for a disease, a group of diseases used by a drug. Developing a recommendation system to recommend the similar doctors, drugs, and diseases.
Accomplishments that we're proud of
I'm proud of developing this project from scratch using a tigergraph technology that I never used it before this challenge. I worked as a data engineer and in the same time as a data scientist. I performed all the steps of this project:
Back-end operations: data collection, data processing, tigergraph on-premise installation, graph database and queries creation, machine learning algorithms on the top of the graph database.
Font-end operations: Web application development.
Writing the defense of this project: by performing a business investigations; analyzing the market to which this project may belong.
What we learned
I learned tigergraph technology: how install it, use it, deploy it, and also how to create, query, and use a graph database. I also learned the GSQL query language for creating, installing, and using queries. I also used the graph data science library provided by tigergraph in order to use machine learning algorithms for drug prediction and recommendation in the search engine.
What's next for DDMP
About the technical part, the next of this project is to:
- Improve the web application performance.
- Search and including new healthcare data such as biological data, patient data.
- Improve the dashboard by providing more details of doctors, drugs, and disease
- Add more biological data (molecules) for clinical trials and drug similarities and recommendations.
- Interact with the experts (doctors, researchers) by integrating them in the loop of the system.
About the business part, the next of this project is to:
- Grow the team.
- Analyze and quantify the market in which the project can be developed.
Built With
- css
- dash
- jupyter
- python
- tigergraph

Log in or sign up for Devpost to join the conversation.