Deutsche_Bahn_call_a_bike (24h hackathon)
BUSINESS PROBLEM (for a shared mobility provider)
In an emerging market in which more and more market players are competing for customers, it is a competitive advantage for a mobility-providing company to be able to predict precisely at which locations the customer's needs will arise.
THE SOLUTION
An application for Operations Management that provides a dynamic forecast for the next shift / the next day / the next 3-5 days for the need for bicycles or other types of shared transportation at one station, taking into account the following aspects:
- the weather characteristics (temperature, wind, rain)
- public and school holidays
- events with higher number of people nearby
OUR MVP AFTER 24h
(1) First Part of the MVP is a Prediction model for the supply of bicycles for call-a-bike at each of the 200 stations in Hamburg. Based on the provided data from the years 2014-2015 and considering weather data (temperature, wind speed, precipitation), holidays, school holidays.
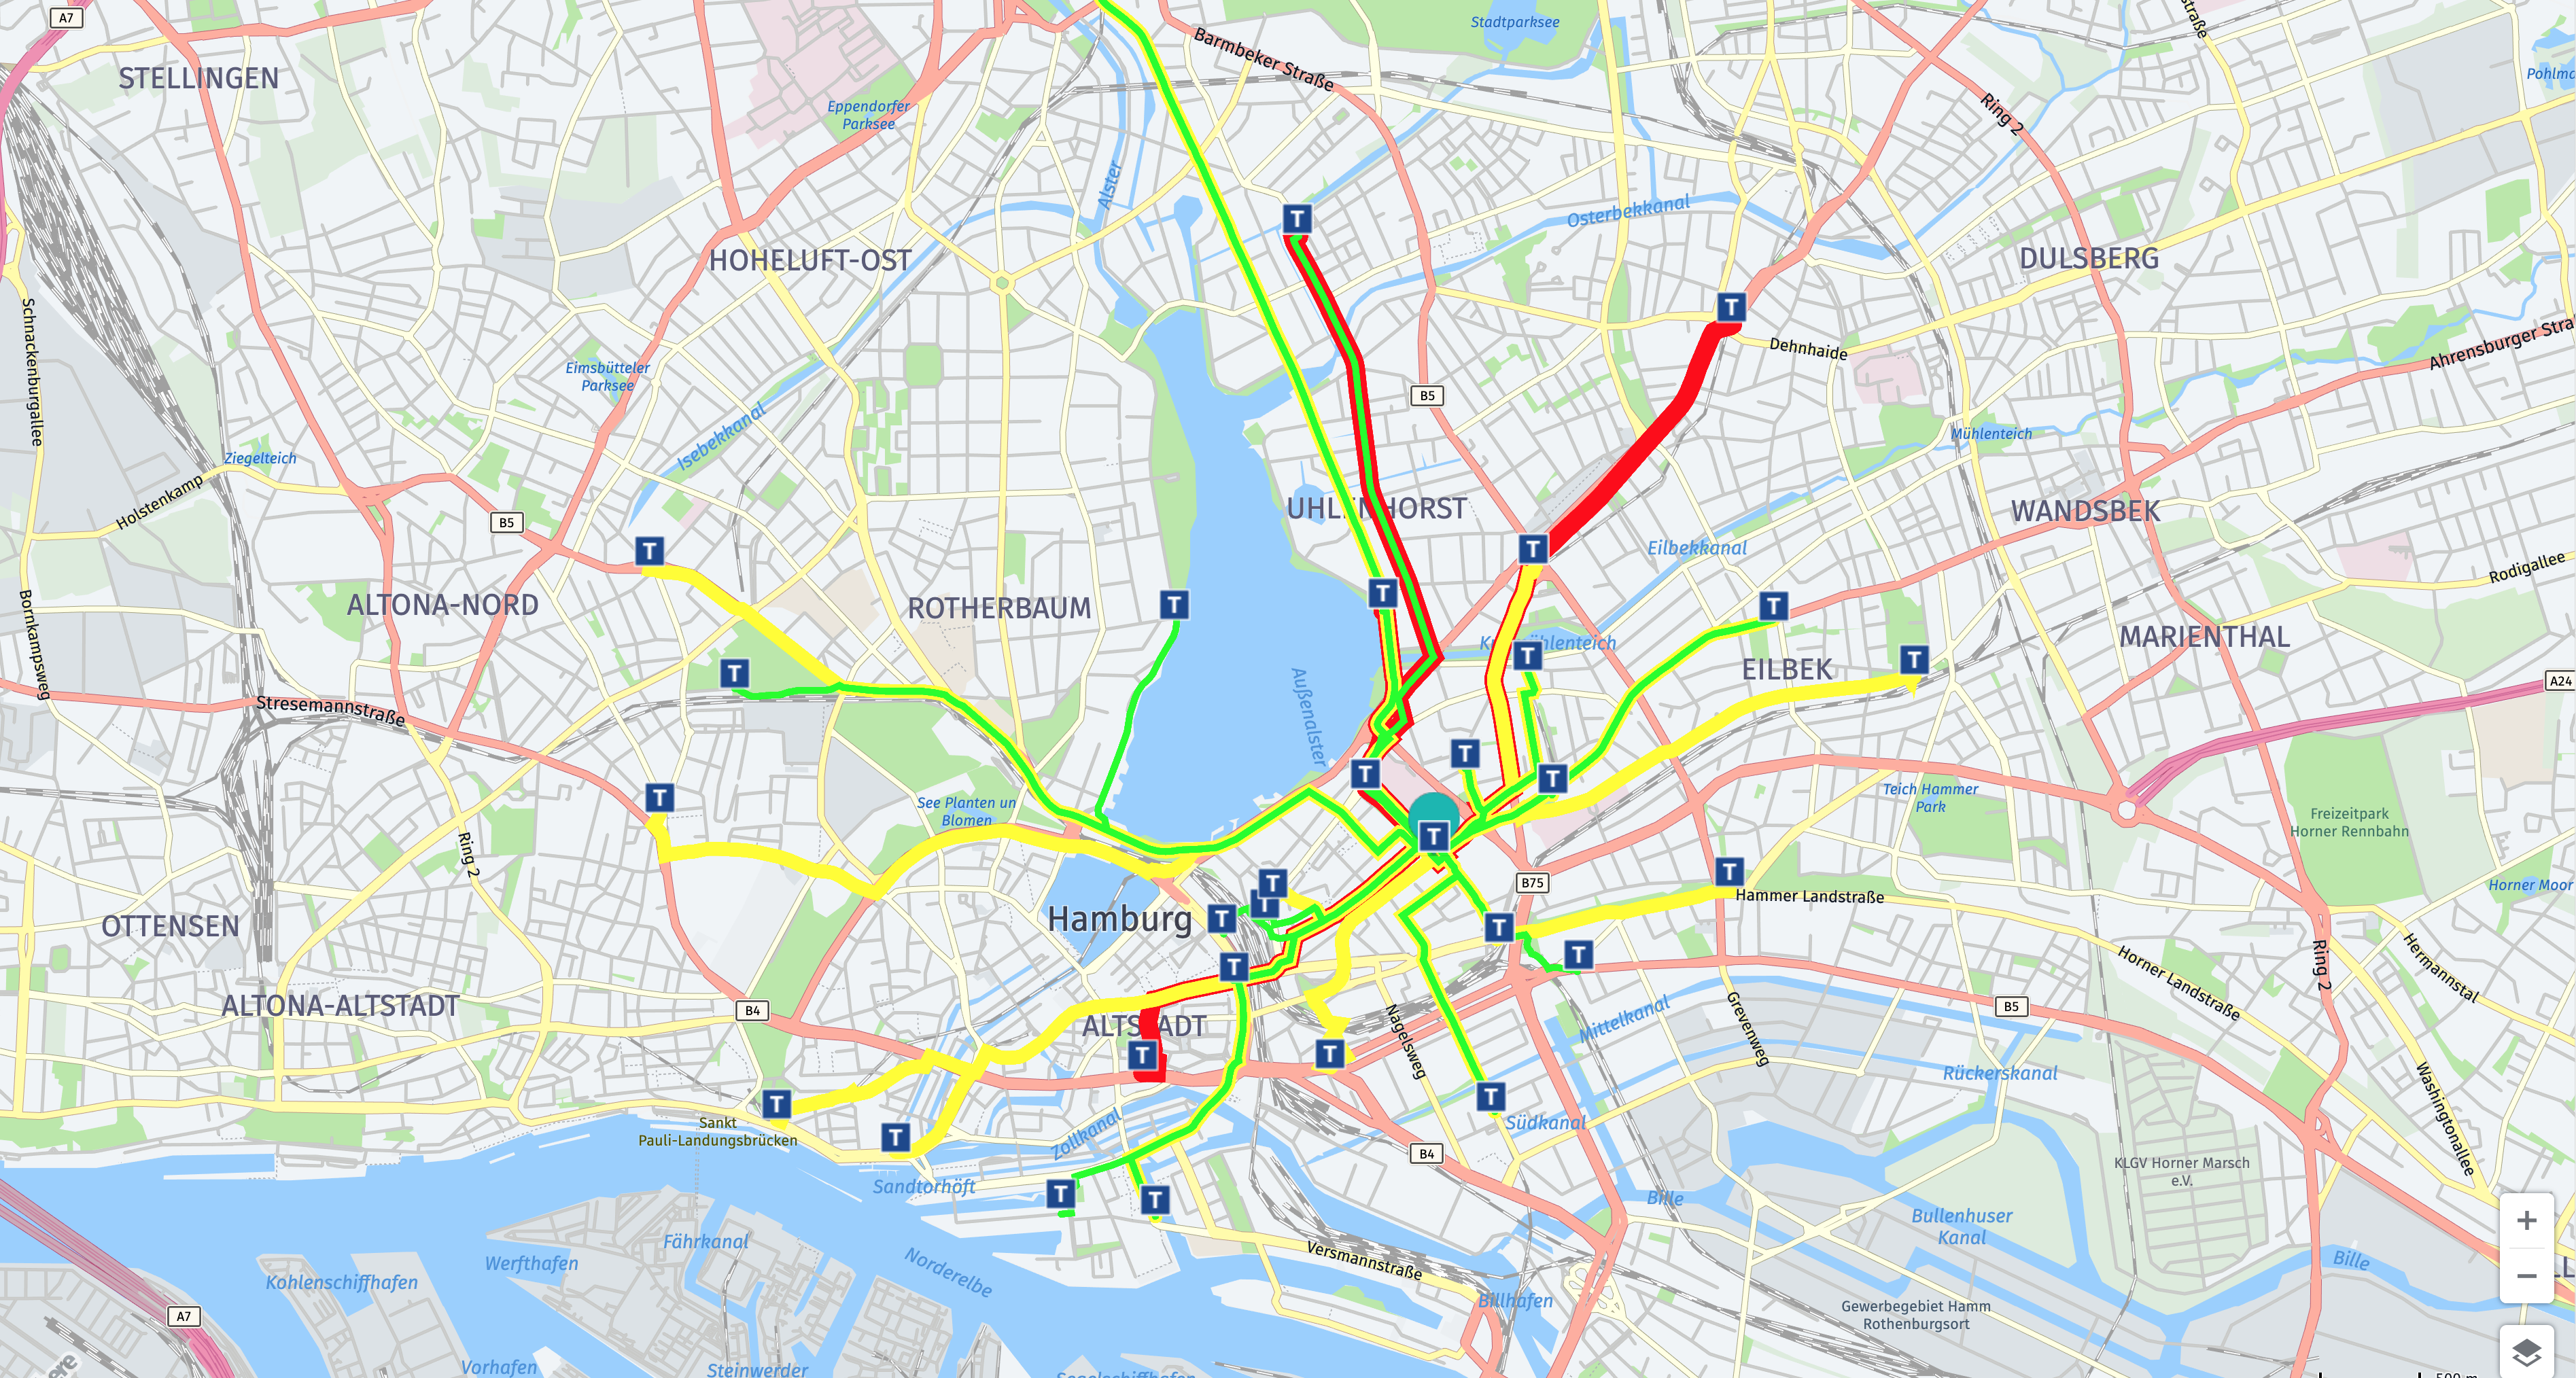
(2) Second Part of the MVP is a visualization of the rootes from the station to understand the relocation of the bikes during the day.
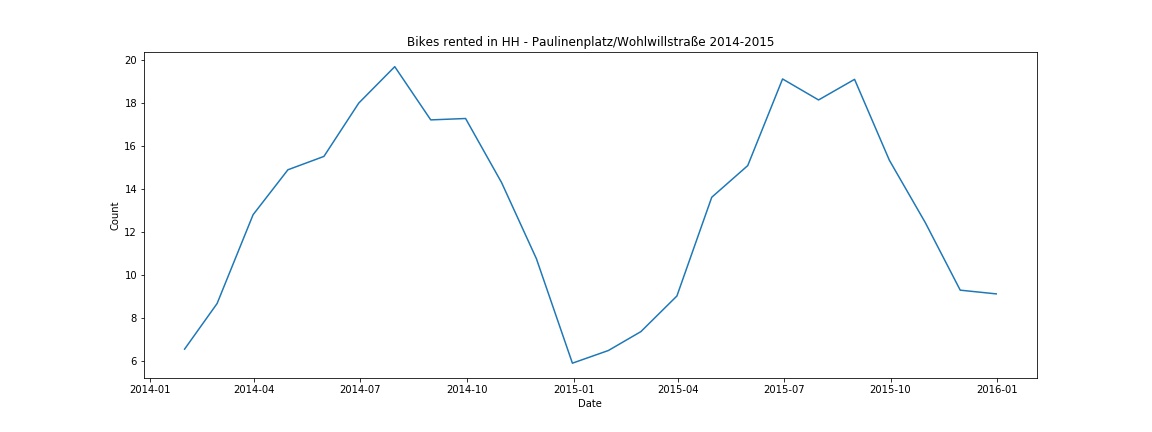
The seasonal demand for Call-a-Bike bicycles in Hamburg at Paulinenplatz as a representative example of the two years is illustrated below:
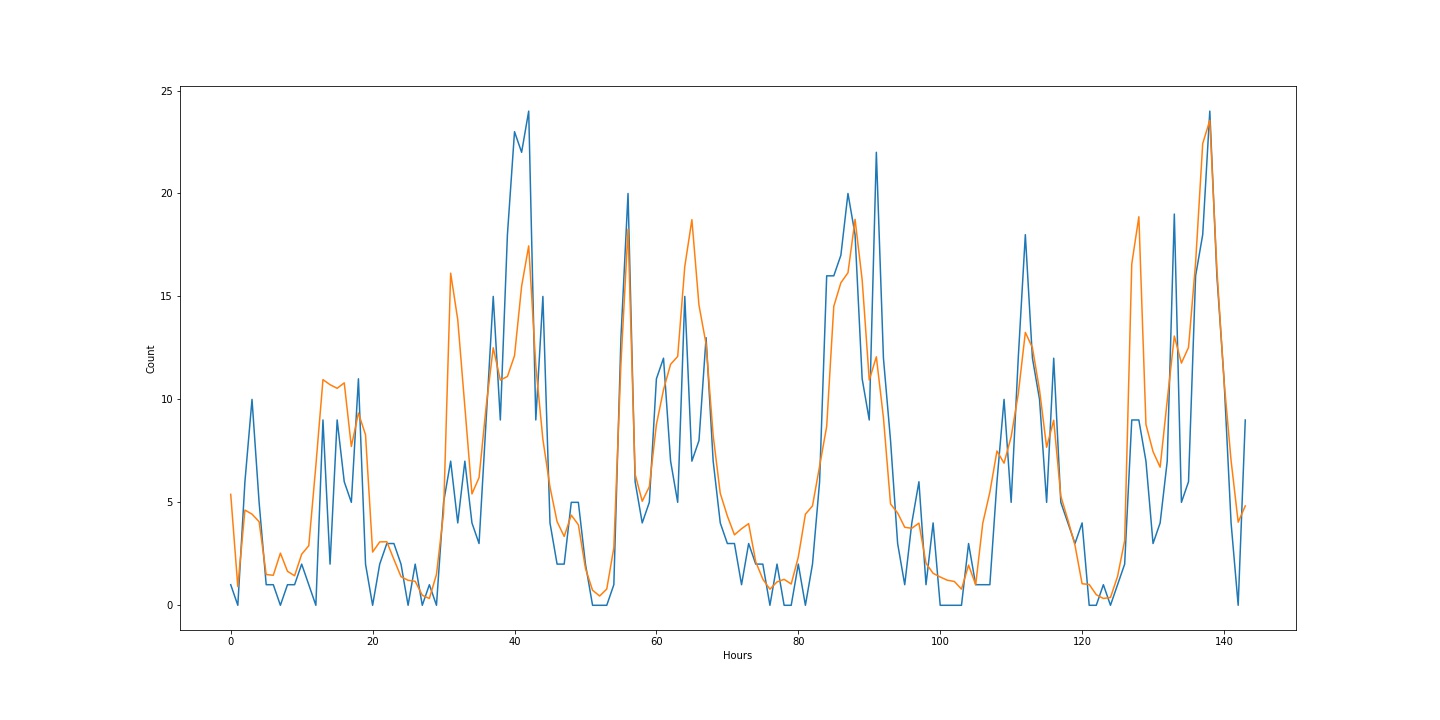
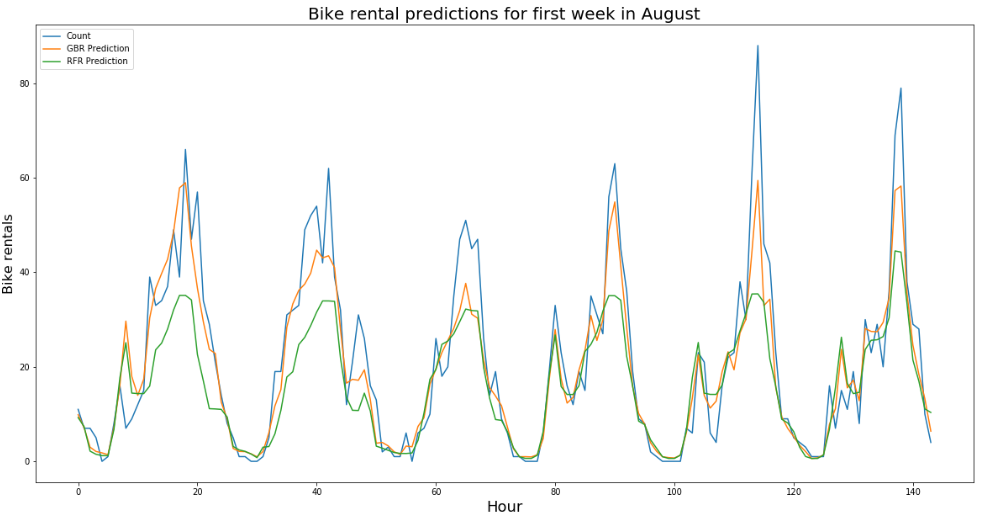
With the model (GradientBoostingRegressor GBR > RandomForestRegressor RF) we have predicted with 9 features the bookings of shared bicycles with an average accuracy of 74%.. The forecasting model provides a first good approach to real data after 24 hours of hacking, but can be improved by feature engineering and considering individual events with a large number of people as well as aggregating data from neighboring rental stations that are consolidated.
While the peak values are over-projected in January (first graph), the models forecast the peak values under-proportionally in August (second graph). The difference between GBR and RF is that RF anomalies are worse predicted in both examples.
The visualization in the form of a map shows the utilization of the paths used over time as well as the destinations to which the users go. This will help Operations Management to take into account how many bicycles have to be delivered at what time due to the use of the service.
OUTLOOK AND FUTURE PROJECT OPPORTUNITIES
Subsequent to this project, the information used for visualization could be used for a Operations Management System to obtain a dynamic forecast. In addition, events of human interest could be included as a feature (1) to enable event-driven distribution and (2) to improve the prediction model.
Built With
- jupyter-notebook
- machine-learning
- python

Log in or sign up for Devpost to join the conversation.