-
AndroidSnapShot
Inspiration:
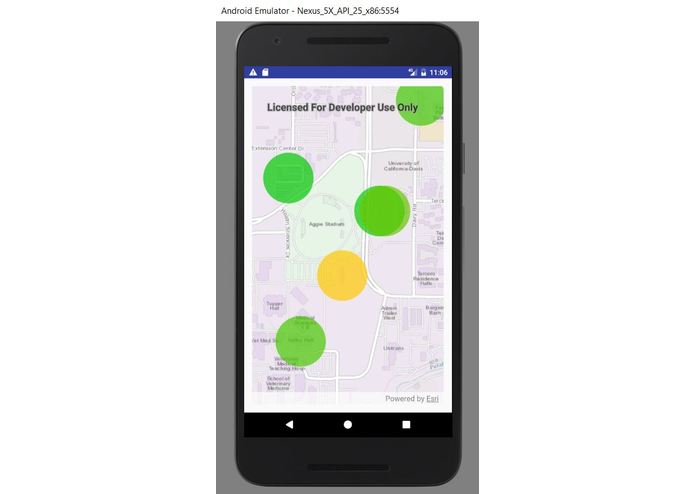
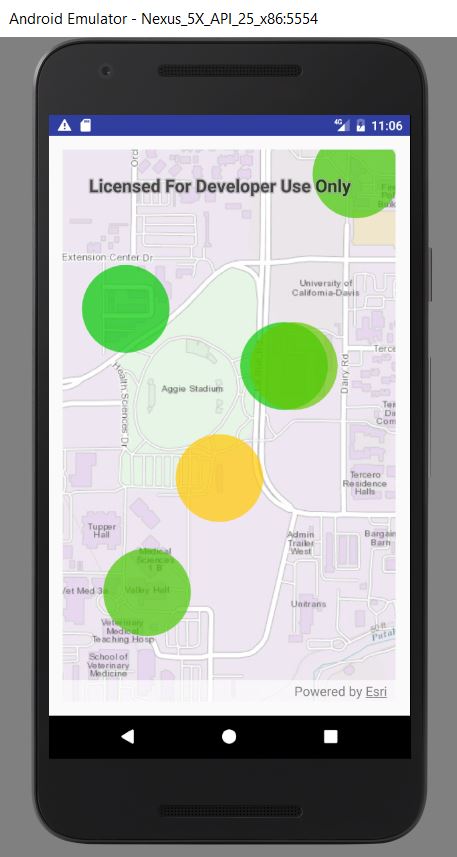
I wanted to build an app that will allow engineers to quickly determine which building is using an excessive amount of energy in one glance.
What it does:
Provide a quick visualization of each building's EUI usage as a color spot on the ArcgisAPI built map. All the data was acquired via OSISoftAPI
How we built it:
Parse JSON query of building name, EUI, longitude, latitude data into the android app via OSISoftAPI. Utilize Arcgis graphicOverlay to create spot on the map based on building location. Color of the spot correspond to the EUI level.
Challenges we ran into:
My 3 other team members left the team in the first 6 hours of the hackathon. Parsing the JSON query from OSISoftAPI was a challenge.
Accomplishments that we're proud of:
Finished the app. The visualization is working. Only nap for 20 min.
What we learned:
JSON parsing on android platform. API Calling. Minimalistic design
What's next for DavisPowerVisualizer:
Clean up the code. Fix the parsing processing so I can cut the background parsing running time. Acquire accurate data from OSISoft. Fix some of the null exception found in the data. Add additional analytics feature and push notification for energy alert.
Built With
- android
- arcgisapi
- osisoftapi


Log in or sign up for Devpost to join the conversation.