-
-

Datellx
-

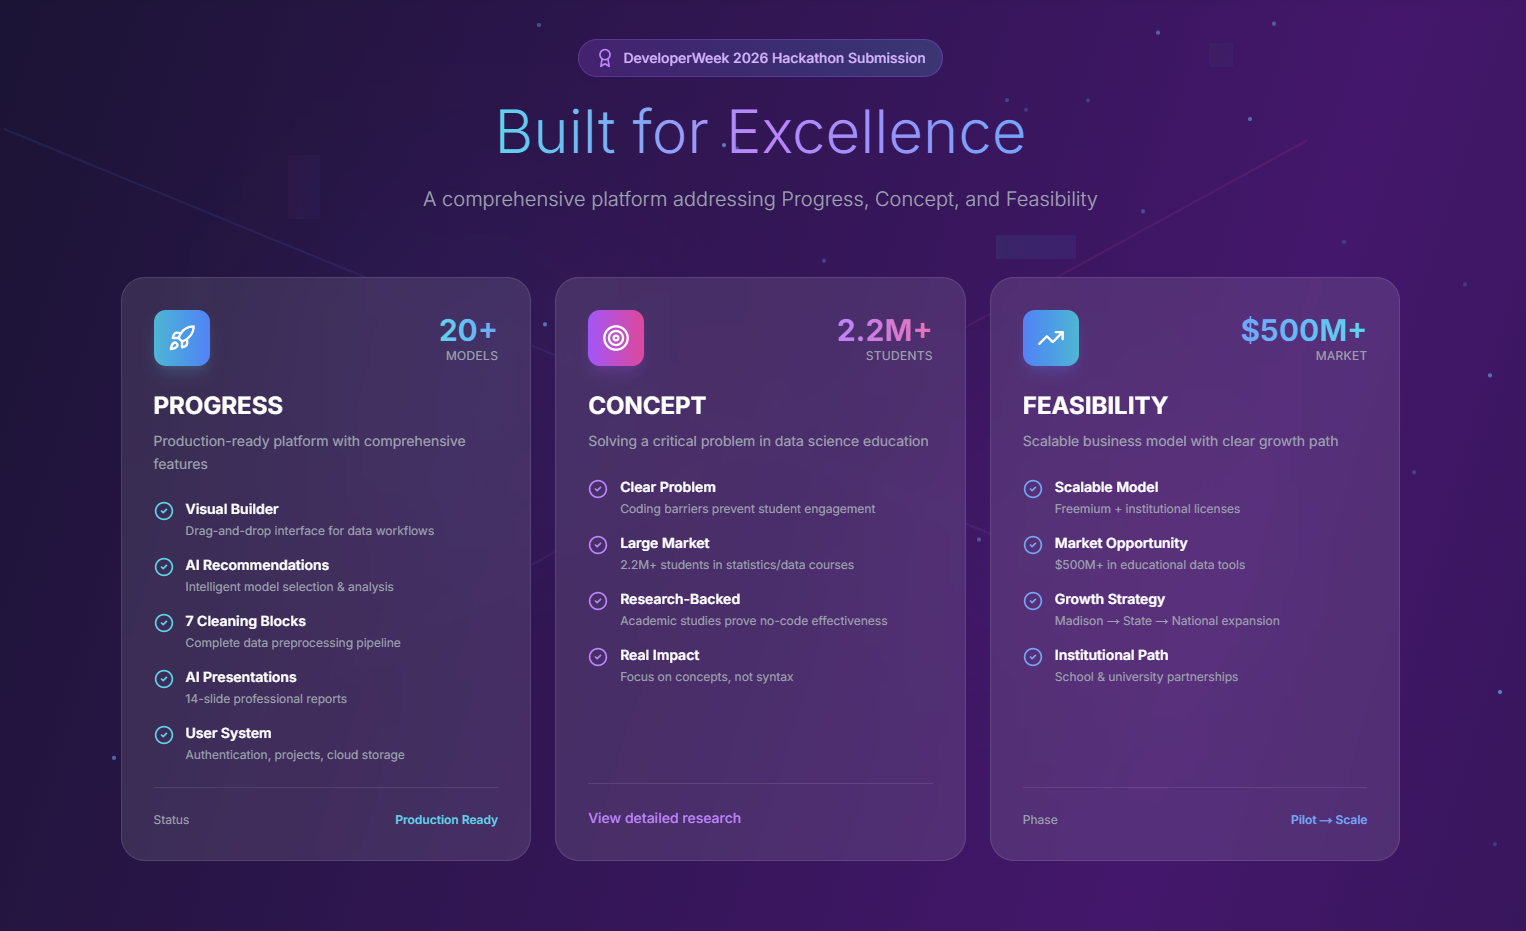
Progress Concept Feasibility
-
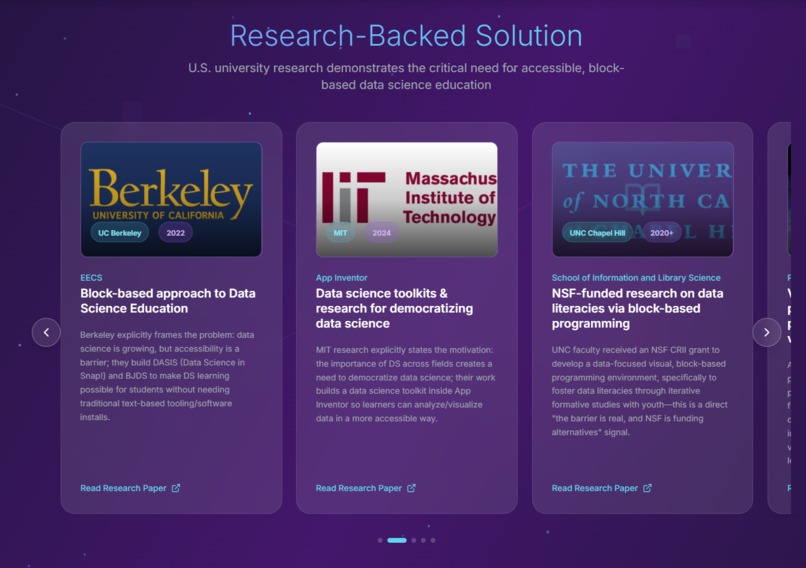
Research Backed Solution
-

Easy workflow
-
Simple AI Explanations
-
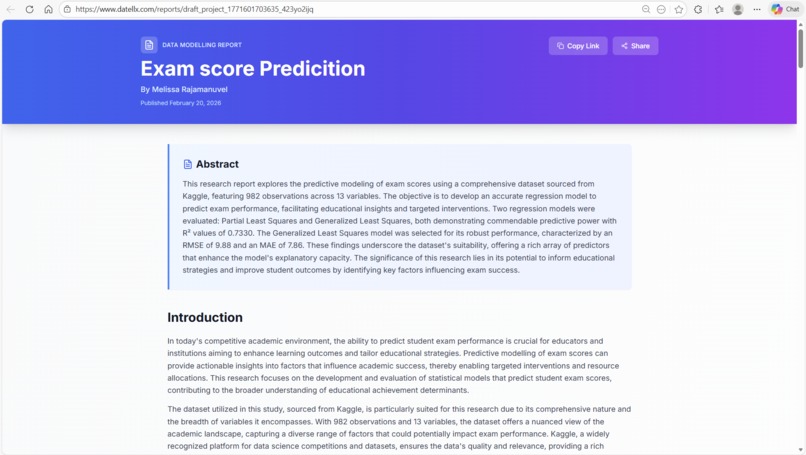
Sharable Website Report creation


ABOUT THE PROJECT
INSPIRATION
As a recent data science graduate, I learned a hard truth: the most commonly taught concept, regression, is only a small slice of data modeling. Even within that slice, there are over 105 regression models, each suited to different data types, assumptions, and decision contexts. Choosing the right model is not about writing 100 lines of code; it is about understanding when and why a model should be used to make real-world decisions. Yet most college coursework focuses heavily on coding rather than teaching how to explore models, compare them, and choose the right one.
Being a data scientist is not about writing code; it is about making smart modeling decisions. In practice, AI can already generate code and build pipelines, but it cannot replace human judgment, the ability to weigh tradeoffs, test assumptions, interpret results, and defend decisions that affect people and businesses.
This perspective is shared by leading institutions. Research from UC Berkeley shows that text-heavy programming can hinder learning, while MIT emphasizes accessibility and clarity so learners can reason about data and models, not just write code.
When I explored existing no-code data modeling platforms, I found that most were built for enterprise use rather than education. AutoML tools hide model selection behind buttons, dashboards miss core statistical thinking, and few platforms teach modeling as a true decision-making process.
This gap inspired Datellx: a production-ready, no-code data modeling platform designed to elevate thinking rather than replace it. By removing syntax barriers, Datellx allows learners to focus on reasoning about data, models, and real-world decisions.
WHAT IT DOES
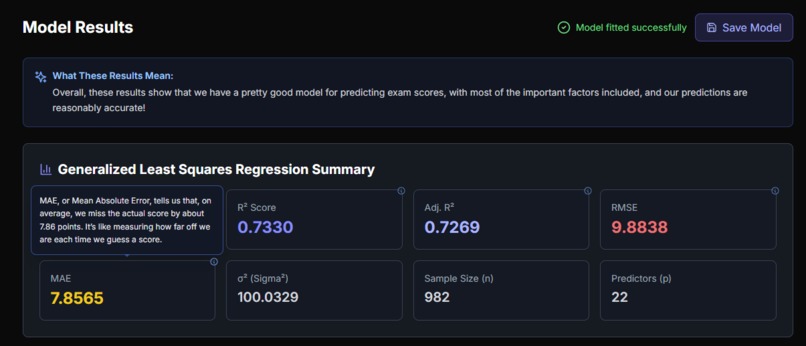
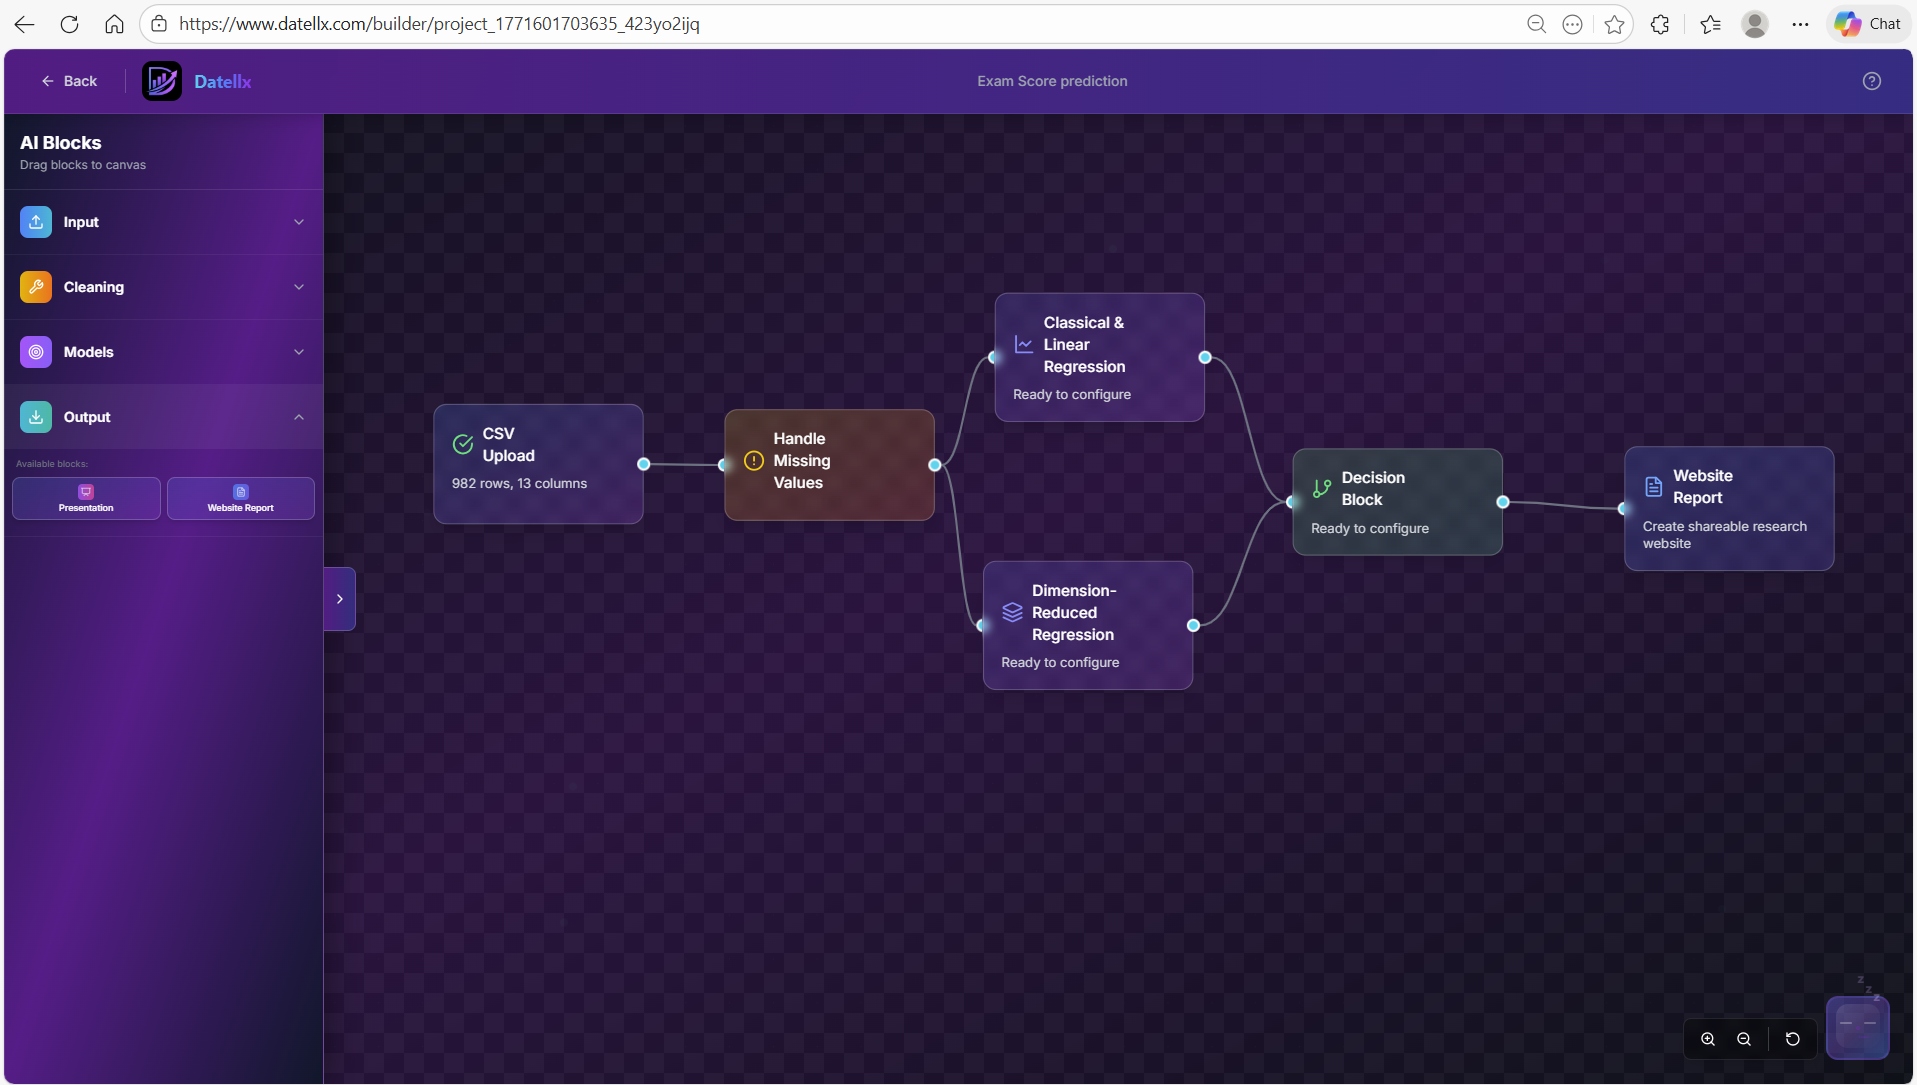
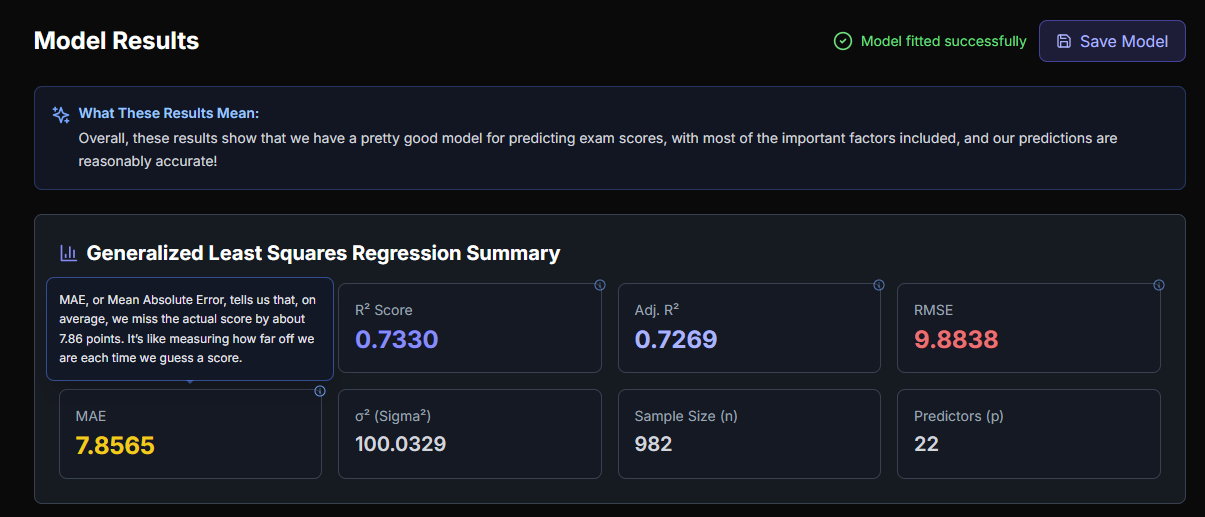
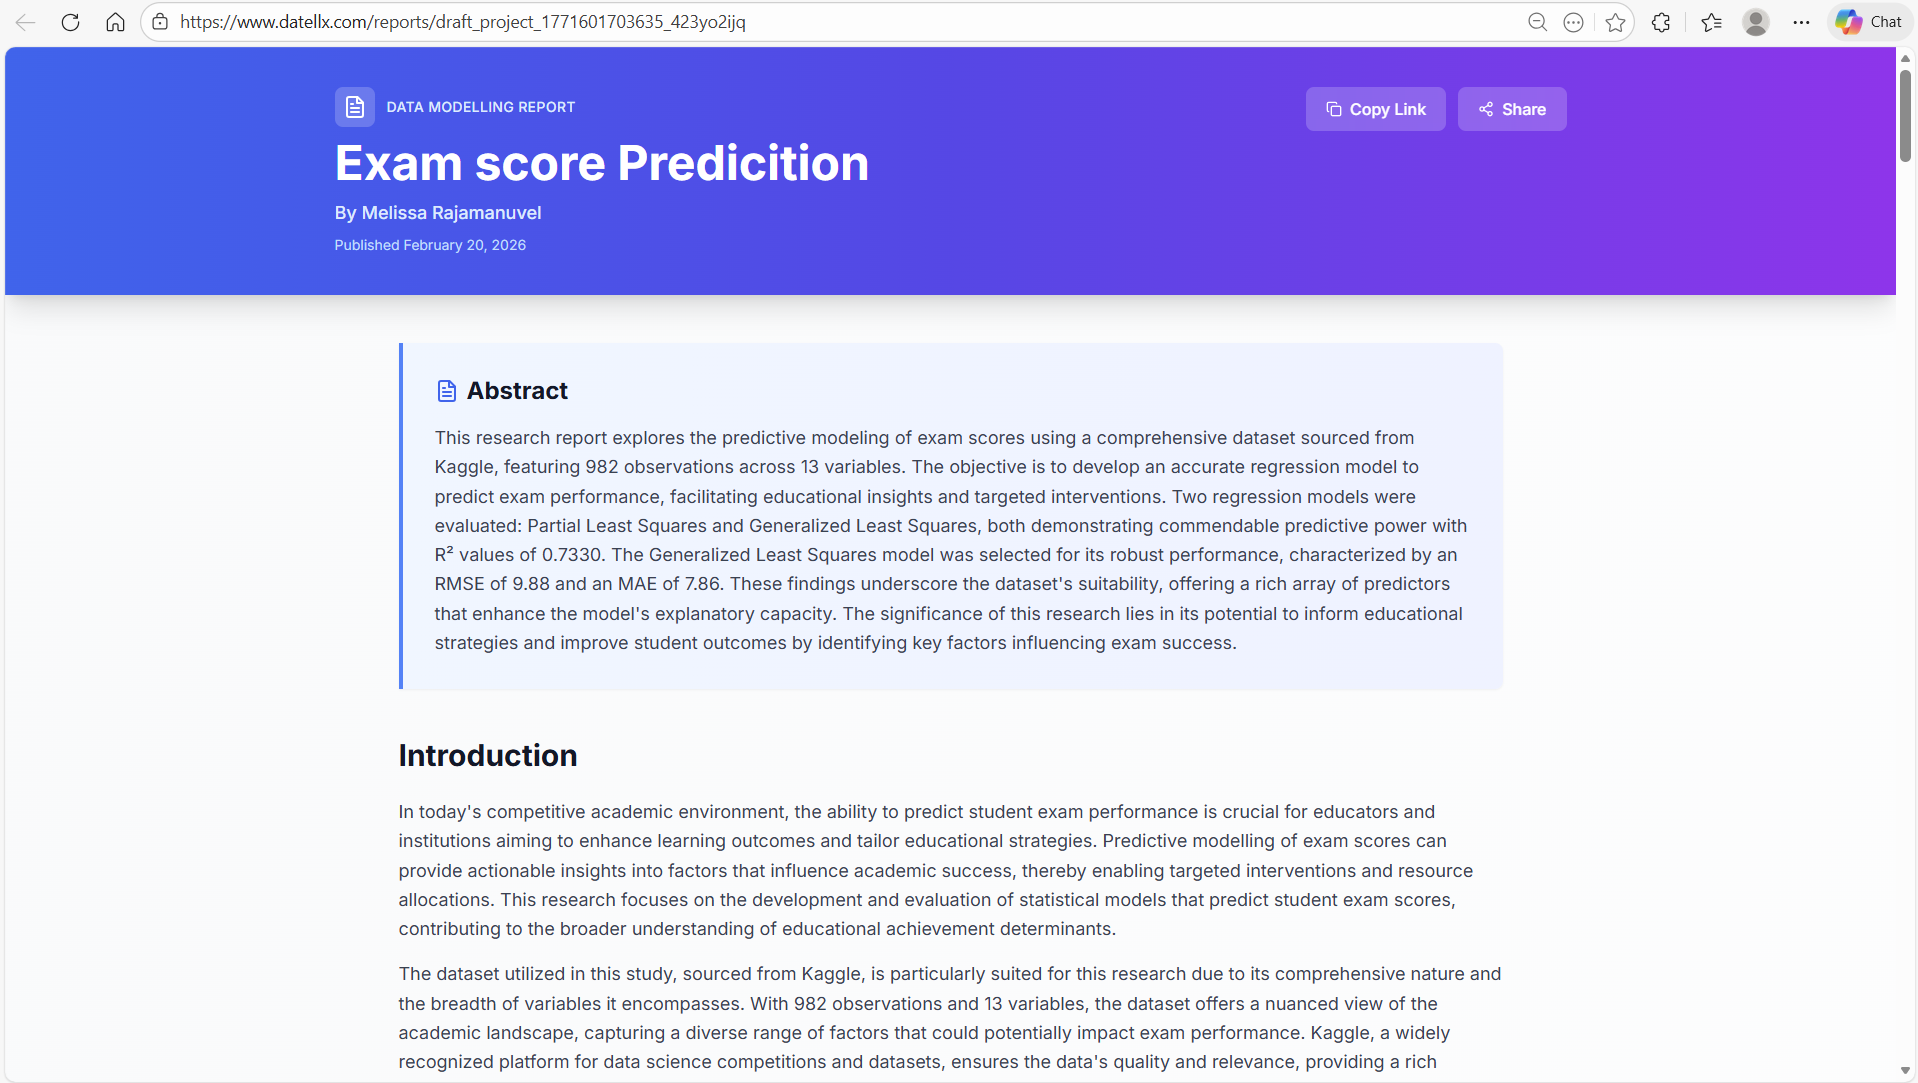
Datellx is a no-code platform that helps students learn data science without needing to program. Students upload their data like a spreadsheet, clean and organize it using visual tools, and experiment with many modeling approaches. Datellx automatically compares models, explains which one performs best and why, and generates a clear, professional report for class projects, presentations, or real-world decision-making. Everything happens through an intuitive drag-and-drop interface with saved projects and real-time results.
HOW IT WAS BUILT
Datellx was built as a full-stack web application with a strong focus on scalability, reliability, and educational usability. The frontend uses a visual, node-based workflow system that mirrors real data pipelines, where each block processes data independently and passes results forward. The backend handles secure authentication, cloud storage, and project persistence, while a dedicated machine learning service trains and evaluates regression models. AI-powered features support light guidance and research discovery. The entire platform is fully deployed and hosted, ready to scale from individual learners to institutions.
CHALLENGES I RAN INTO
Designing an intuitive visual interface was a major challenge. Each block needed to visually communicate how it transformed data. I addressed this through extensive iteration using custom block designs, color-coded categories, and real-time visual feedback.
Another challenge was creating digestible micro-lessons for complex concepts like multicollinearity and R-squared. I solved these using tooltips, inline explanations, and progressive disclosure so students can access deeper explanations only when needed.
ACCOMPLISHMENTS
- Production-ready platform deployed at www.datellx.com
- 7 data-cleaning blocks, 20+ regression models, and an automated decision engine
- AI-generated research reports and presentations
- Complete user system with saved projects and cloud storage
- Professional, responsive UI/UX
- 6 early student users actively using Datellx
- Formed an LLC in Wisconsin
- Scalable architecture designed for institutional adoption
WHAT I LEARNED
Removing coding barriers does not mean simplifying concepts, it means designing interfaces so intuitive that students can focus on understanding regression and model selection rather than debugging syntax. Visual workflows help learners understand data pipelines more effectively than traditional code-first approaches. Early student usage and educator conversations confirm strong demand for model-first learning.
WHAT’S NEXT FOR DATELLX
Datellx is expanding beyond regression into clustering, classification, time series analysis, and reinforcement learning, building on the same visual workflow system. Free student beta users are onboard to validate usability and learning outcomes before monetization. The initial paying customers will be educational institutions, licensing Datellx as a teaching platform while students receive free access through their school.
The long-term goal is to serve 500+ institutions and 50,000+ students globally within three years, expanding beyond tabular data to image, video, and audio modeling. With over 2.2 million data science students globally and an estimated $50 ARPU through institutional licensing, Datellx represents a $110M+ addressable market.
Built With
- firebase
- gemini
- javascript
- ml-matrix
- next.js
- openai
- papaparse
- pinecone
- react
- typescript
- vercel


Log in or sign up for Devpost to join the conversation.