-
-
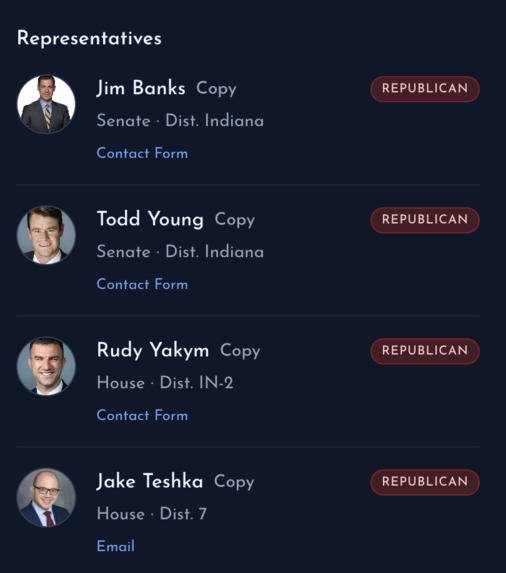
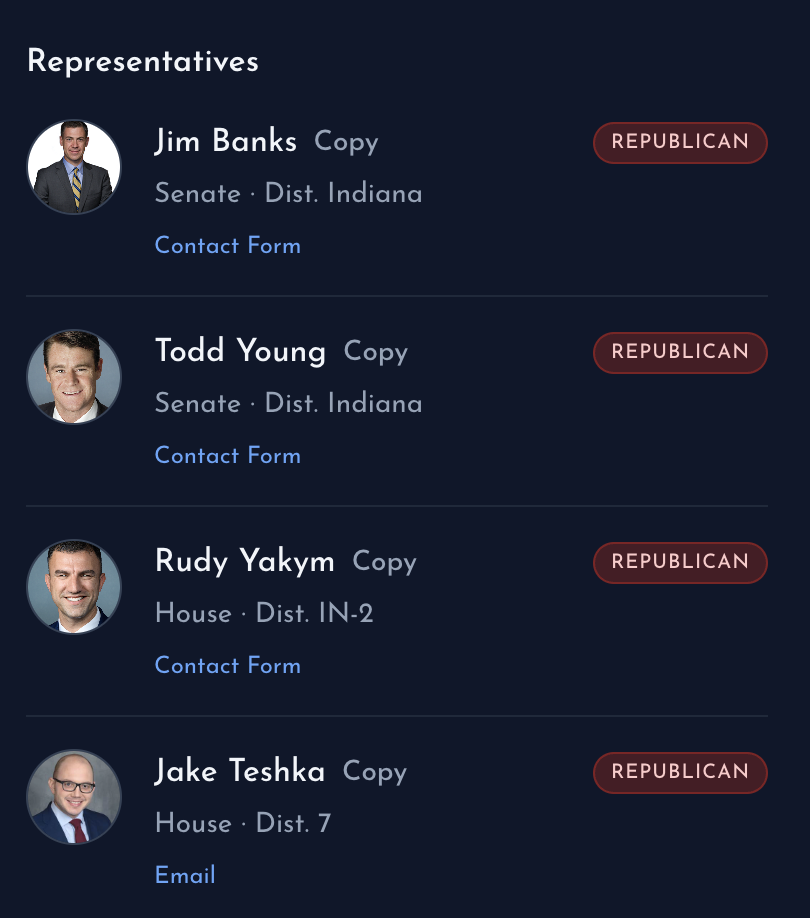
Find the senators and representatives in your area
-
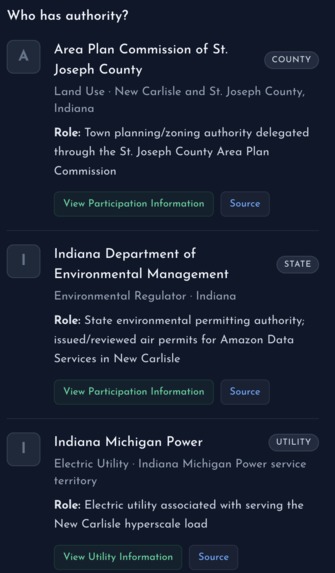
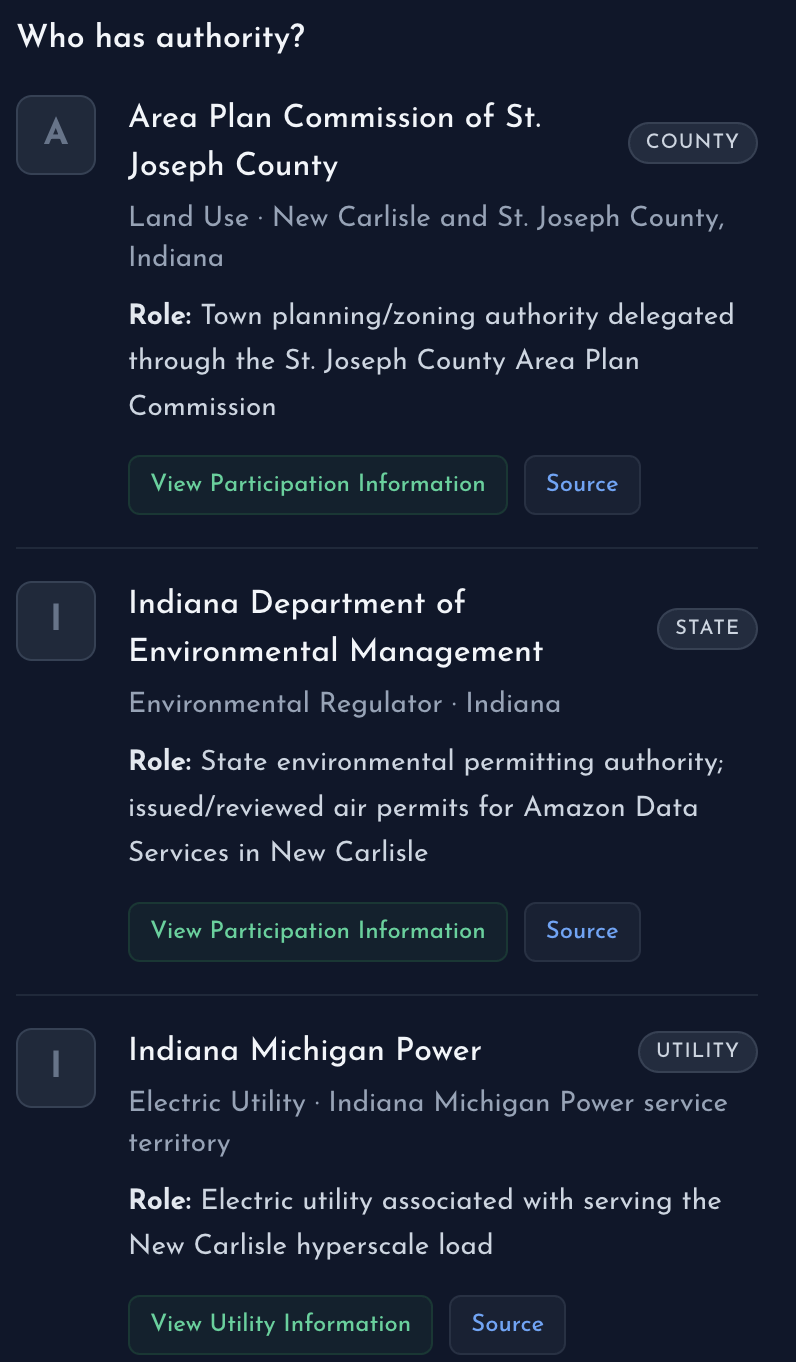
Find the local governing bodies
-
-
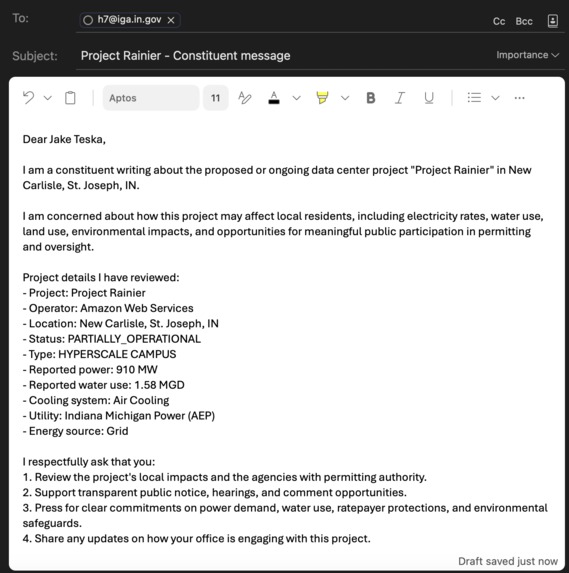
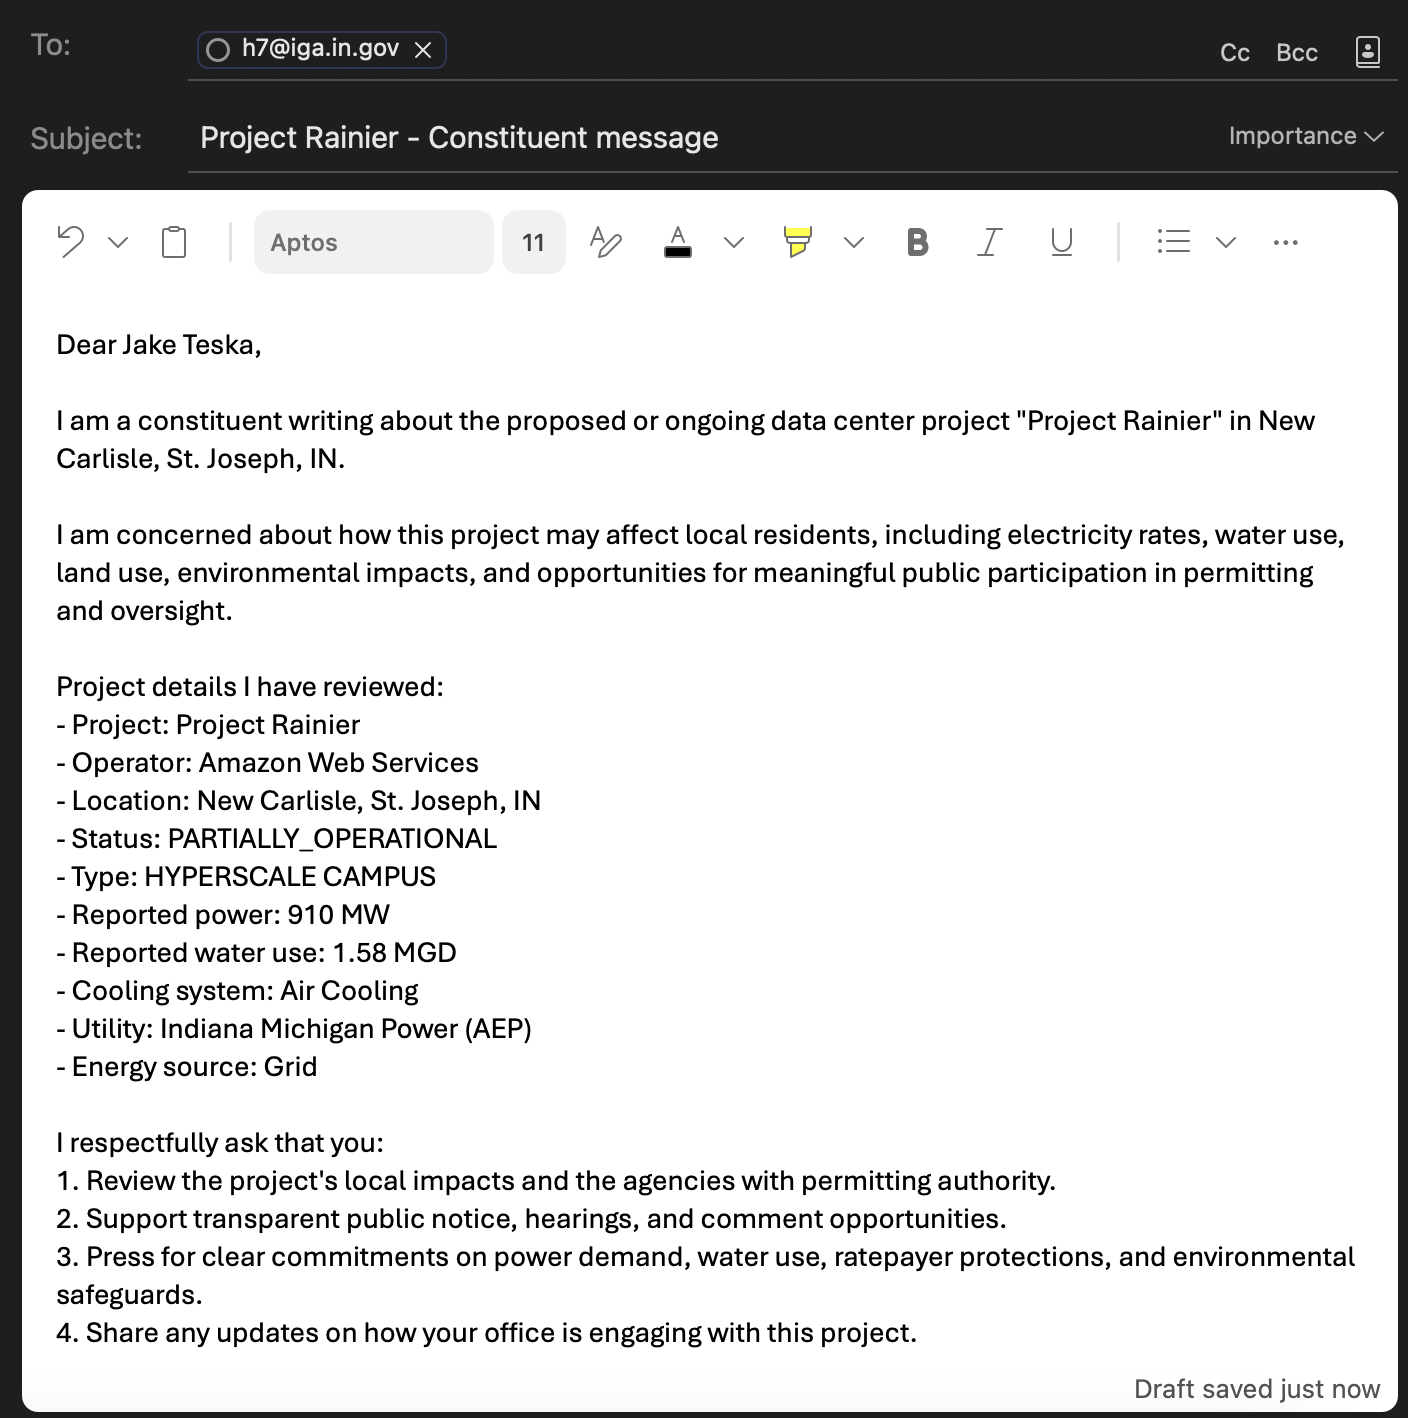
Click on a constituent's contact to send them an emai directly
-
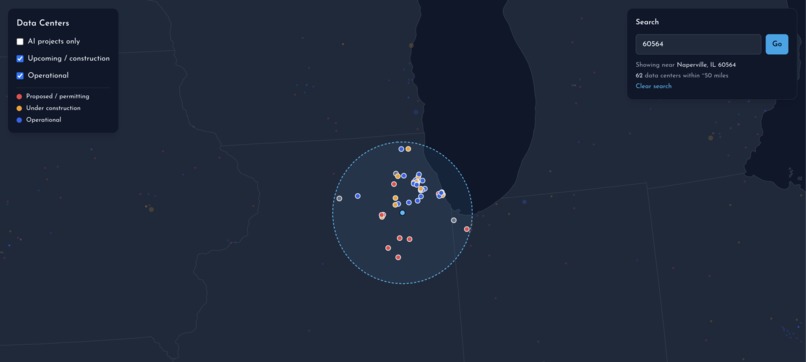
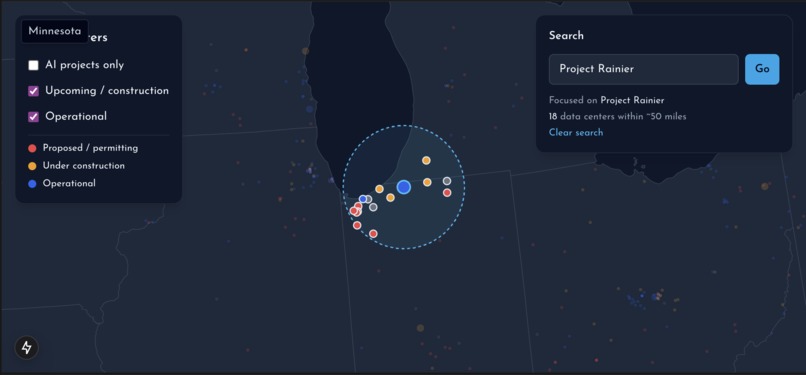
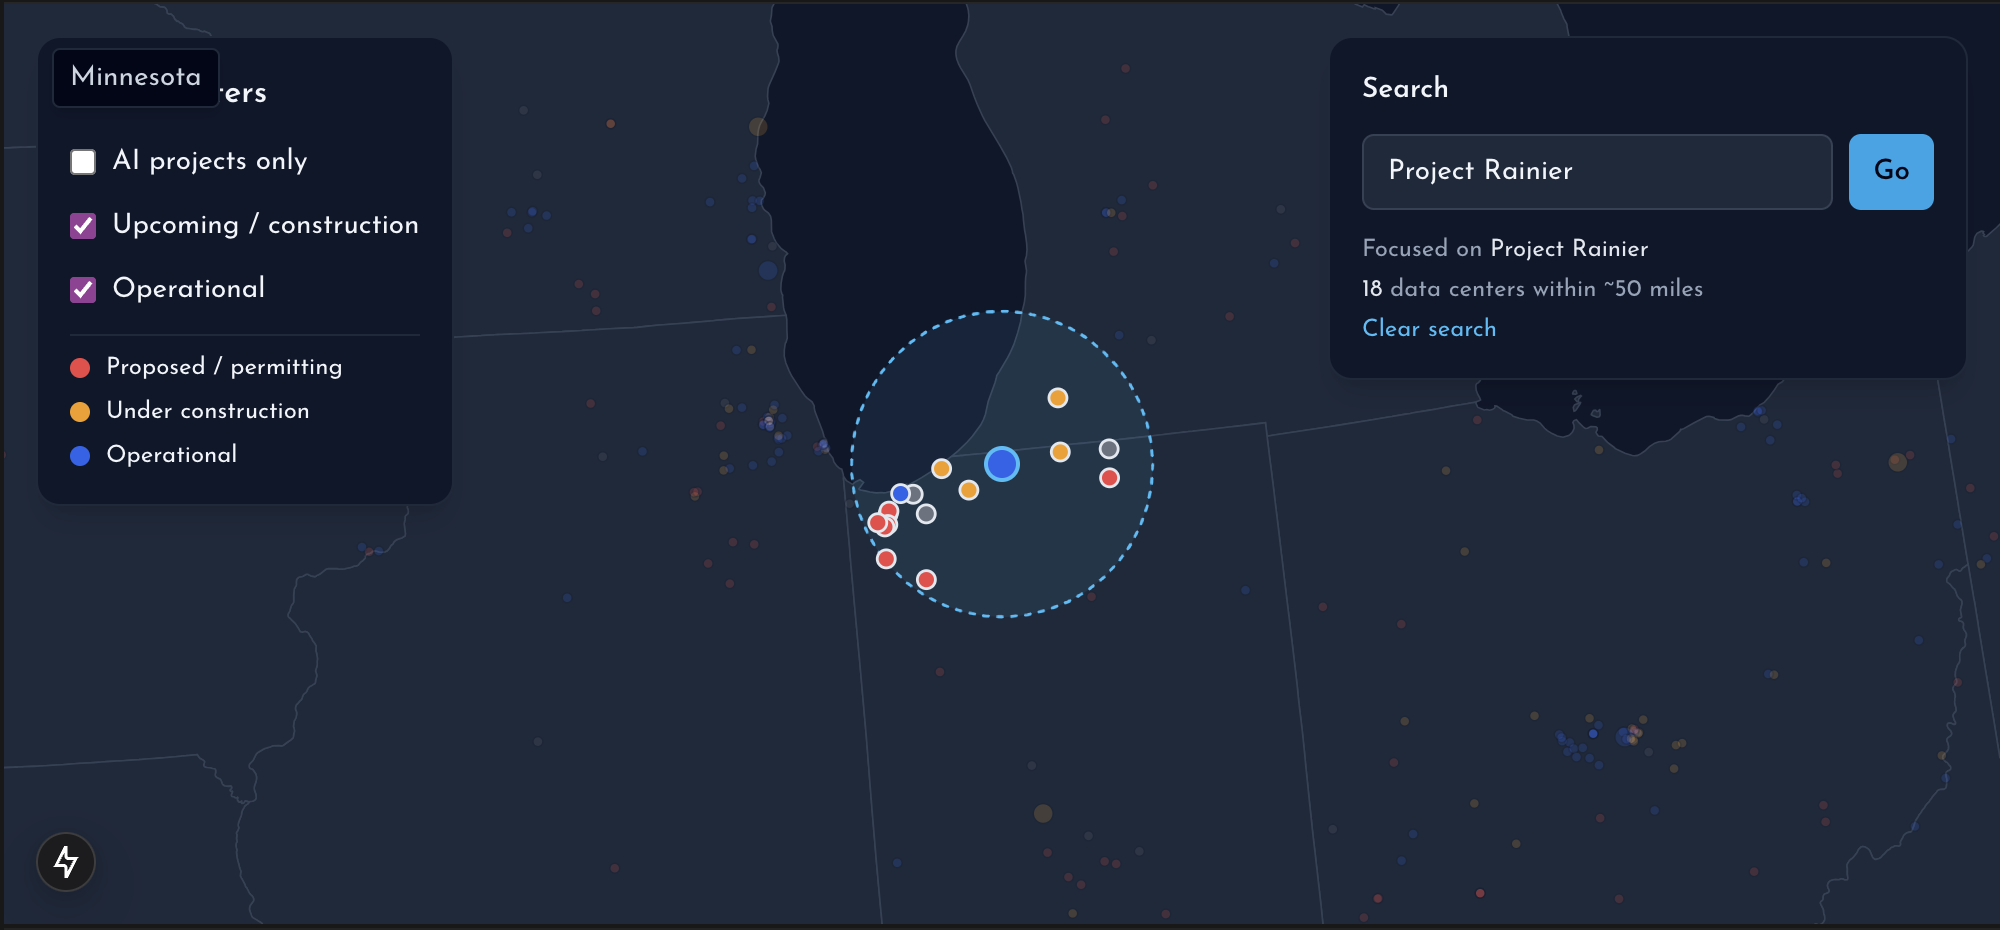
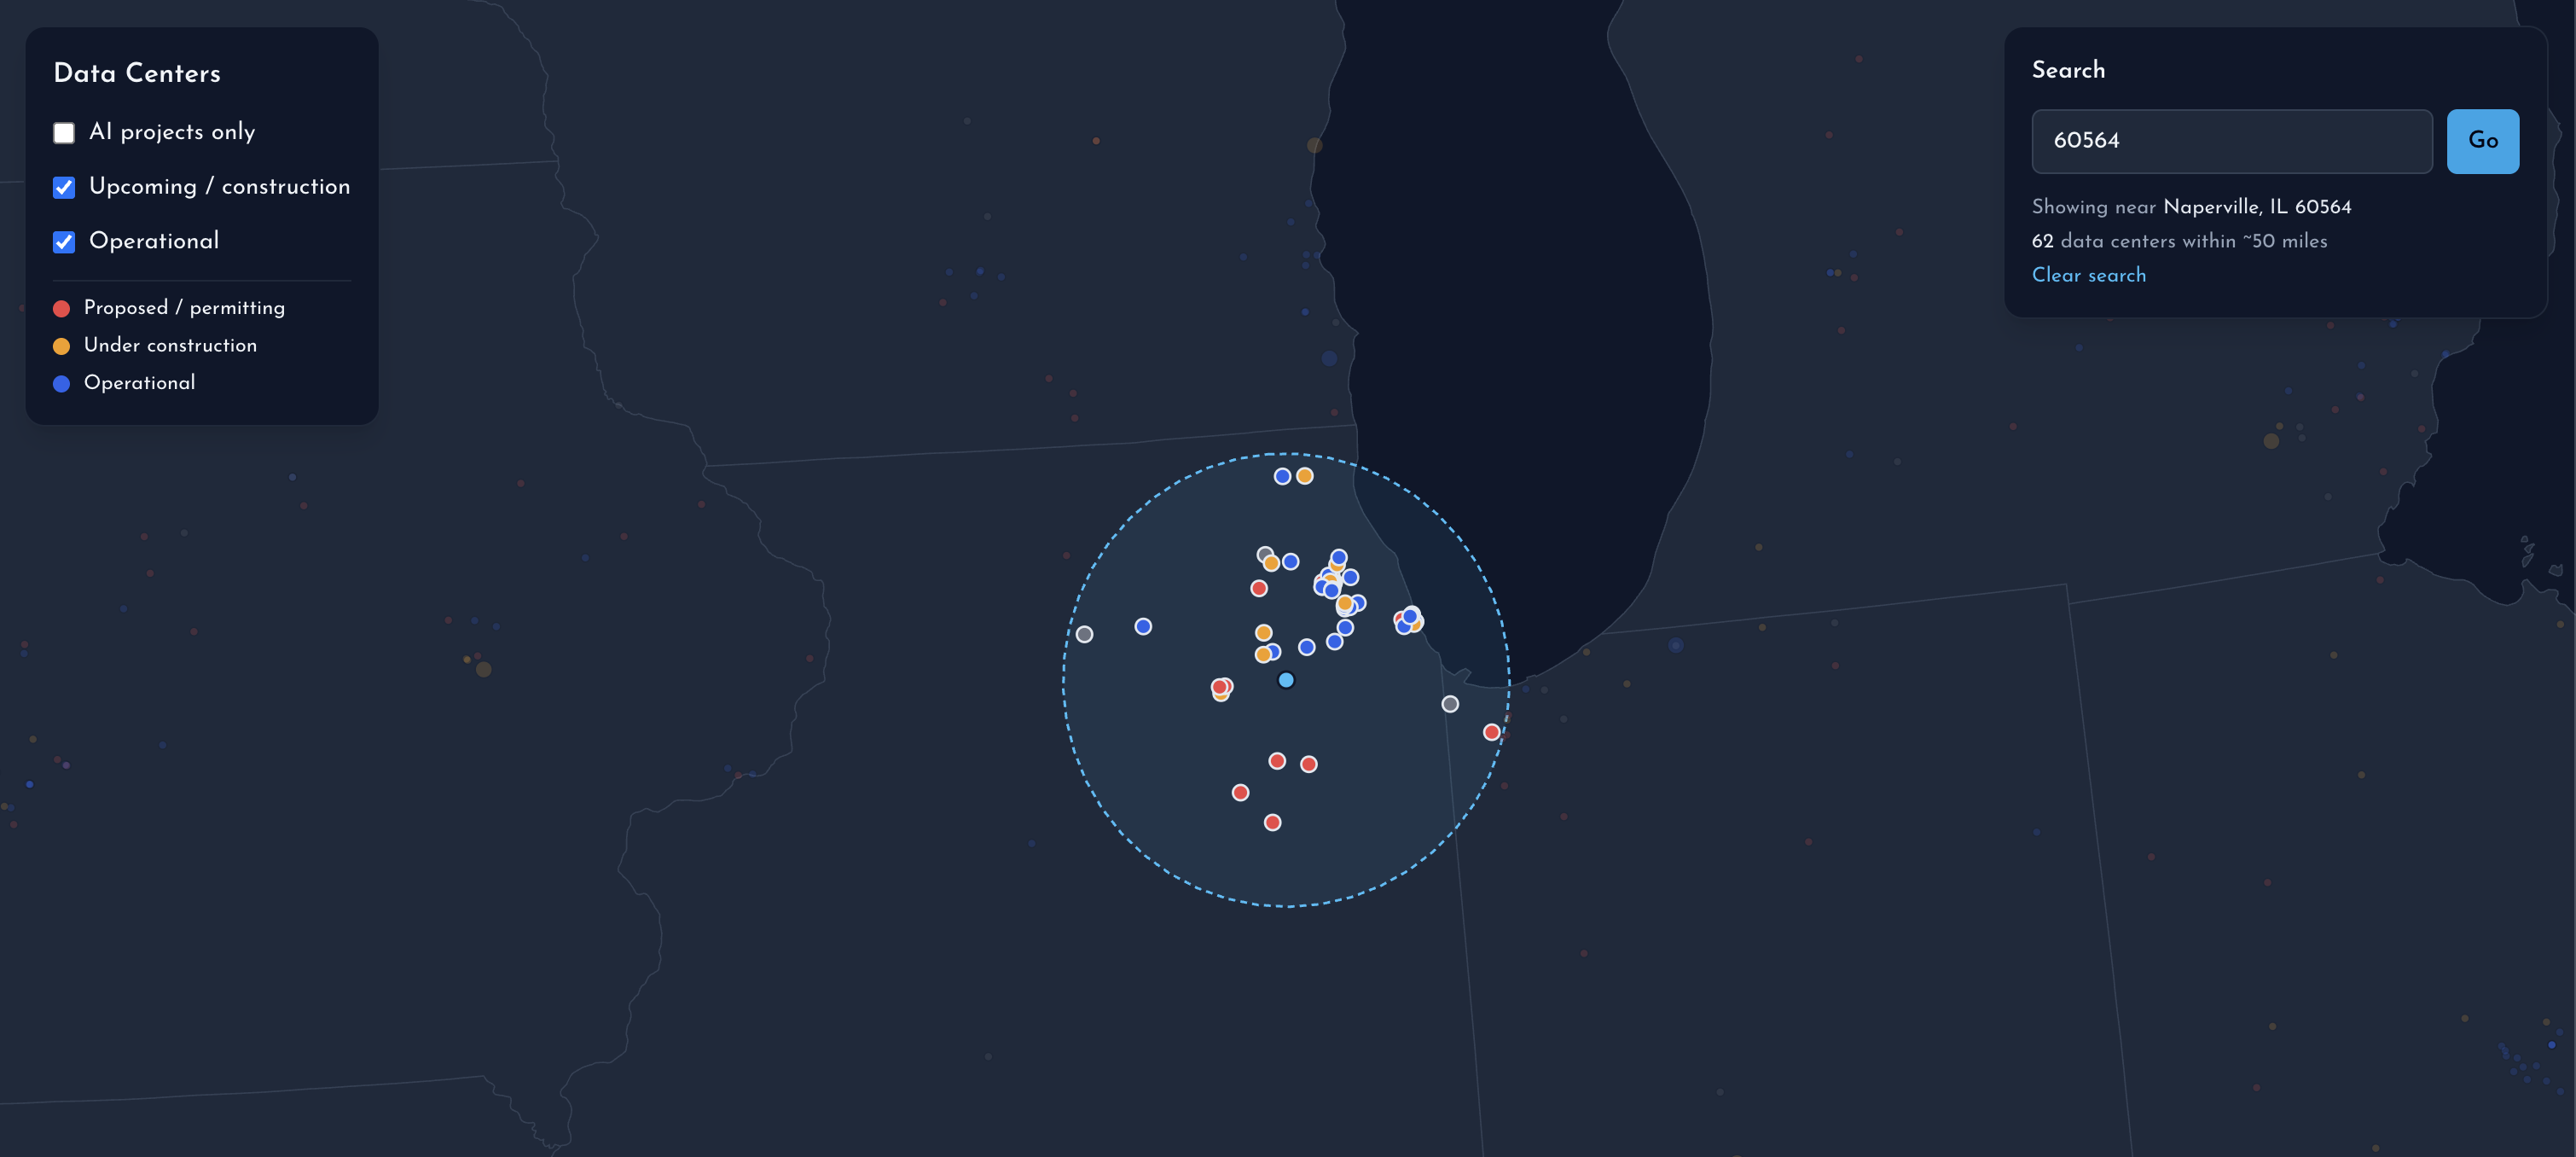
Find the datacenters near you by zipcode
Inspiration
AI infrastructure is growing quickly, but the physical impact of that growth is easy to overlook. We wanted to make it easier to see where data centers are being built, what resources they use, and who is involved in decisions around them.
What it does
DataWatch maps existing and planned AI data centers across the U.S. Each project includes details like status, power capacity, water use, cooling, investment, and energy source. Users can also see the federal and state representatives for that location, along with relevant local planning bodies, environmental regulators, utilities, and public participation links where available.
How we built it
We combined multiple public data-center datasets, normalized their fields, and matched overlapping projects using location, state, operator, and fuzzy name matching. We used OpenStates to map each data center’s coordinates to its elected representatives, then added researched authority data for major AI campuses. The frontend uses React, TypeScript, and D3 to render the projects on an interactive U.S. map.
Challenges we ran into
The biggest challenge was that the data is fragmented and inconsistent. Different sources used different project names, coordinates, statuses, and classifications, so we had to clean and reconcile records carefully. We also ran into API rate limits while querying representative data and had to build caching and resume logic so partial progress was preserved.
Accomplishments that we're proud of
We were able to combine more than a thousand data-center records into one usable dataset and connect hundreds of projects to their federal and state representatives. We also went beyond a basic map by showing which institutions actually have authority over major projects, including planning commissions, environmental agencies, utilities, and utility regulators.
What we learned
We learned how complicated infrastructure governance is. A single data center can involve local zoning authorities, state environmental agencies, utilities, public utility commissions, and elected officials, all with different roles. We also learned how important data provenance and uncertainty are when combining infrastructure datasets.
What's next for DataWatch
Next, we want to expand authority and public-participation coverage to more projects, add live permit and hearing information, and provide clearer environmental context such as grid emissions and local water stress.

Log in or sign up for Devpost to join the conversation.