-
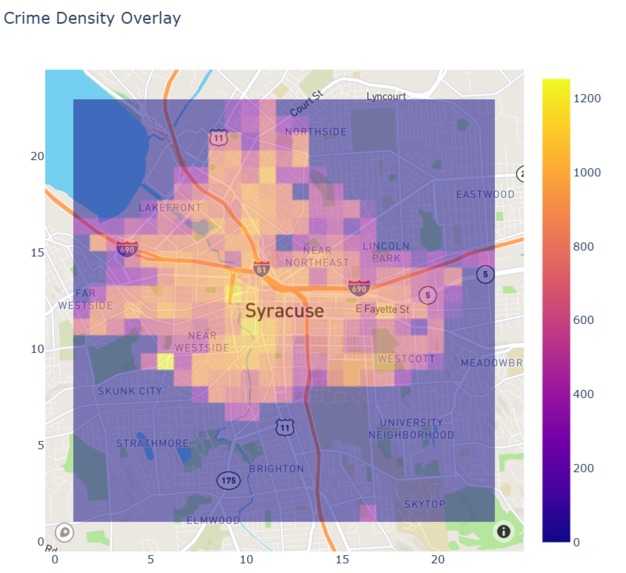
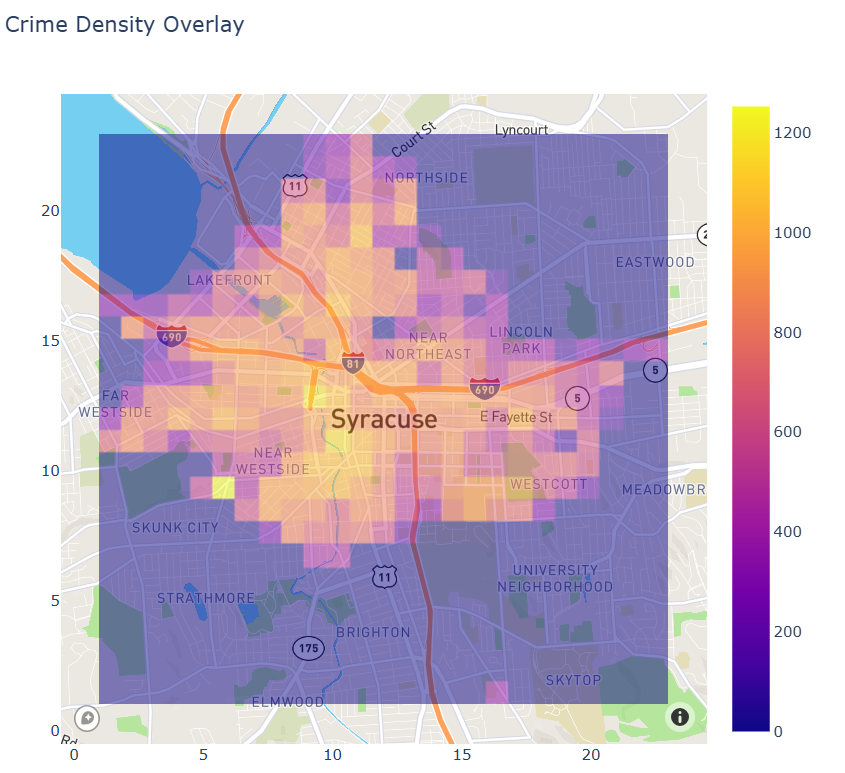
General crime map
-
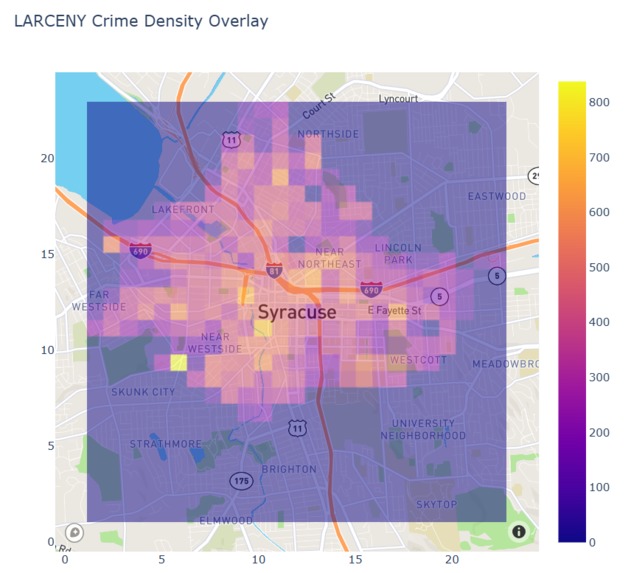
Larceny map
-

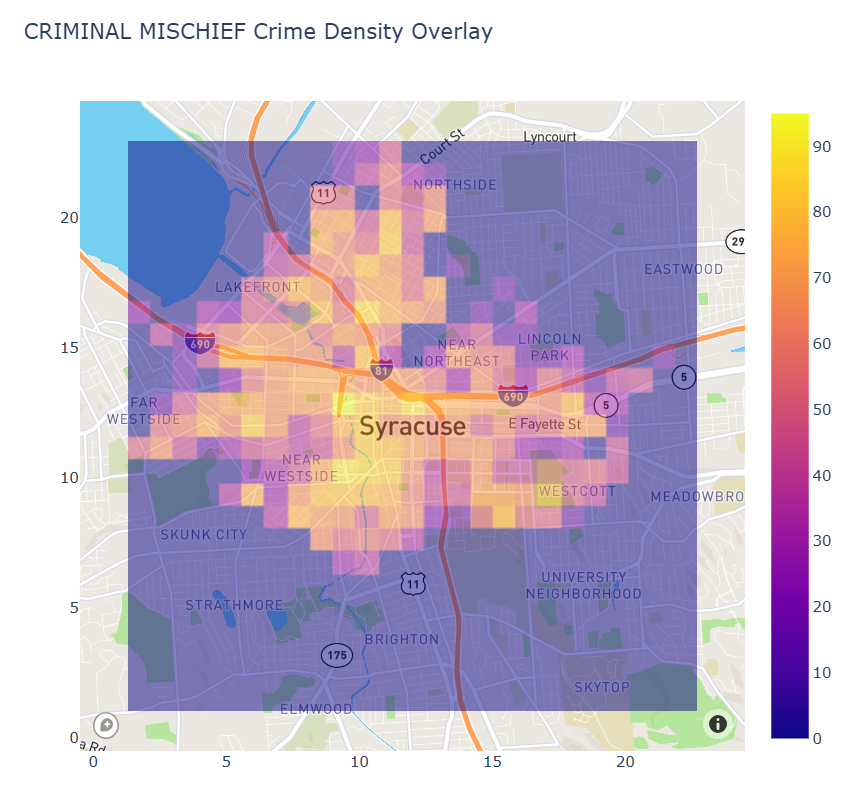
Criminal mischief map
-
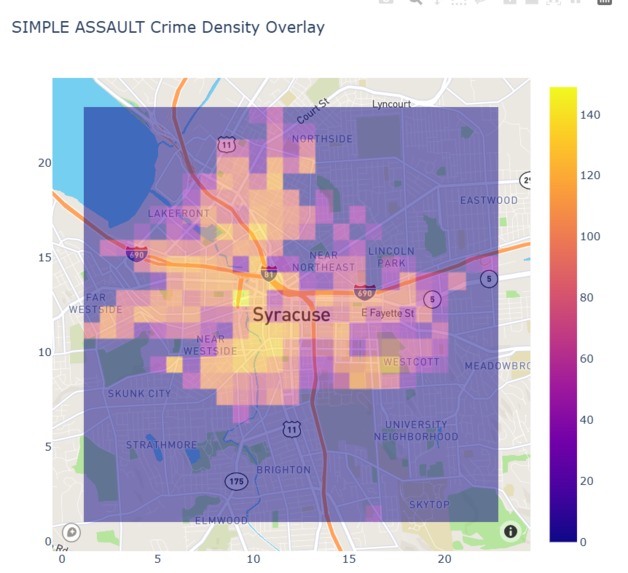
Simple assault map
-

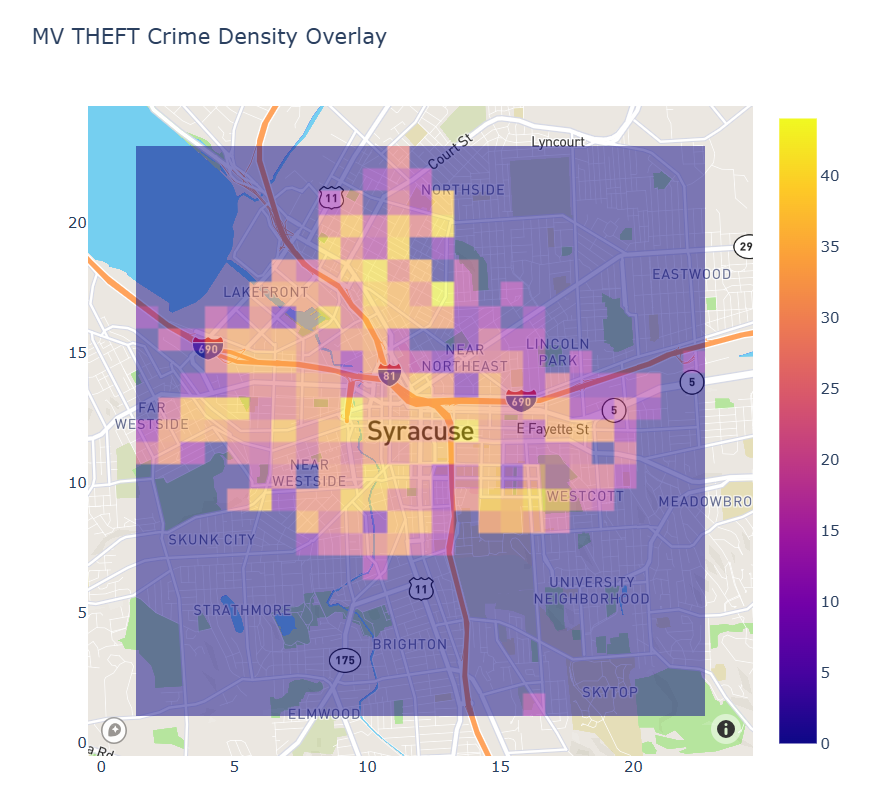
MV theft map
-
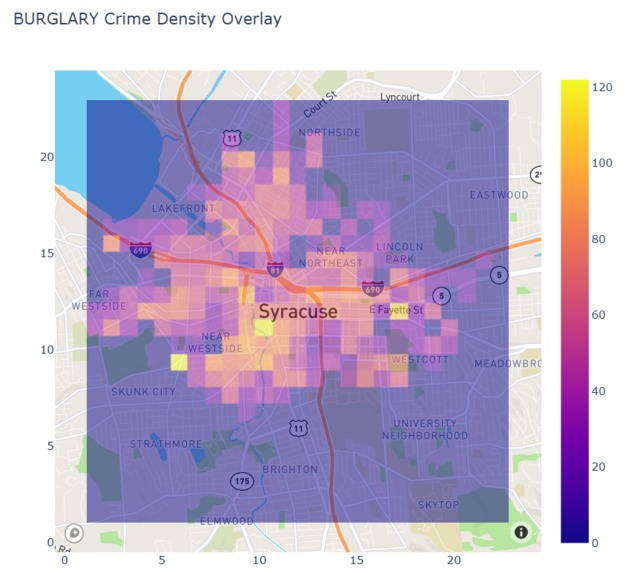
Burglary map
-

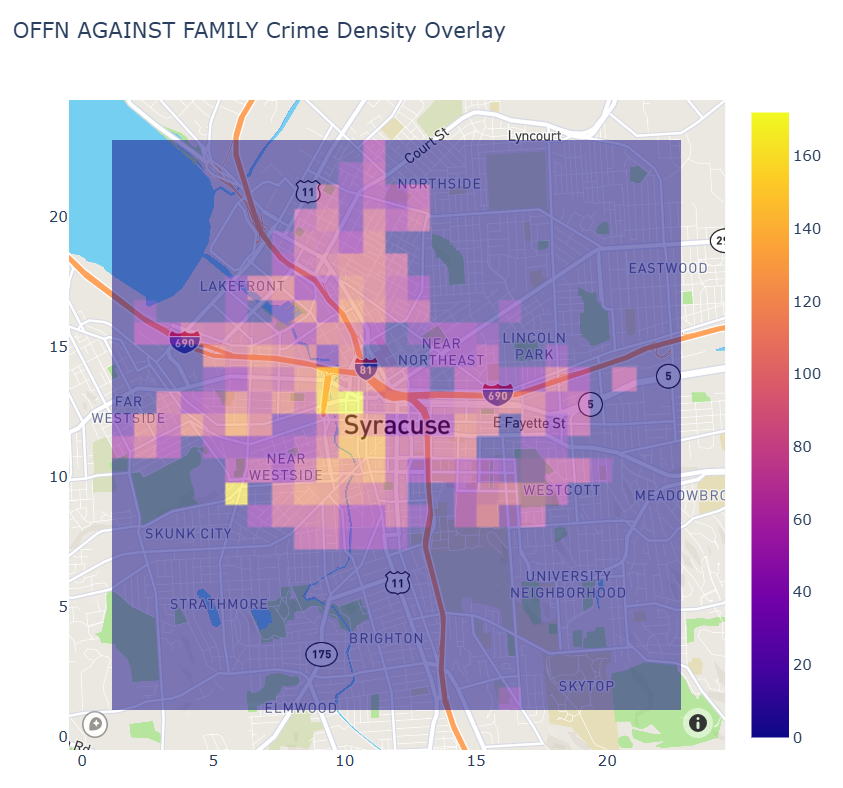
Offense against family map
-
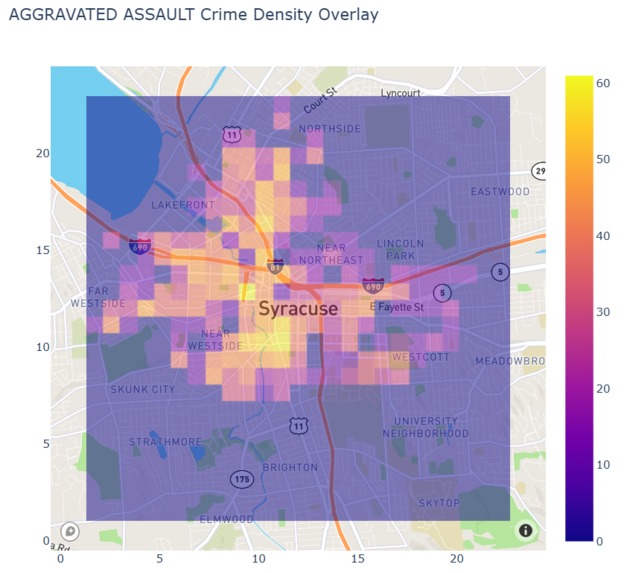
Aggravated assault map
-
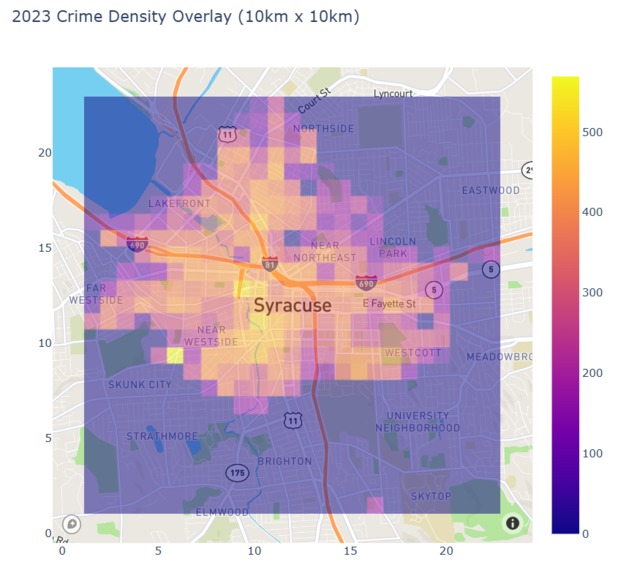
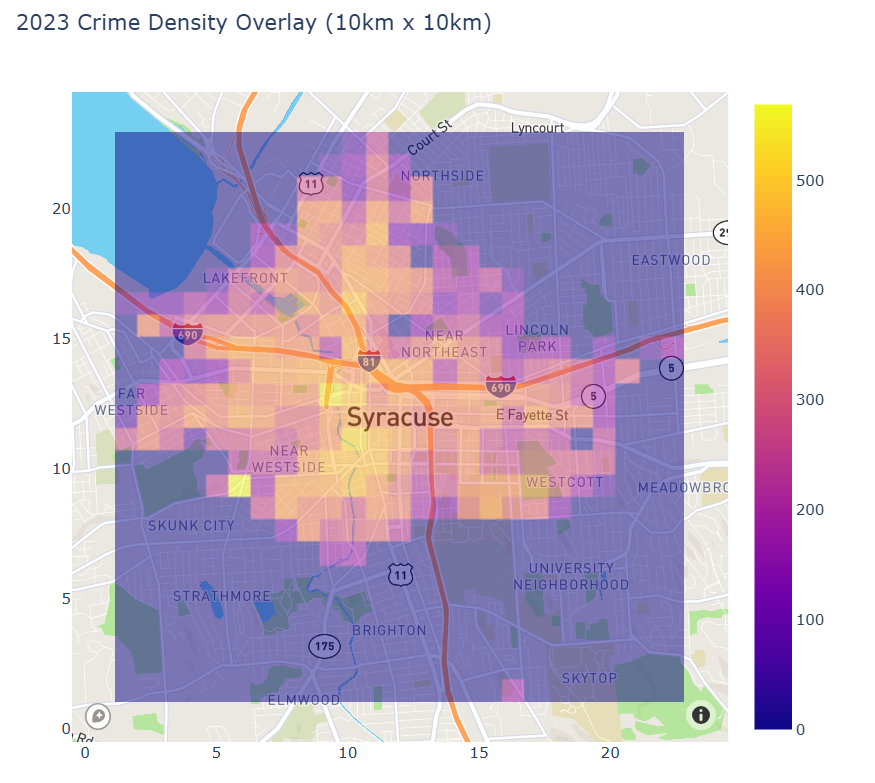
2023 general crime map
-
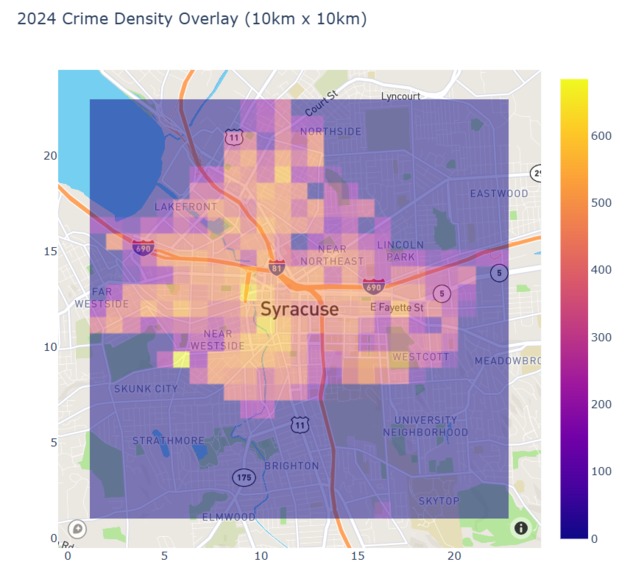
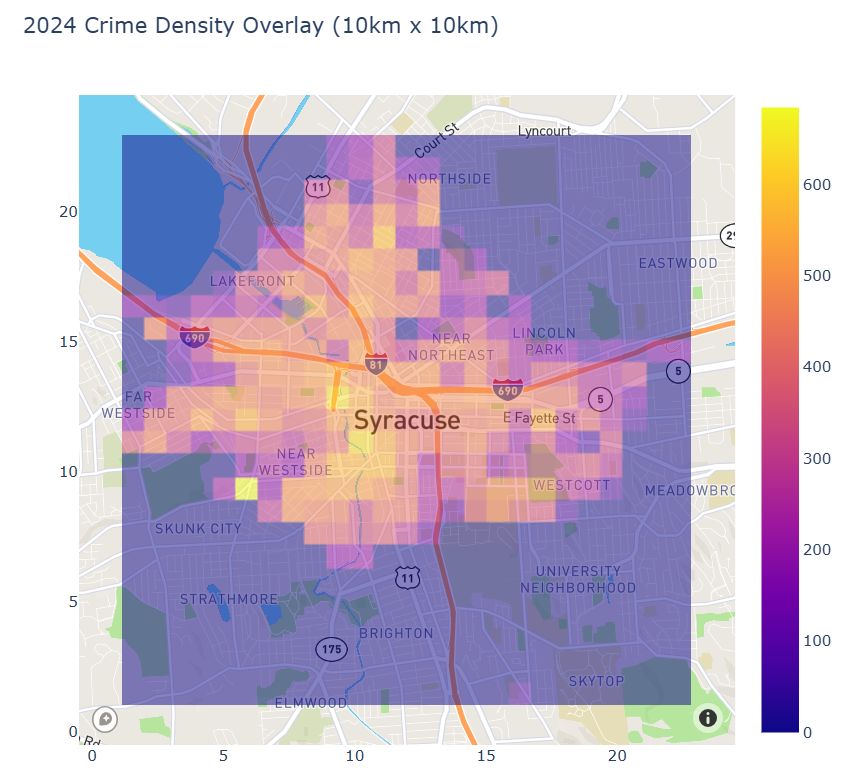
2024 general crime map
Crime Wave
Visualizing crime in a density in the area of Syracuse


Updates

Leave feedback in the comments!
Log in or sign up for Devpost to join the conversation.