Inspiration
We were inspired by the growing field of data analysis allowing us to visualize complex datasets and find insights, as well as a desire to understand the diversity of ownership within government contracting firms.
What it does
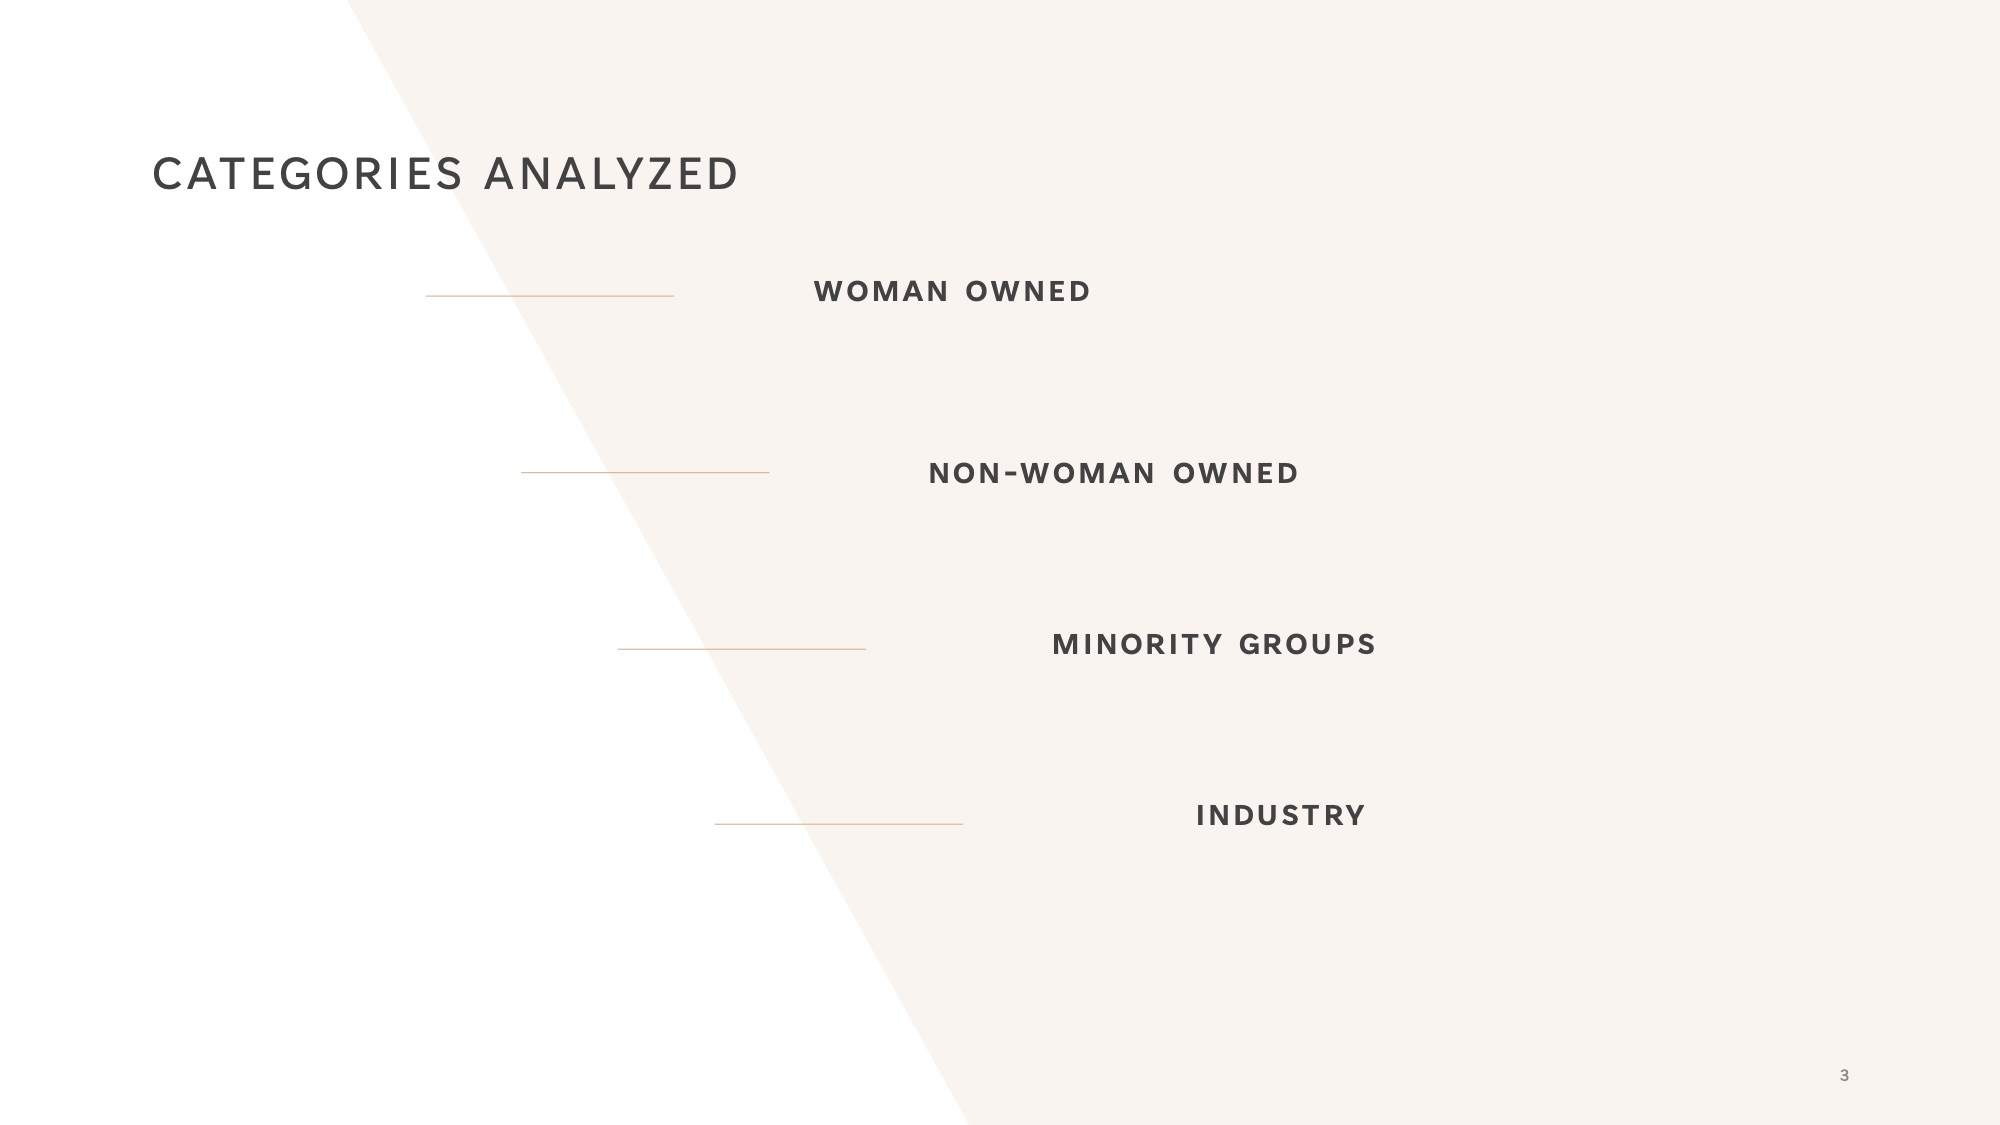
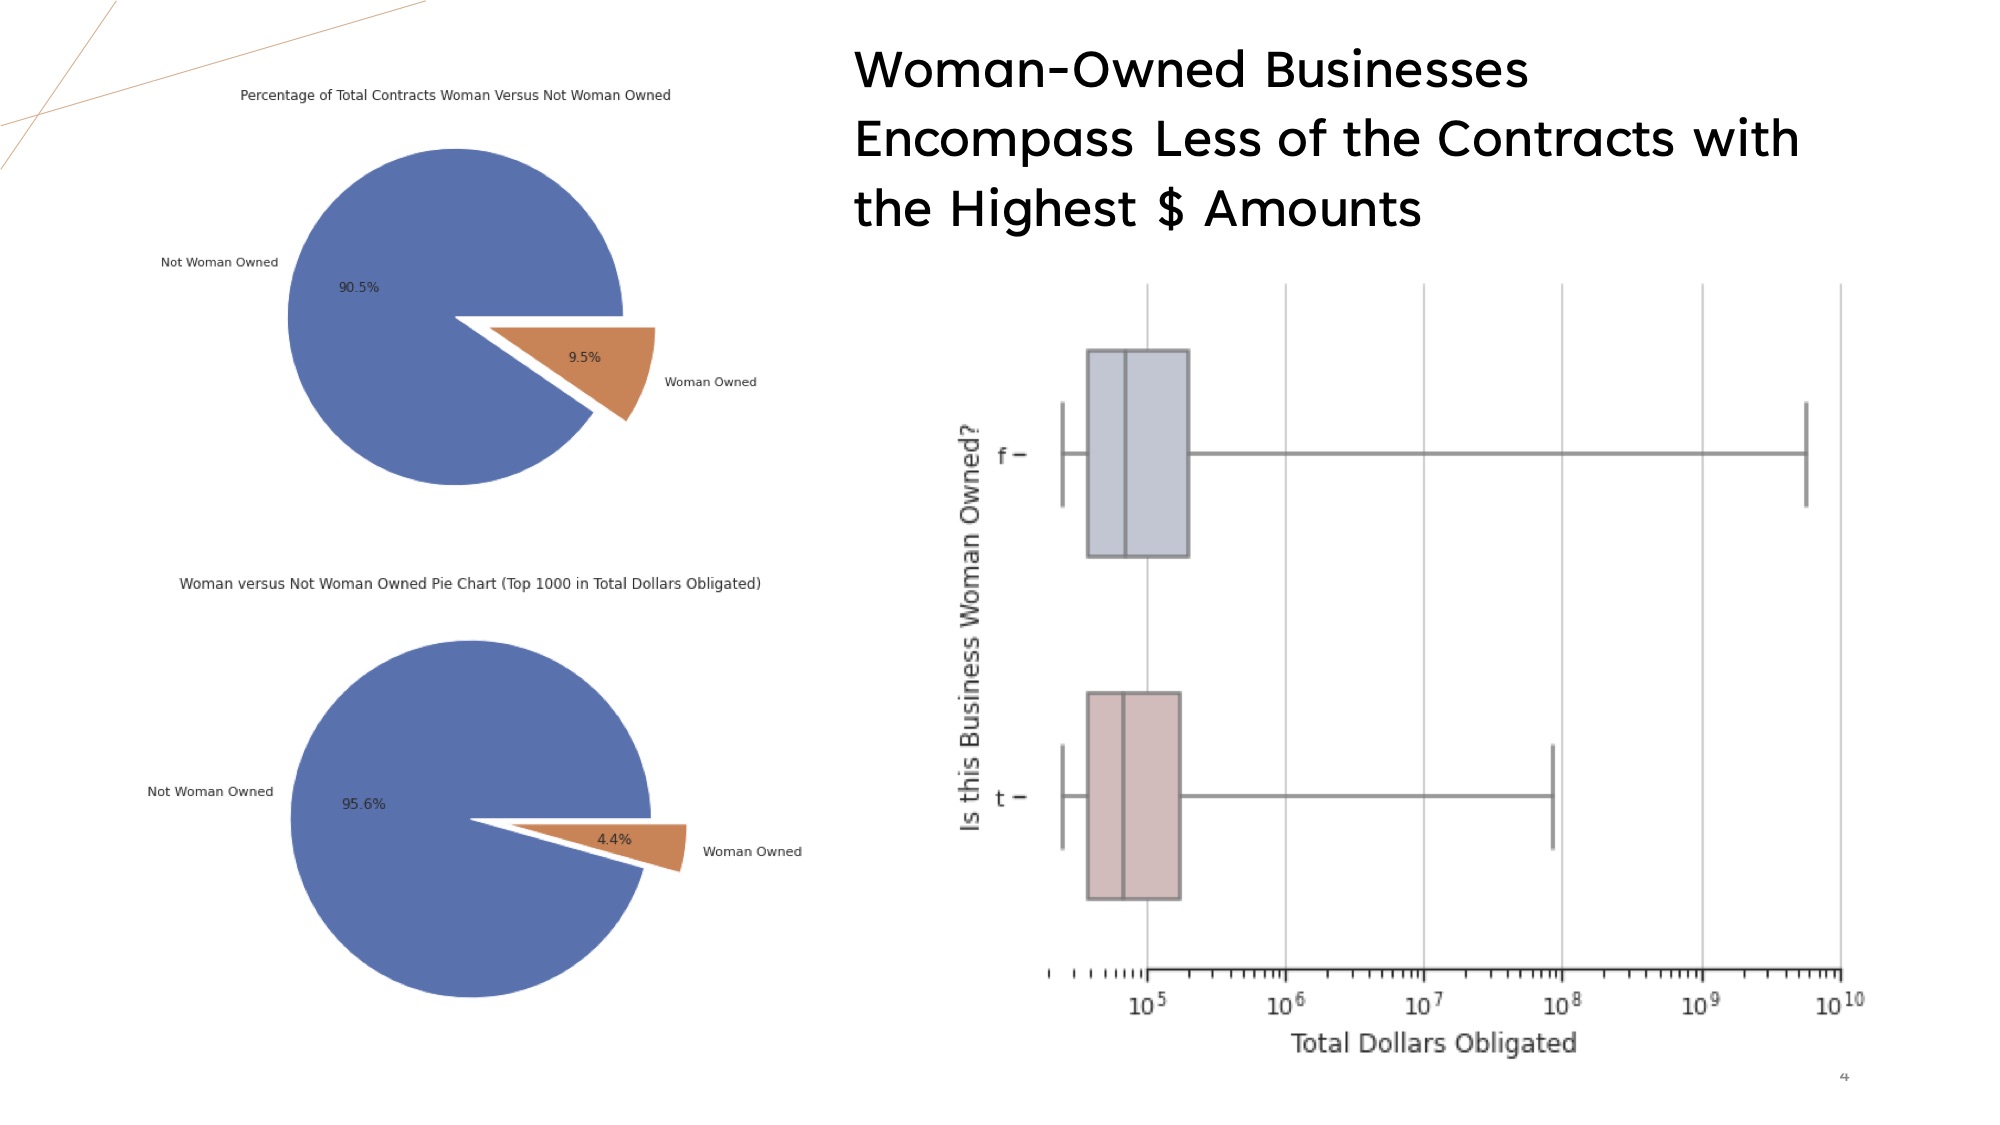
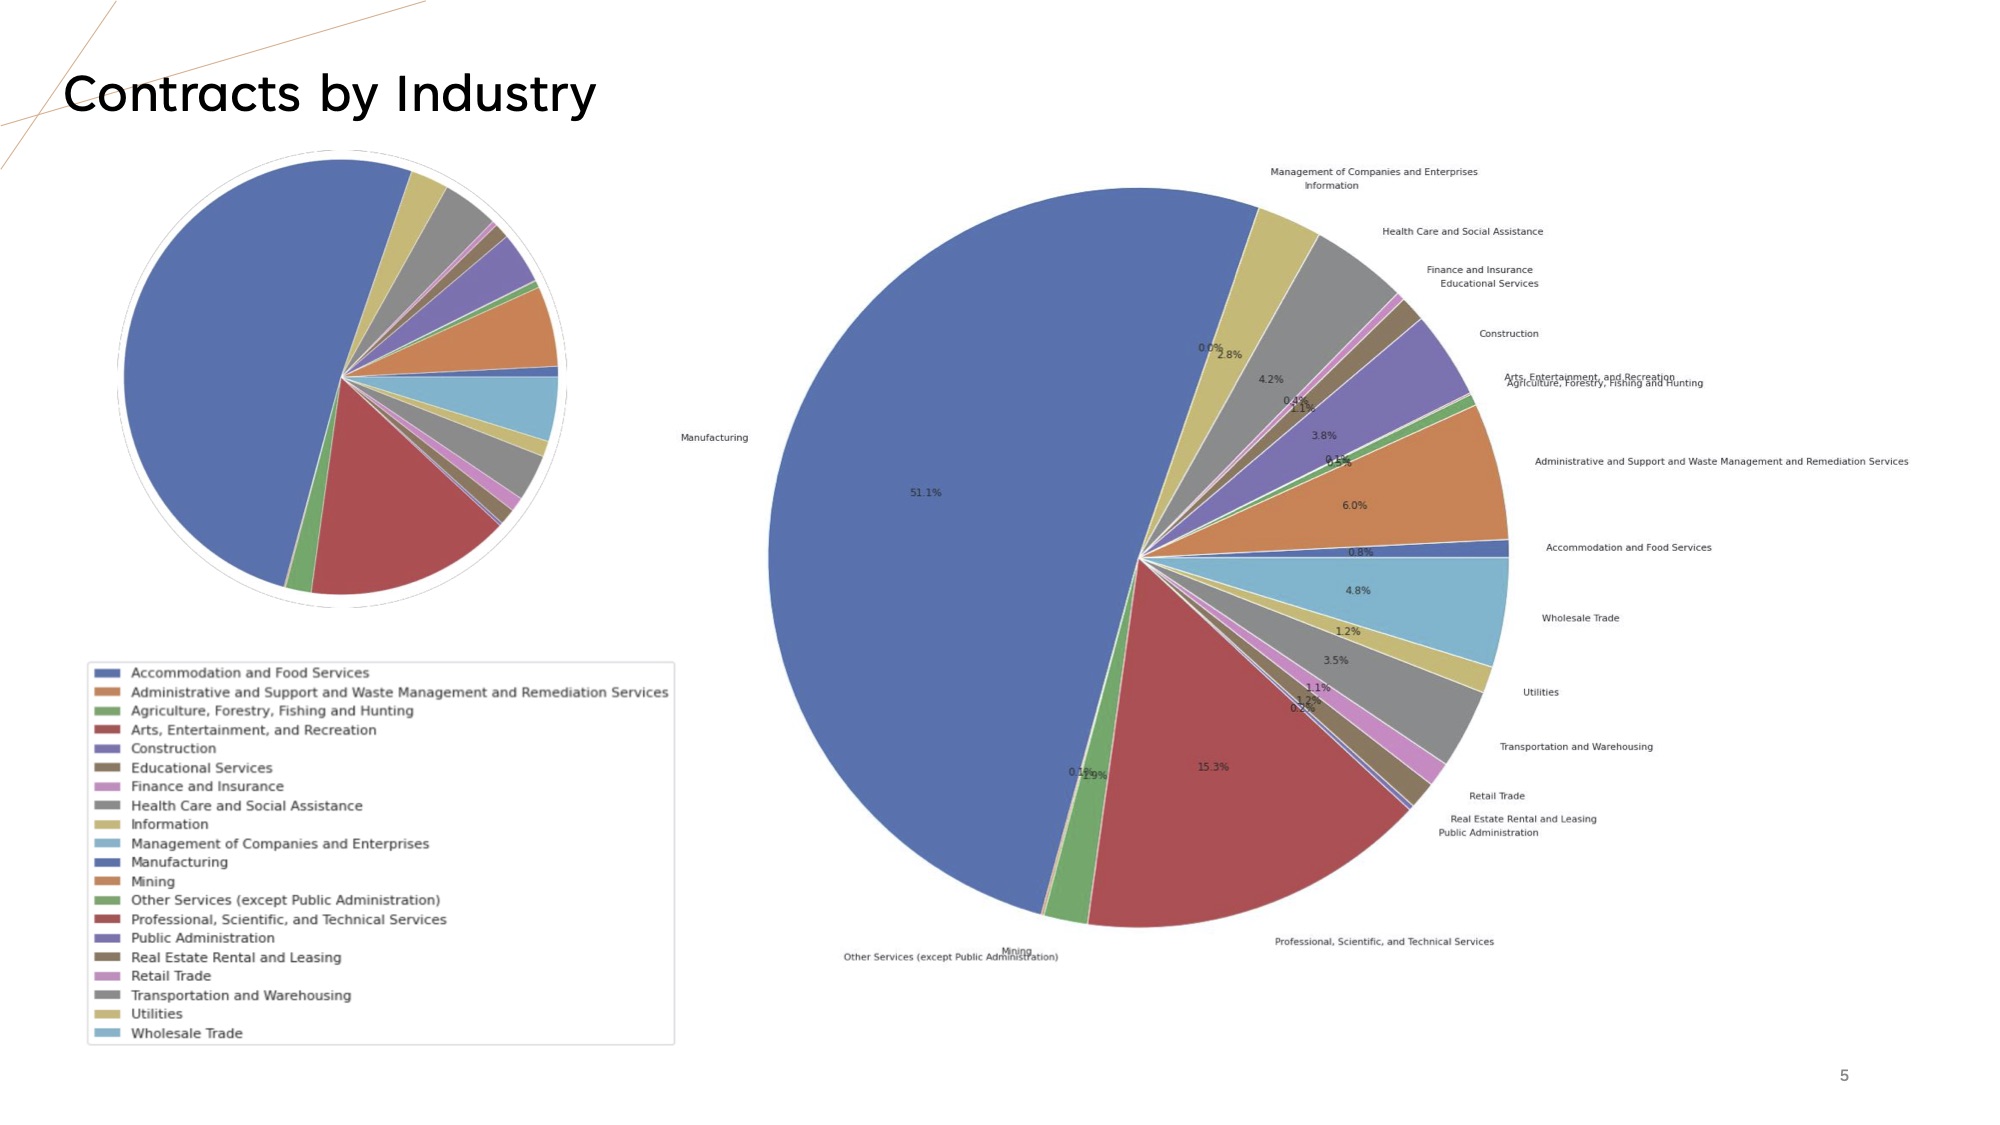
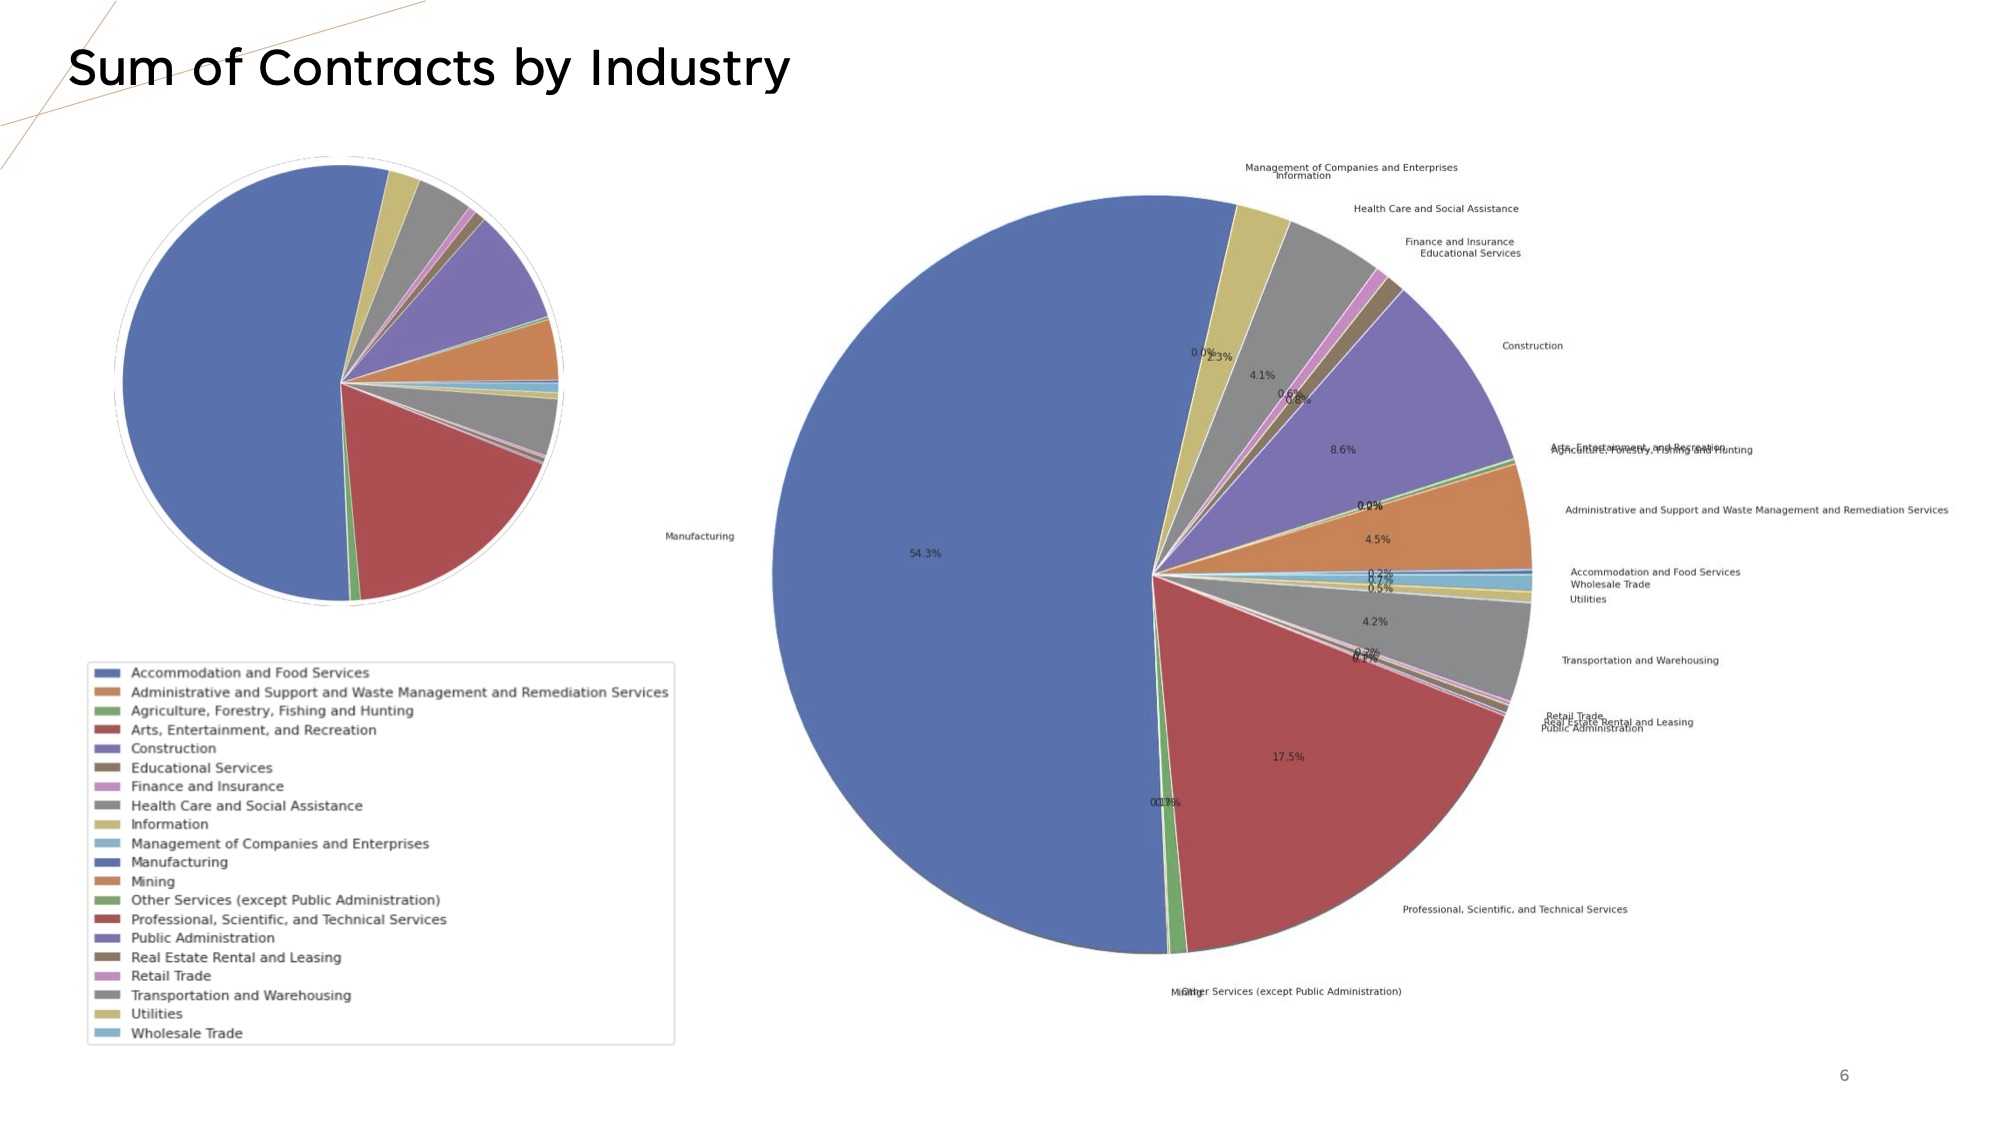
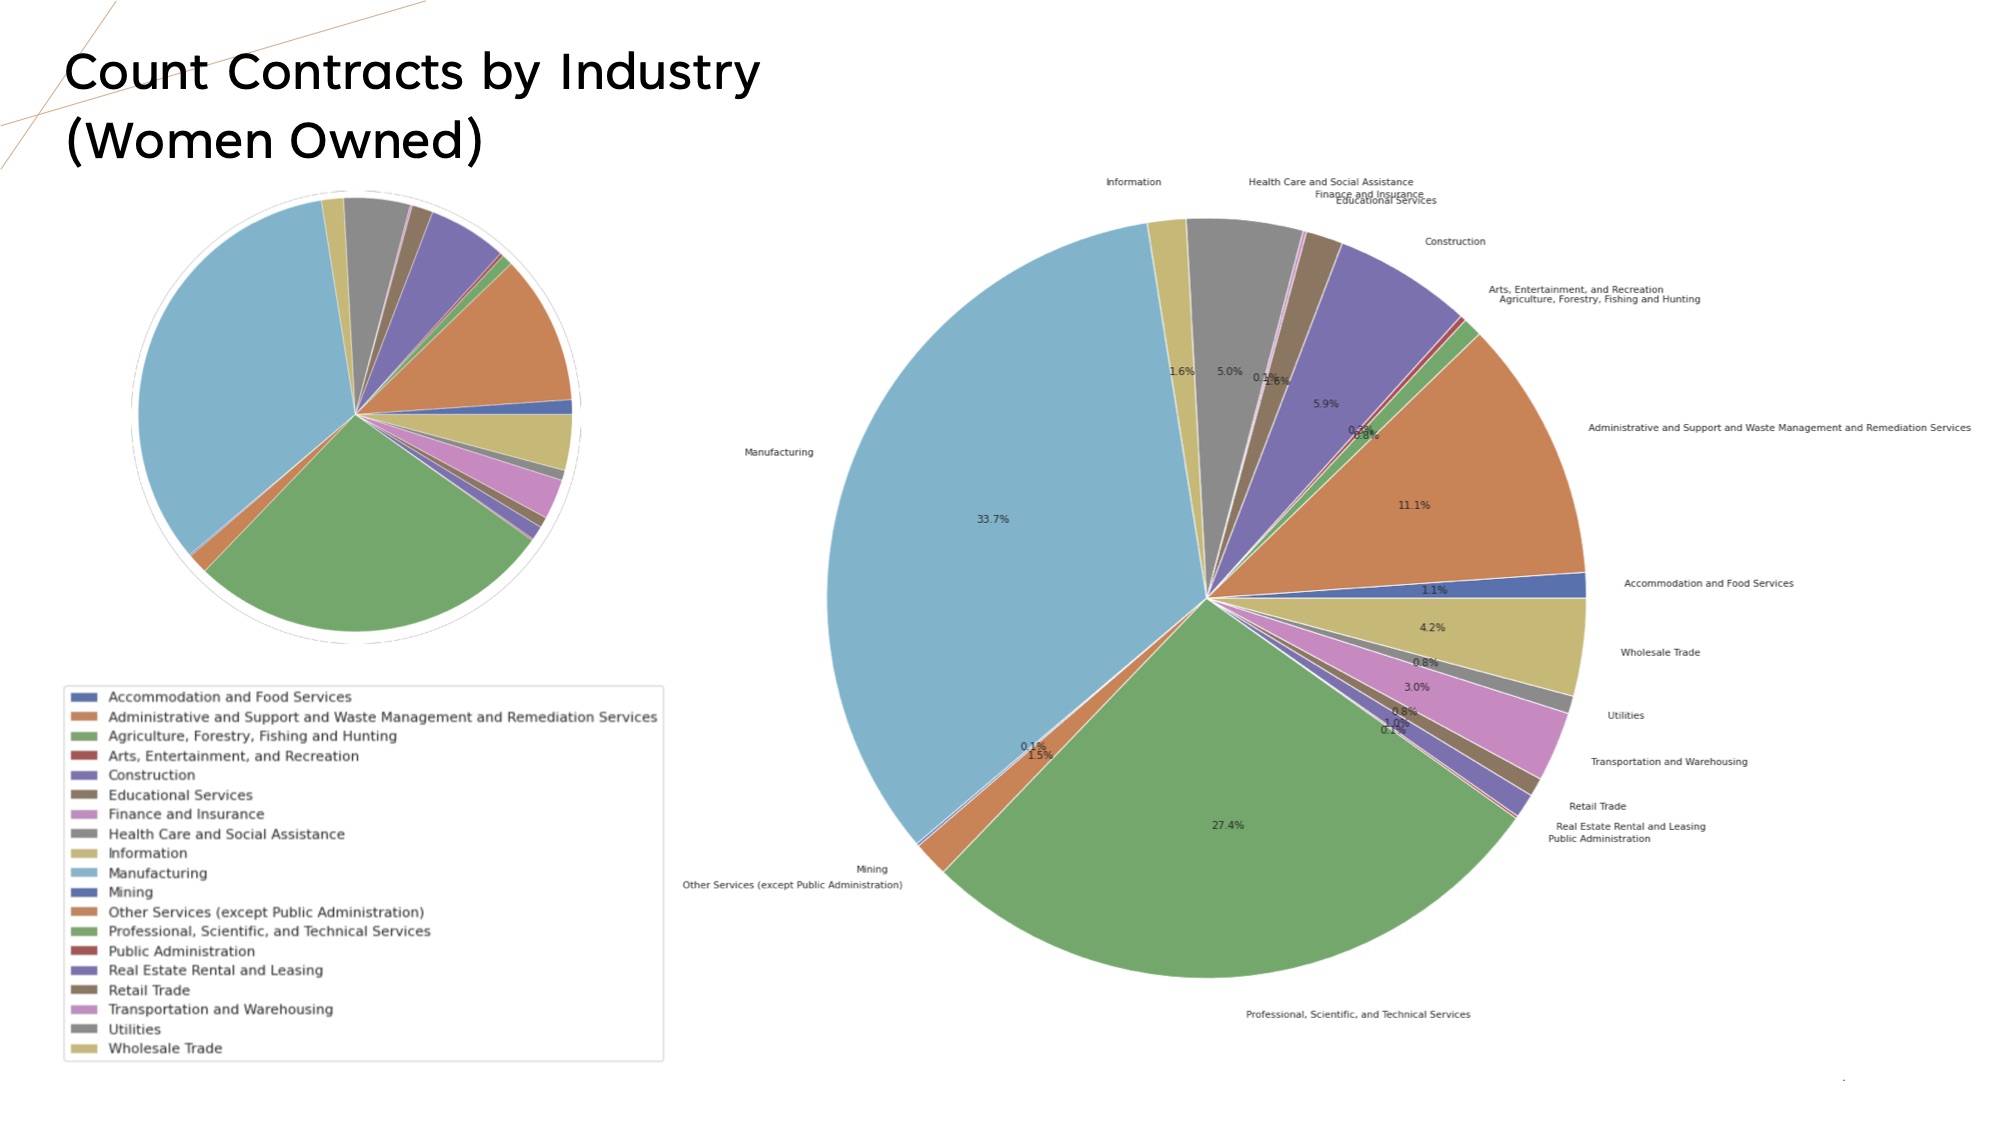
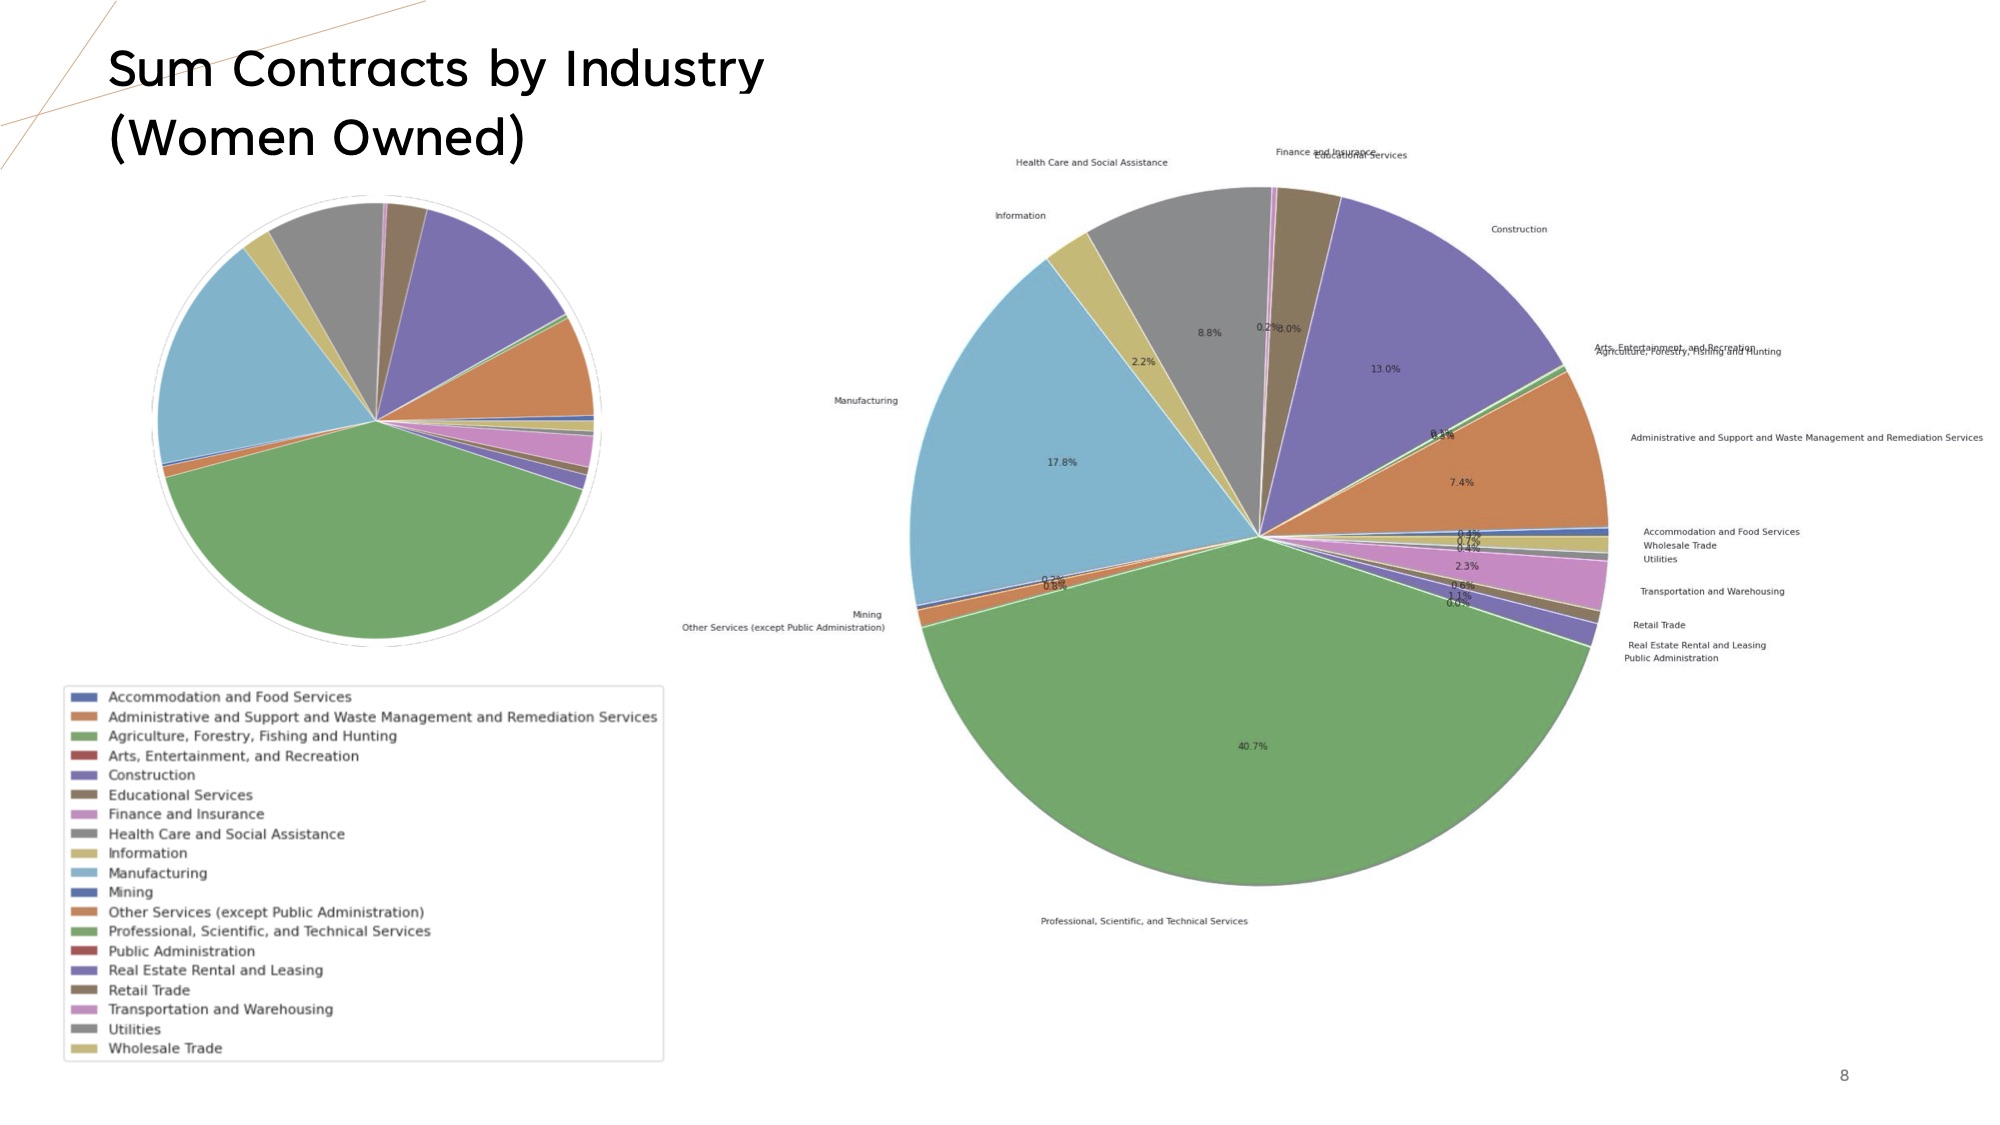
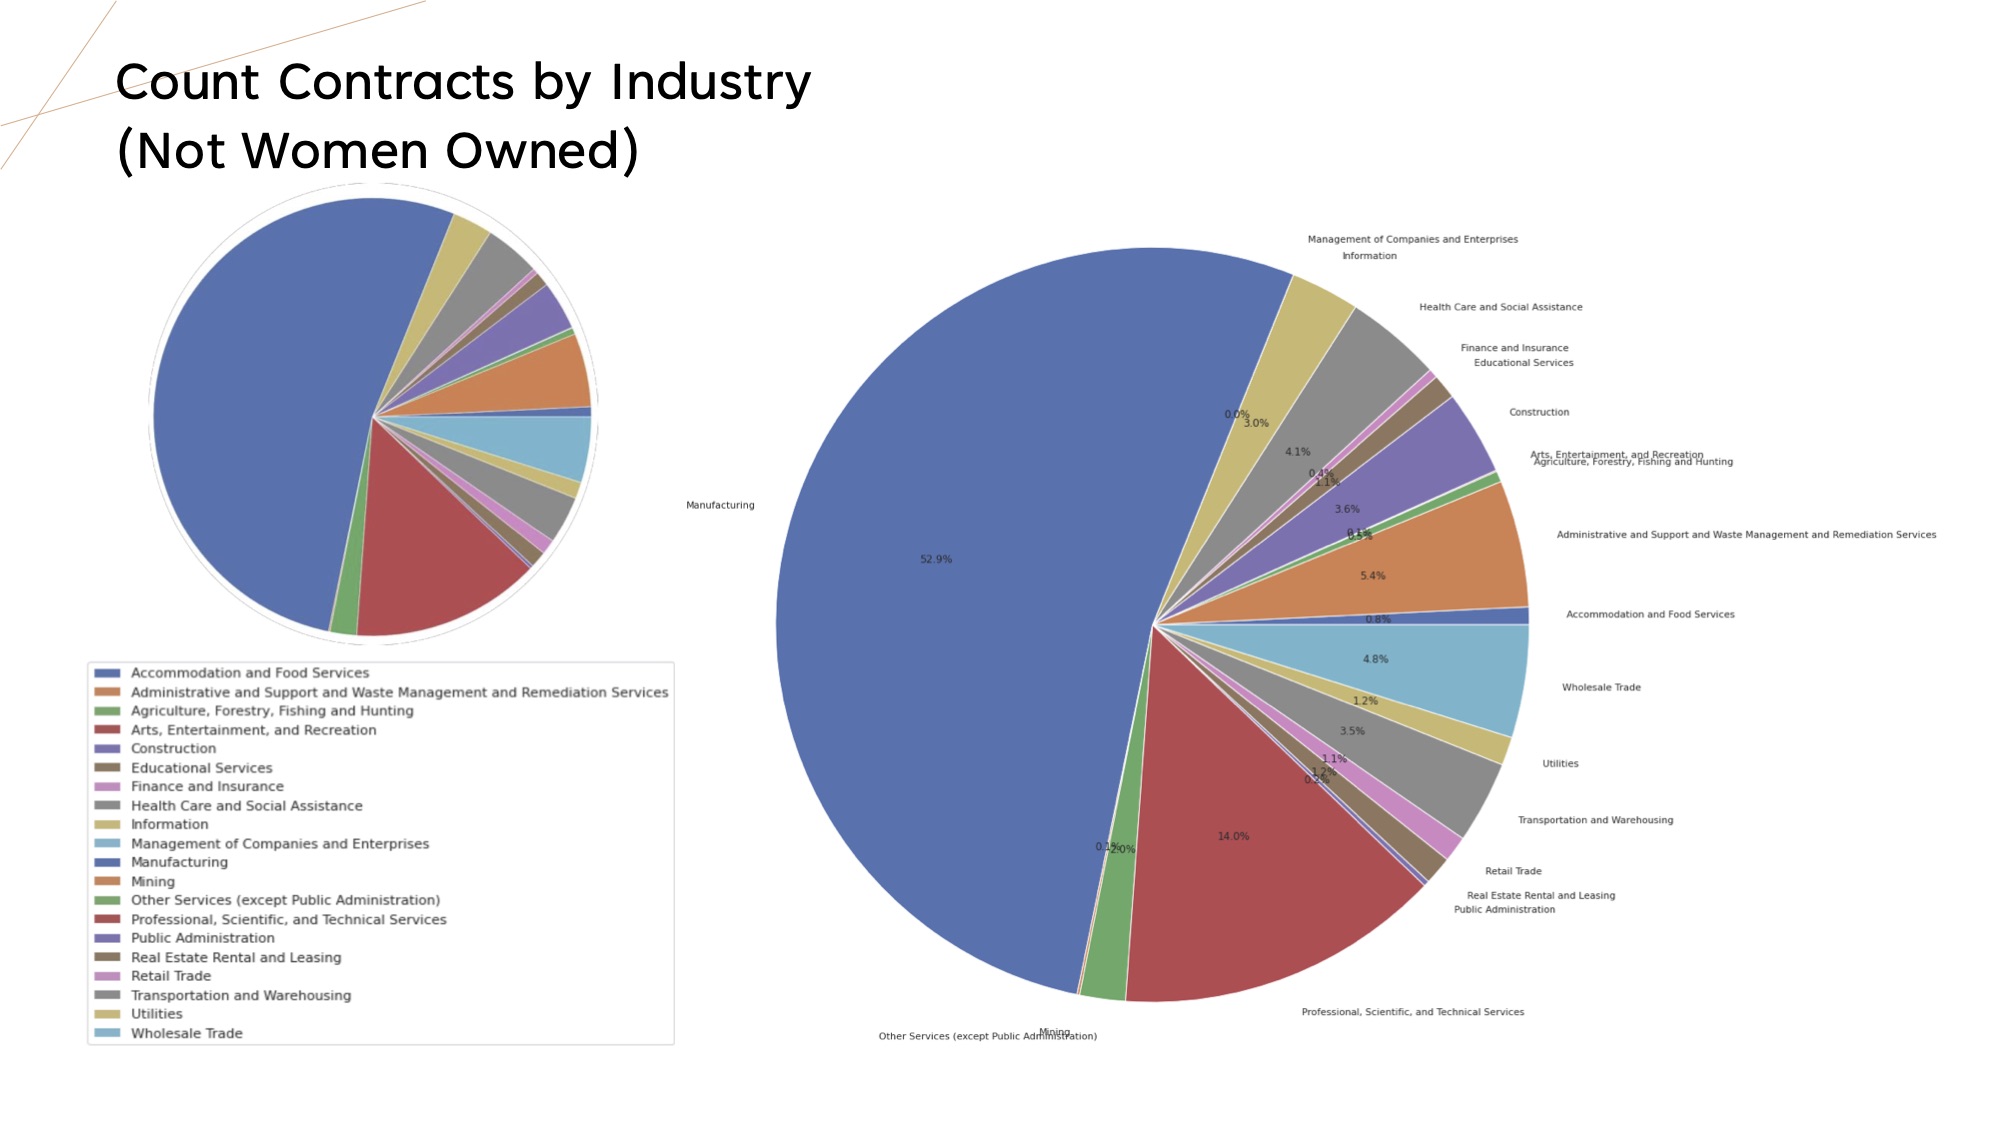
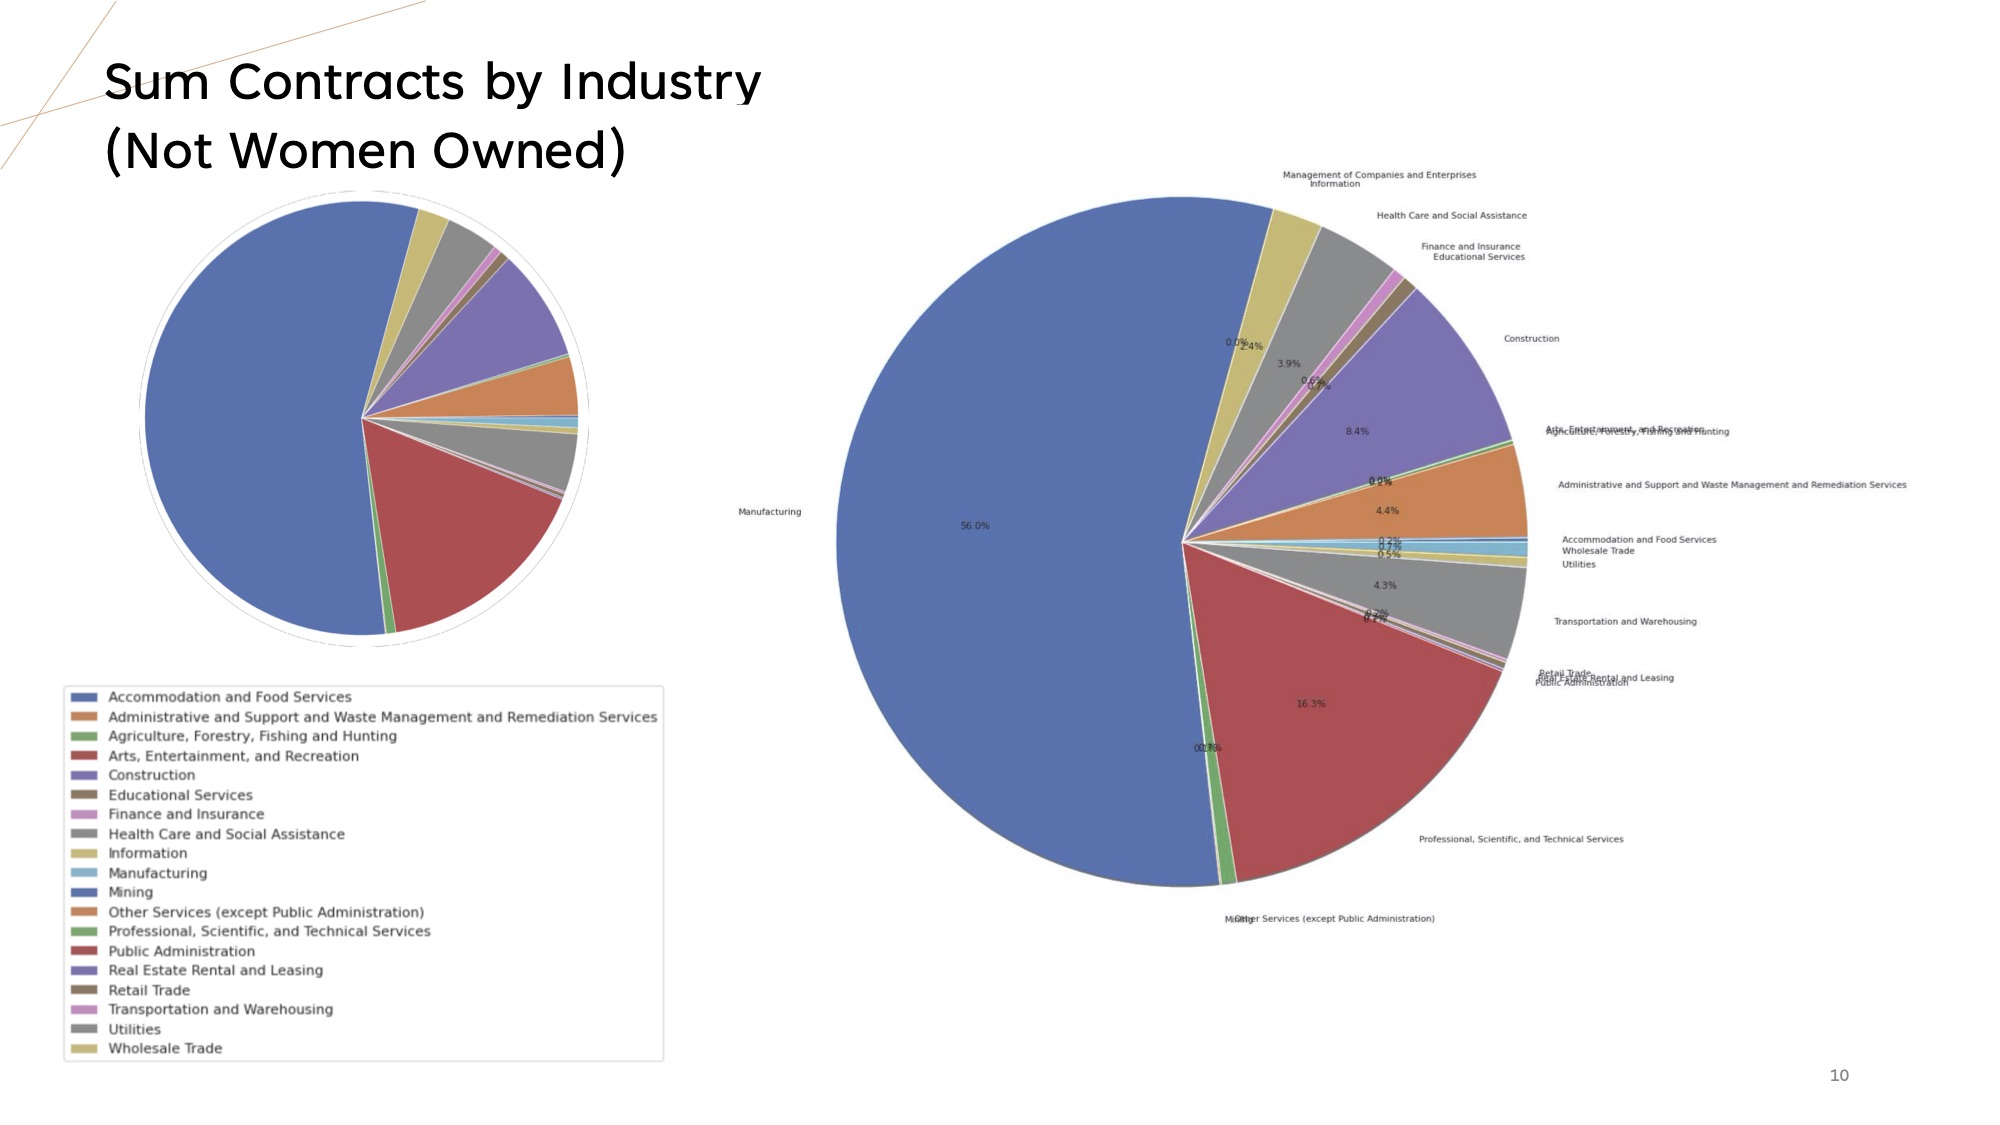
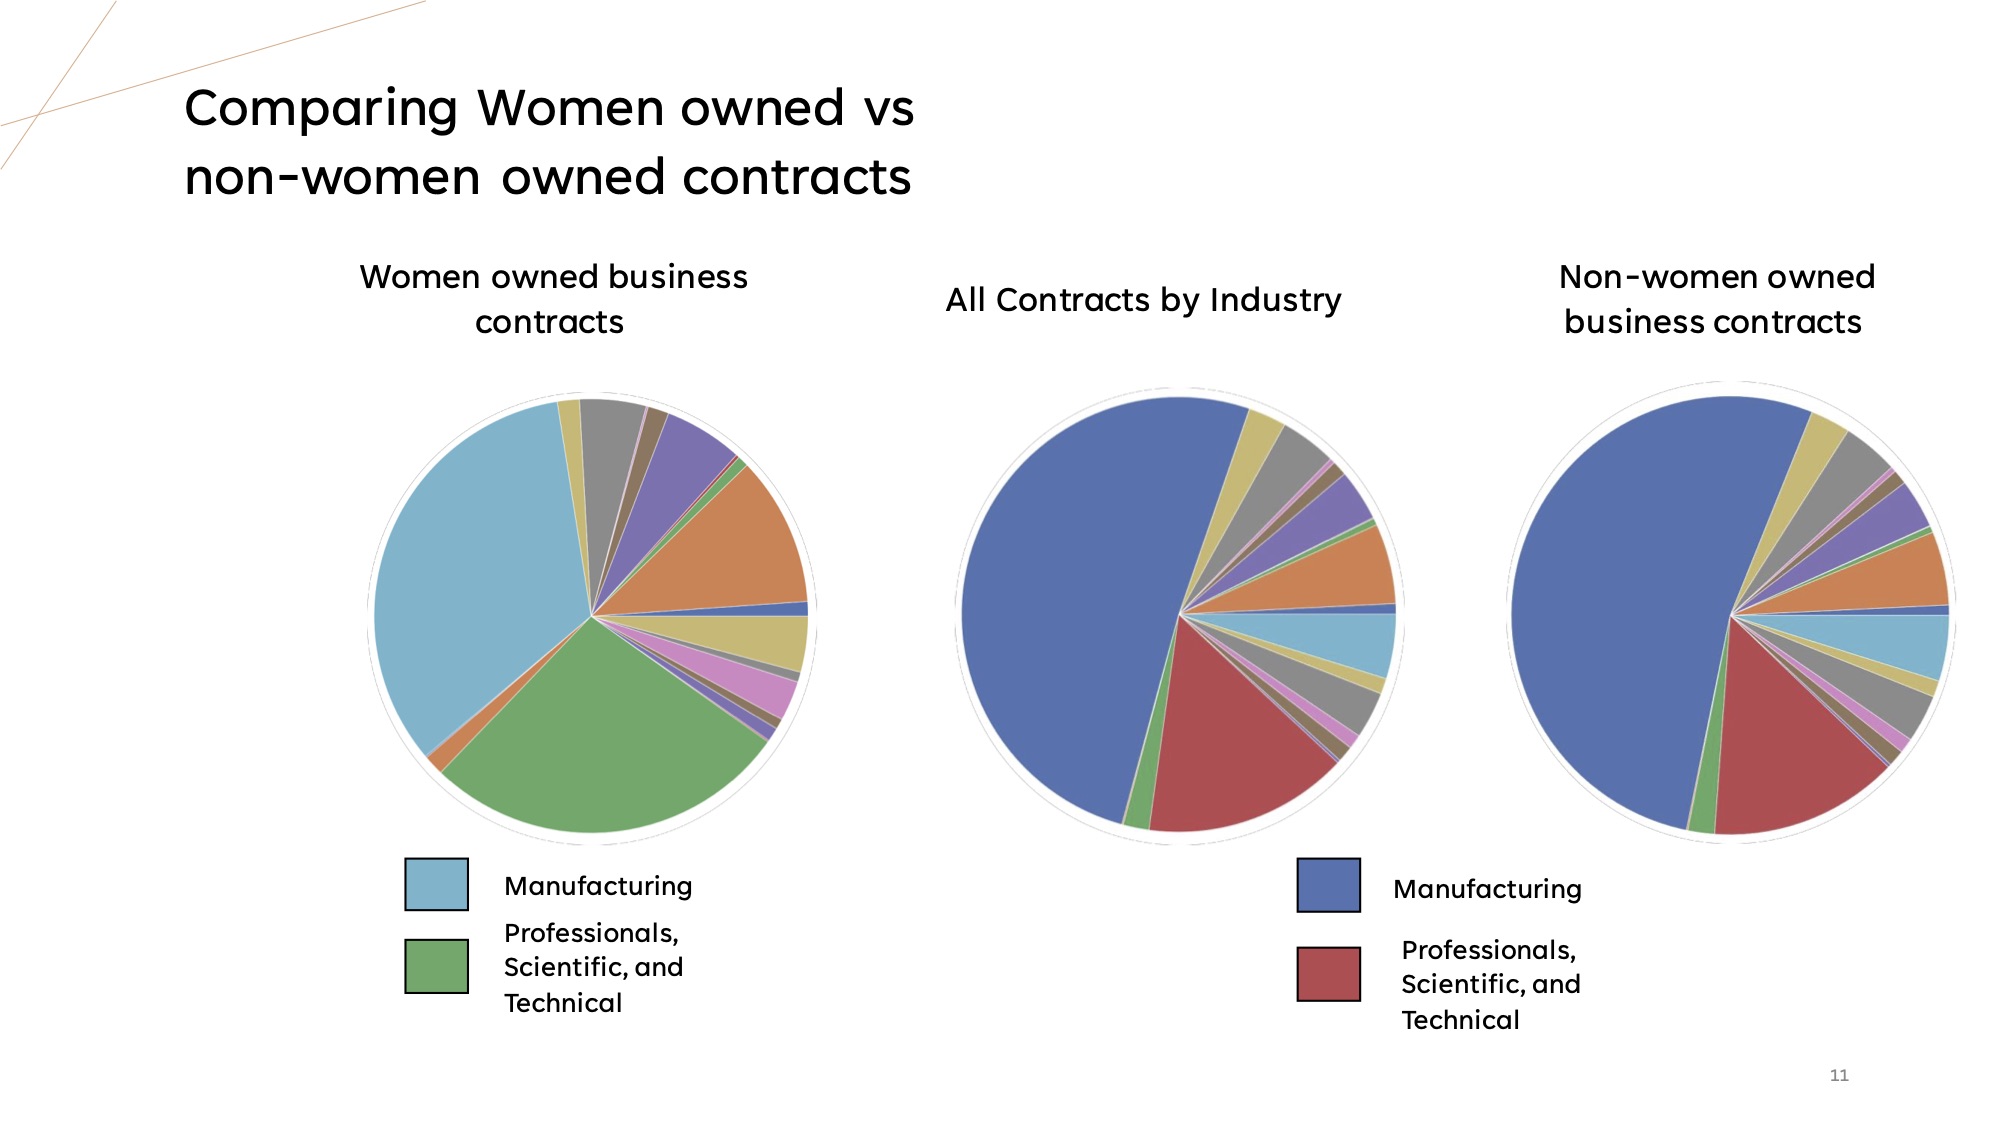
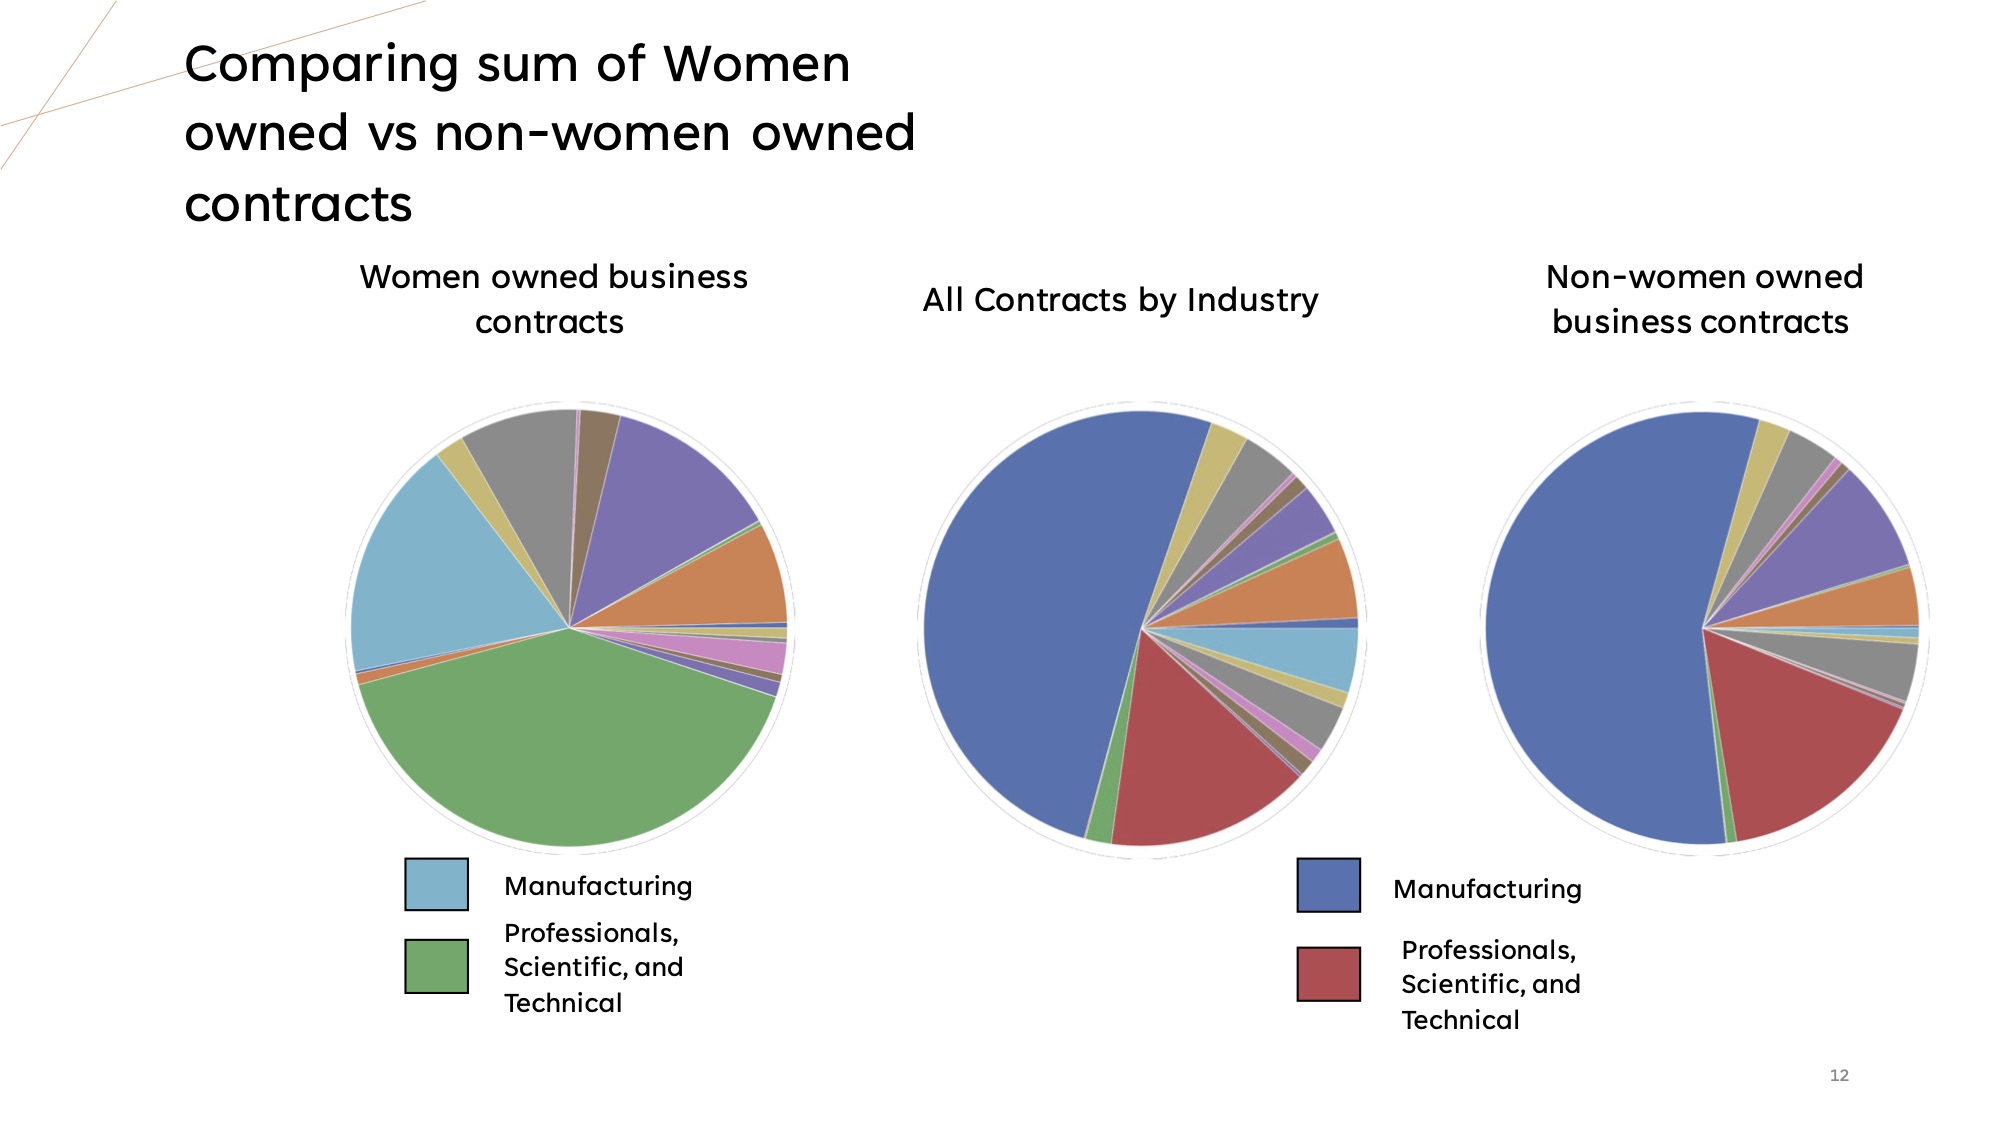
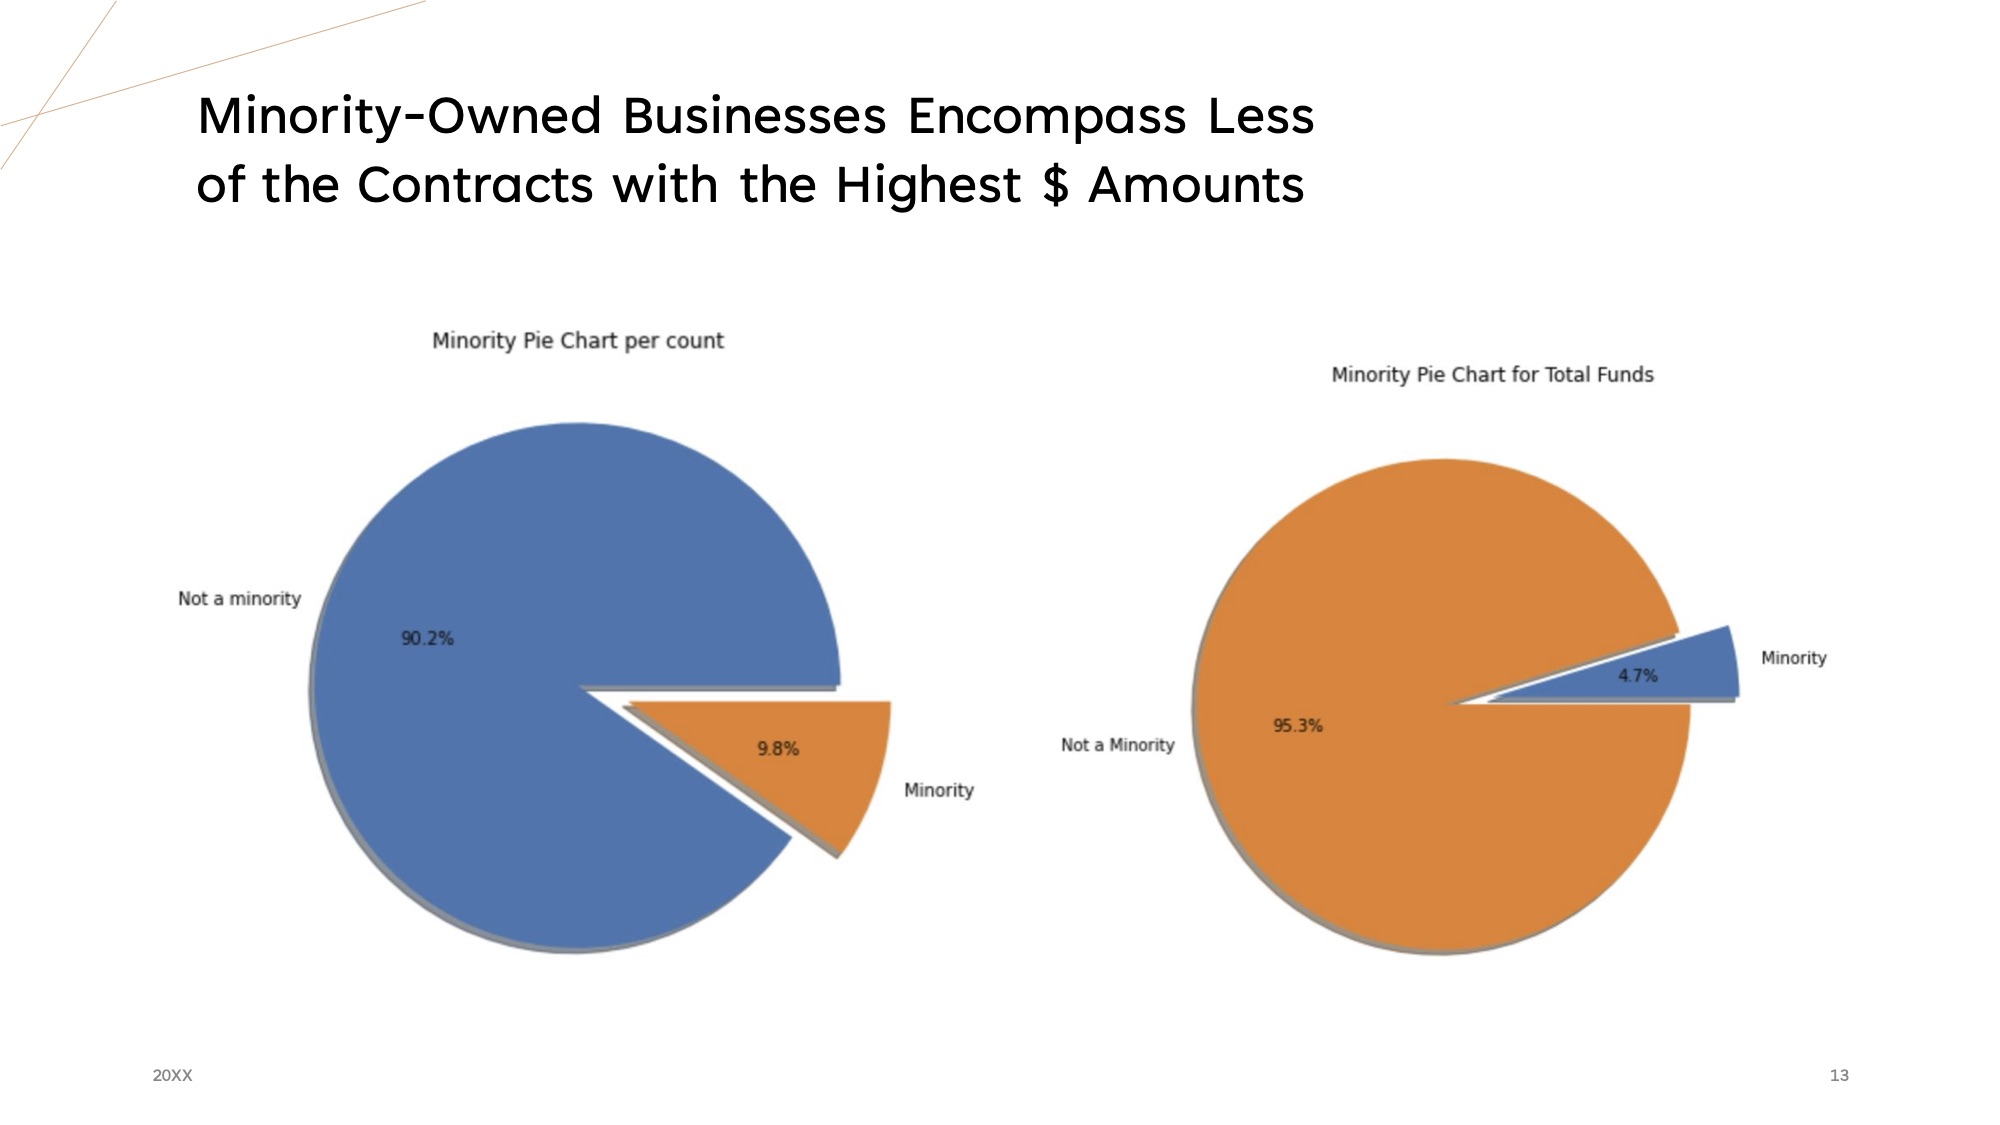
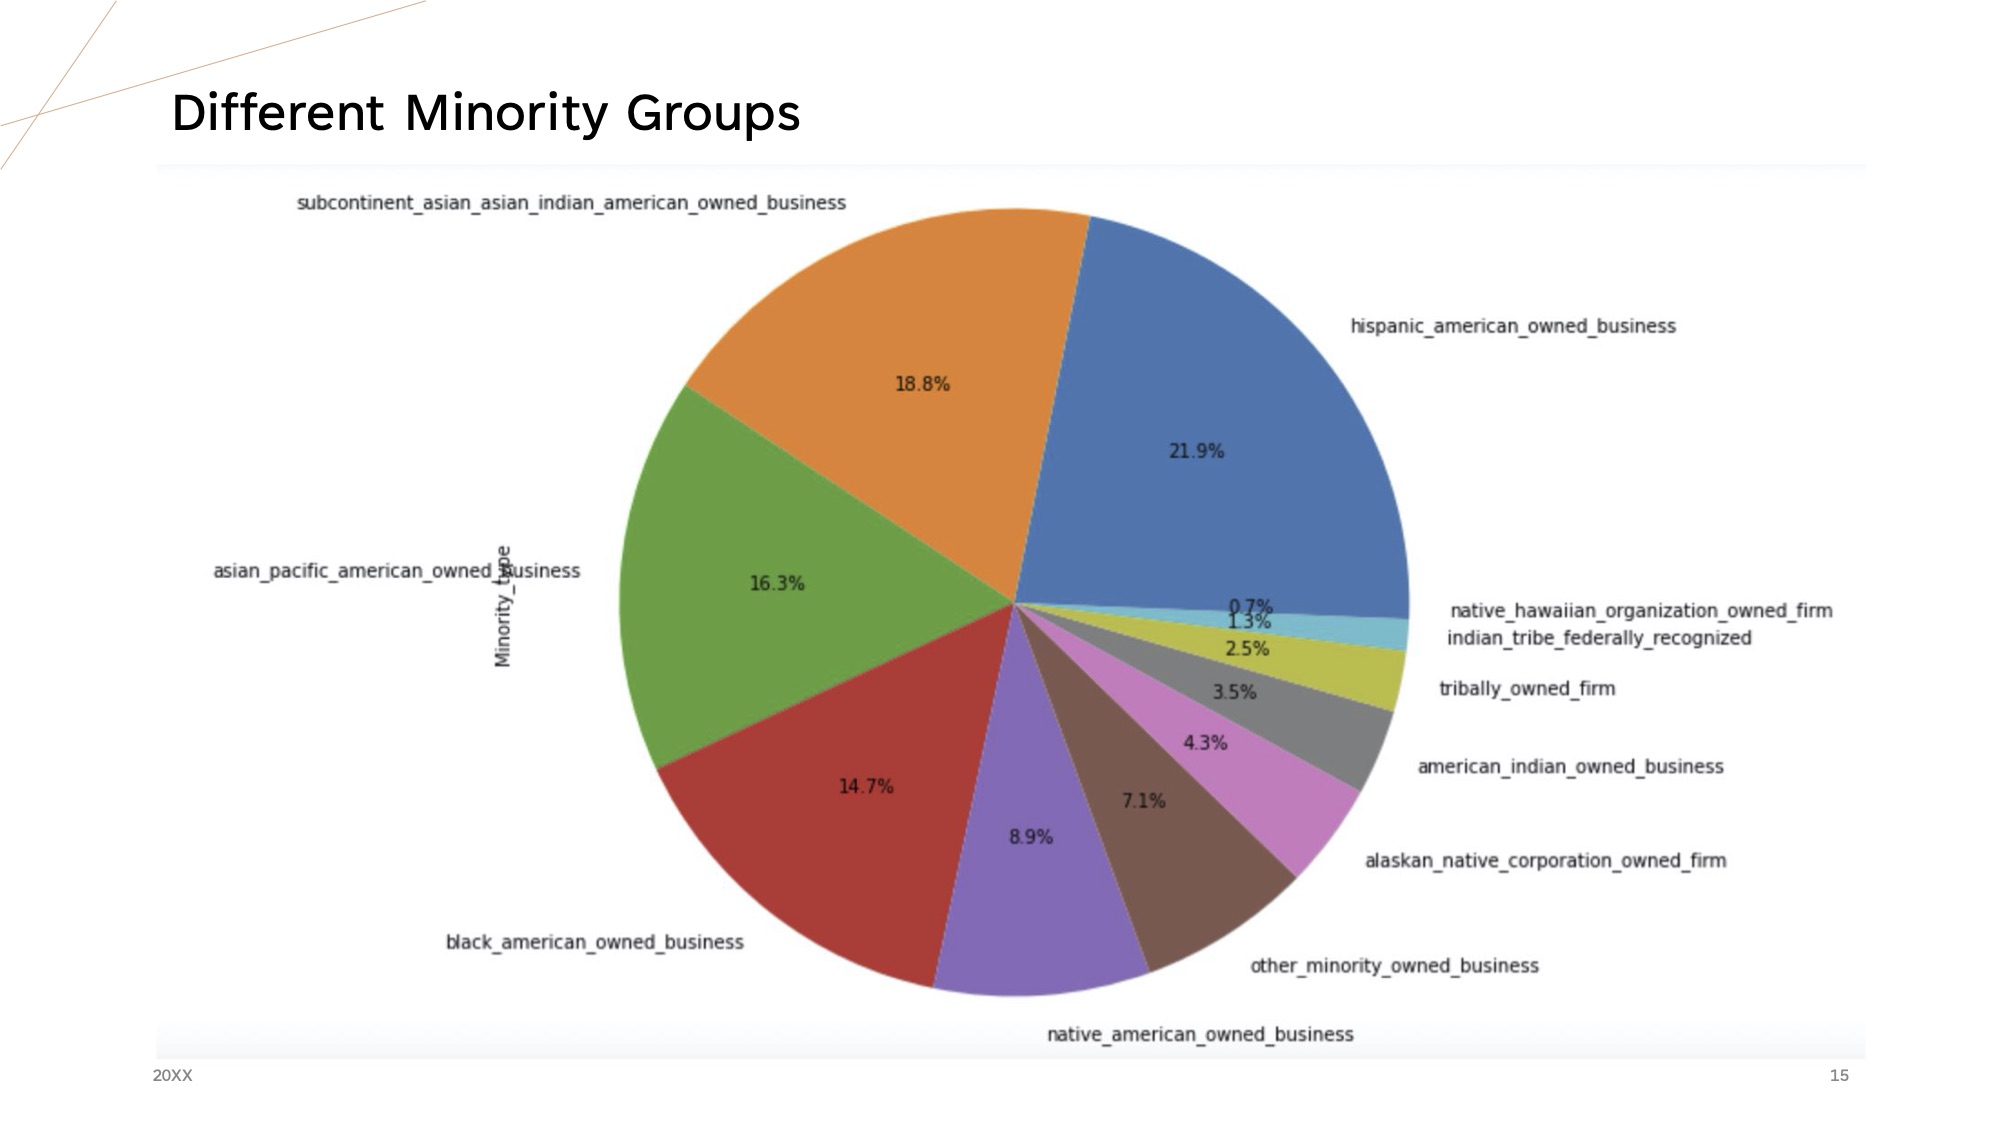
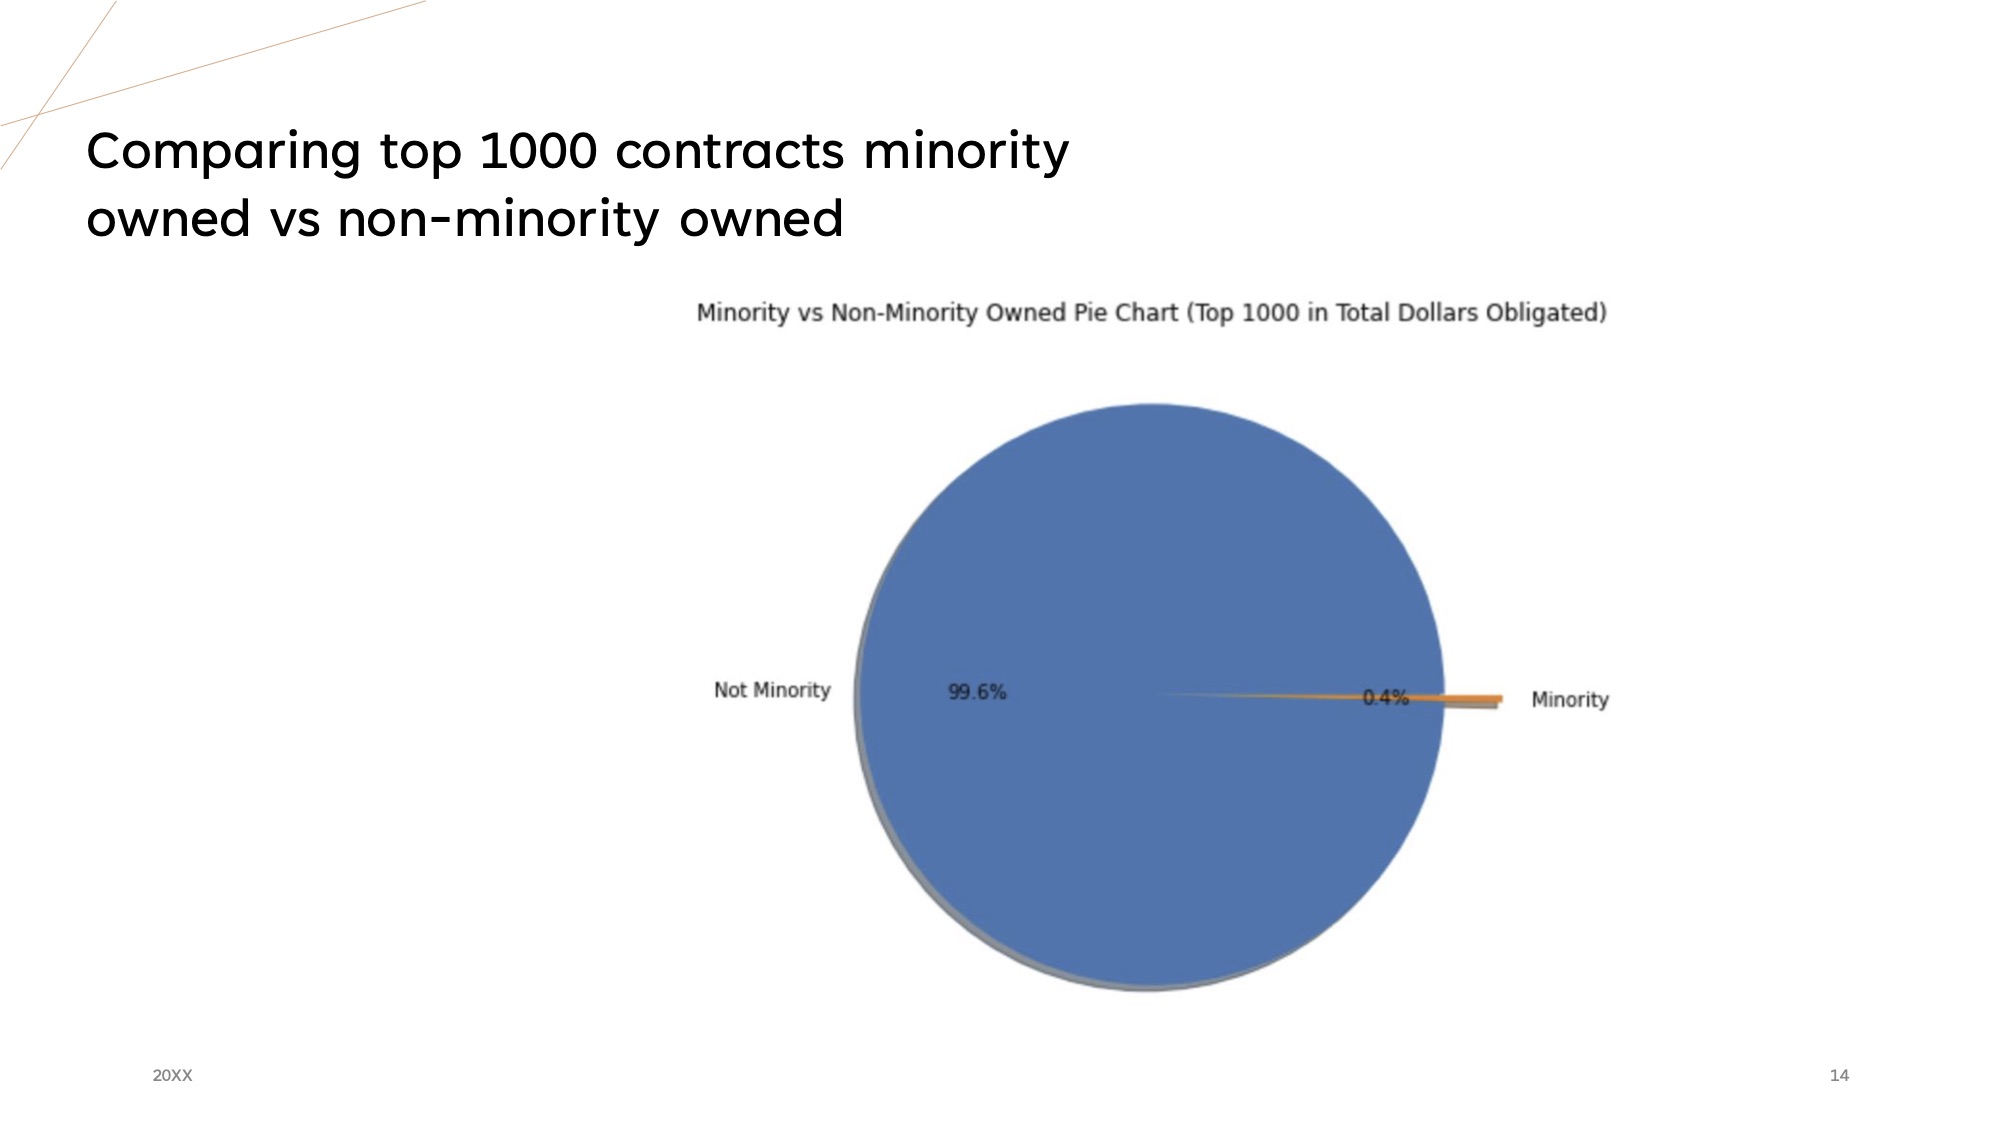
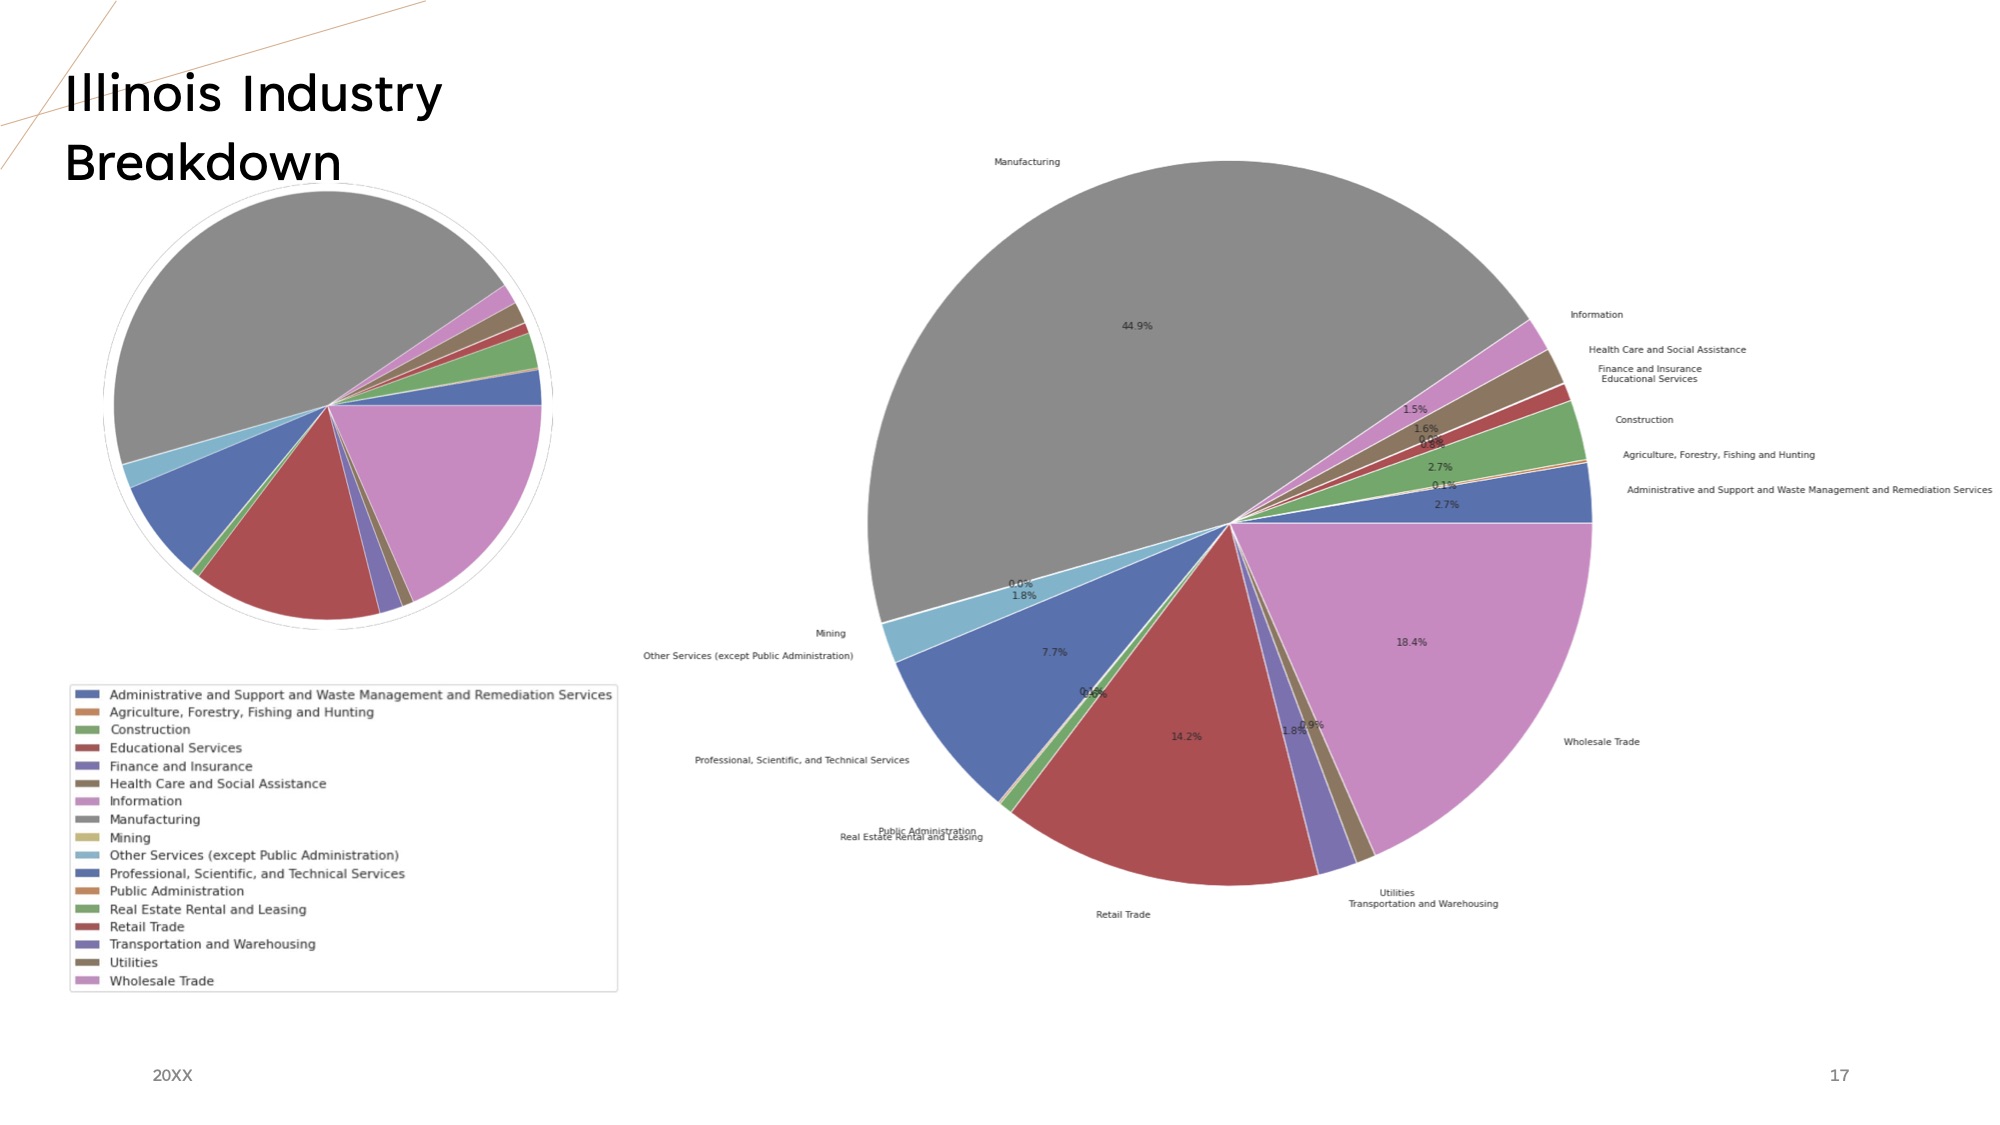
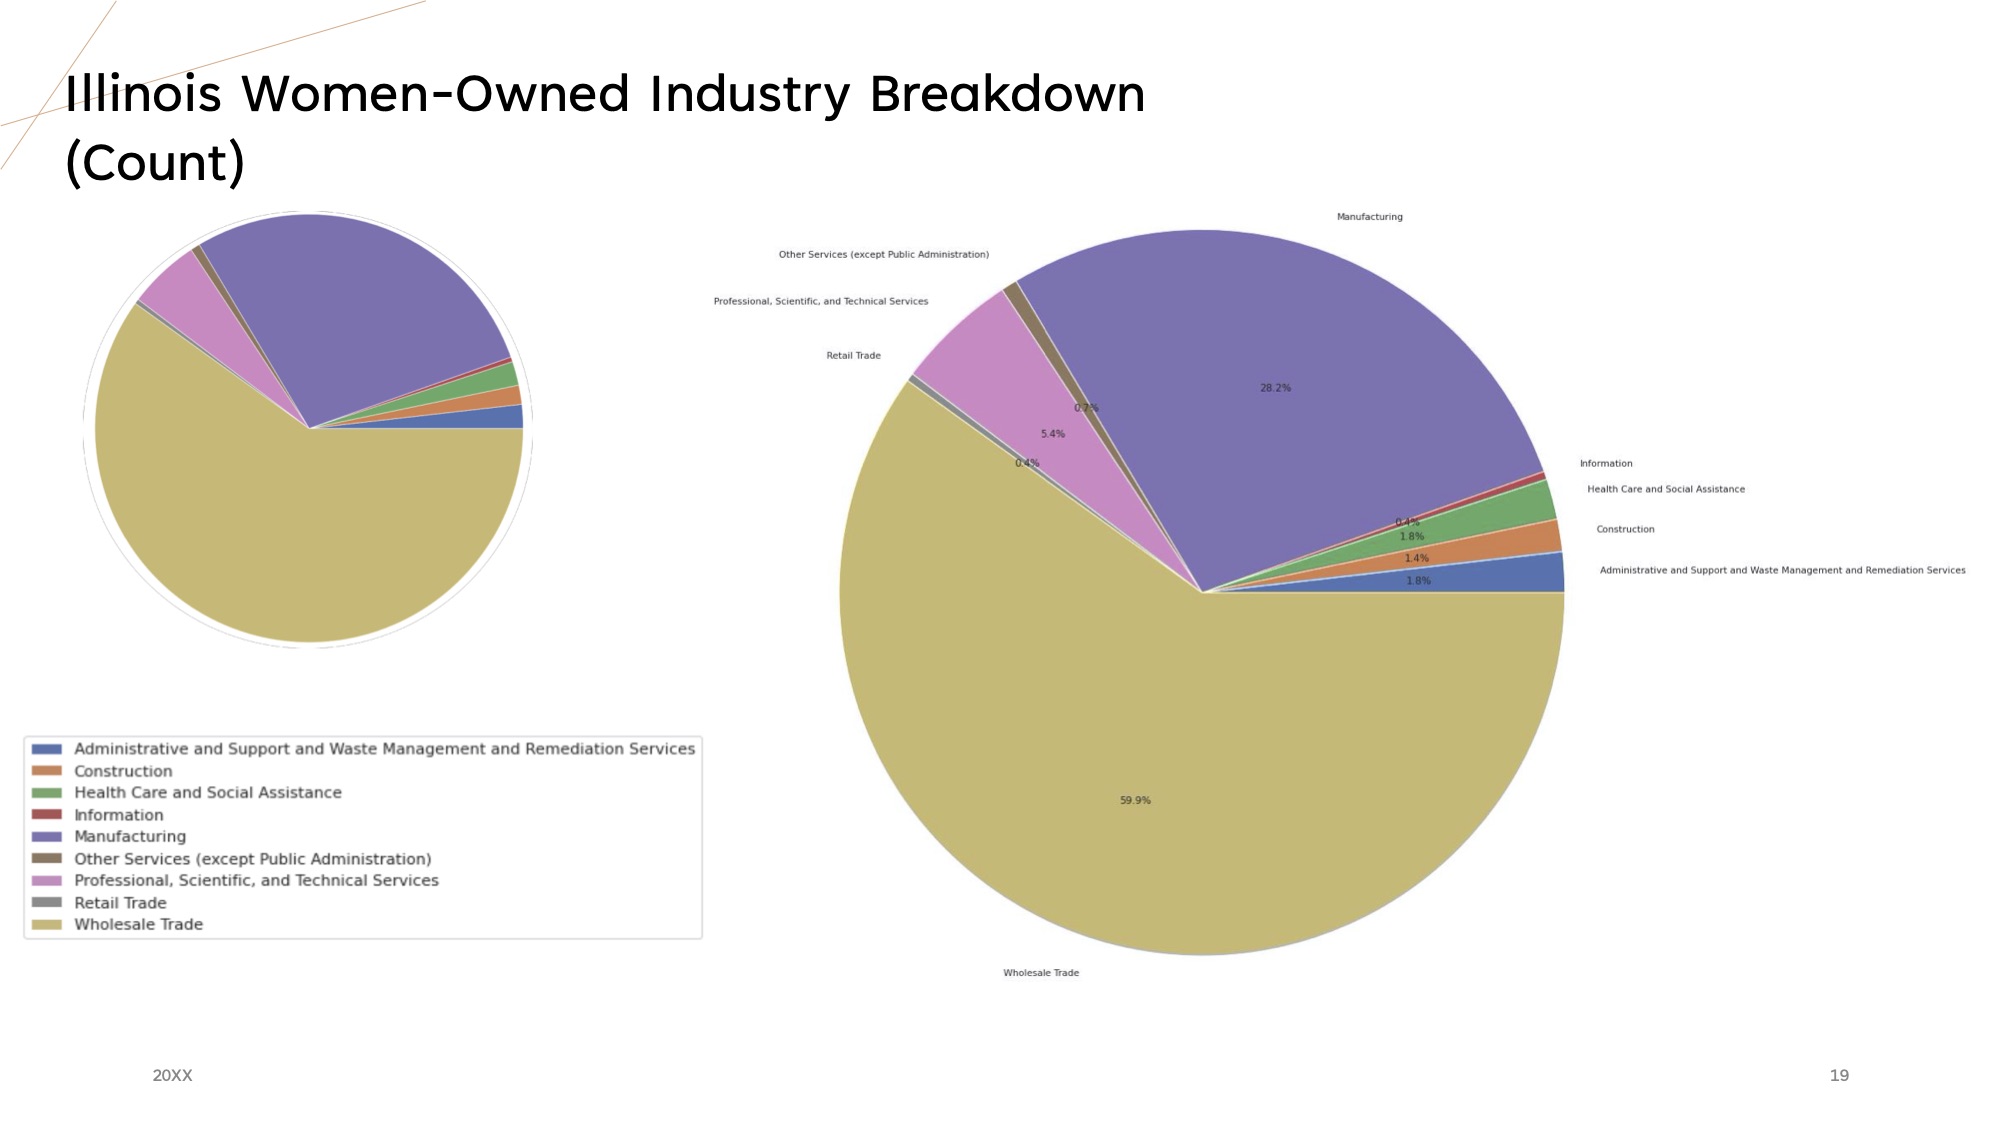
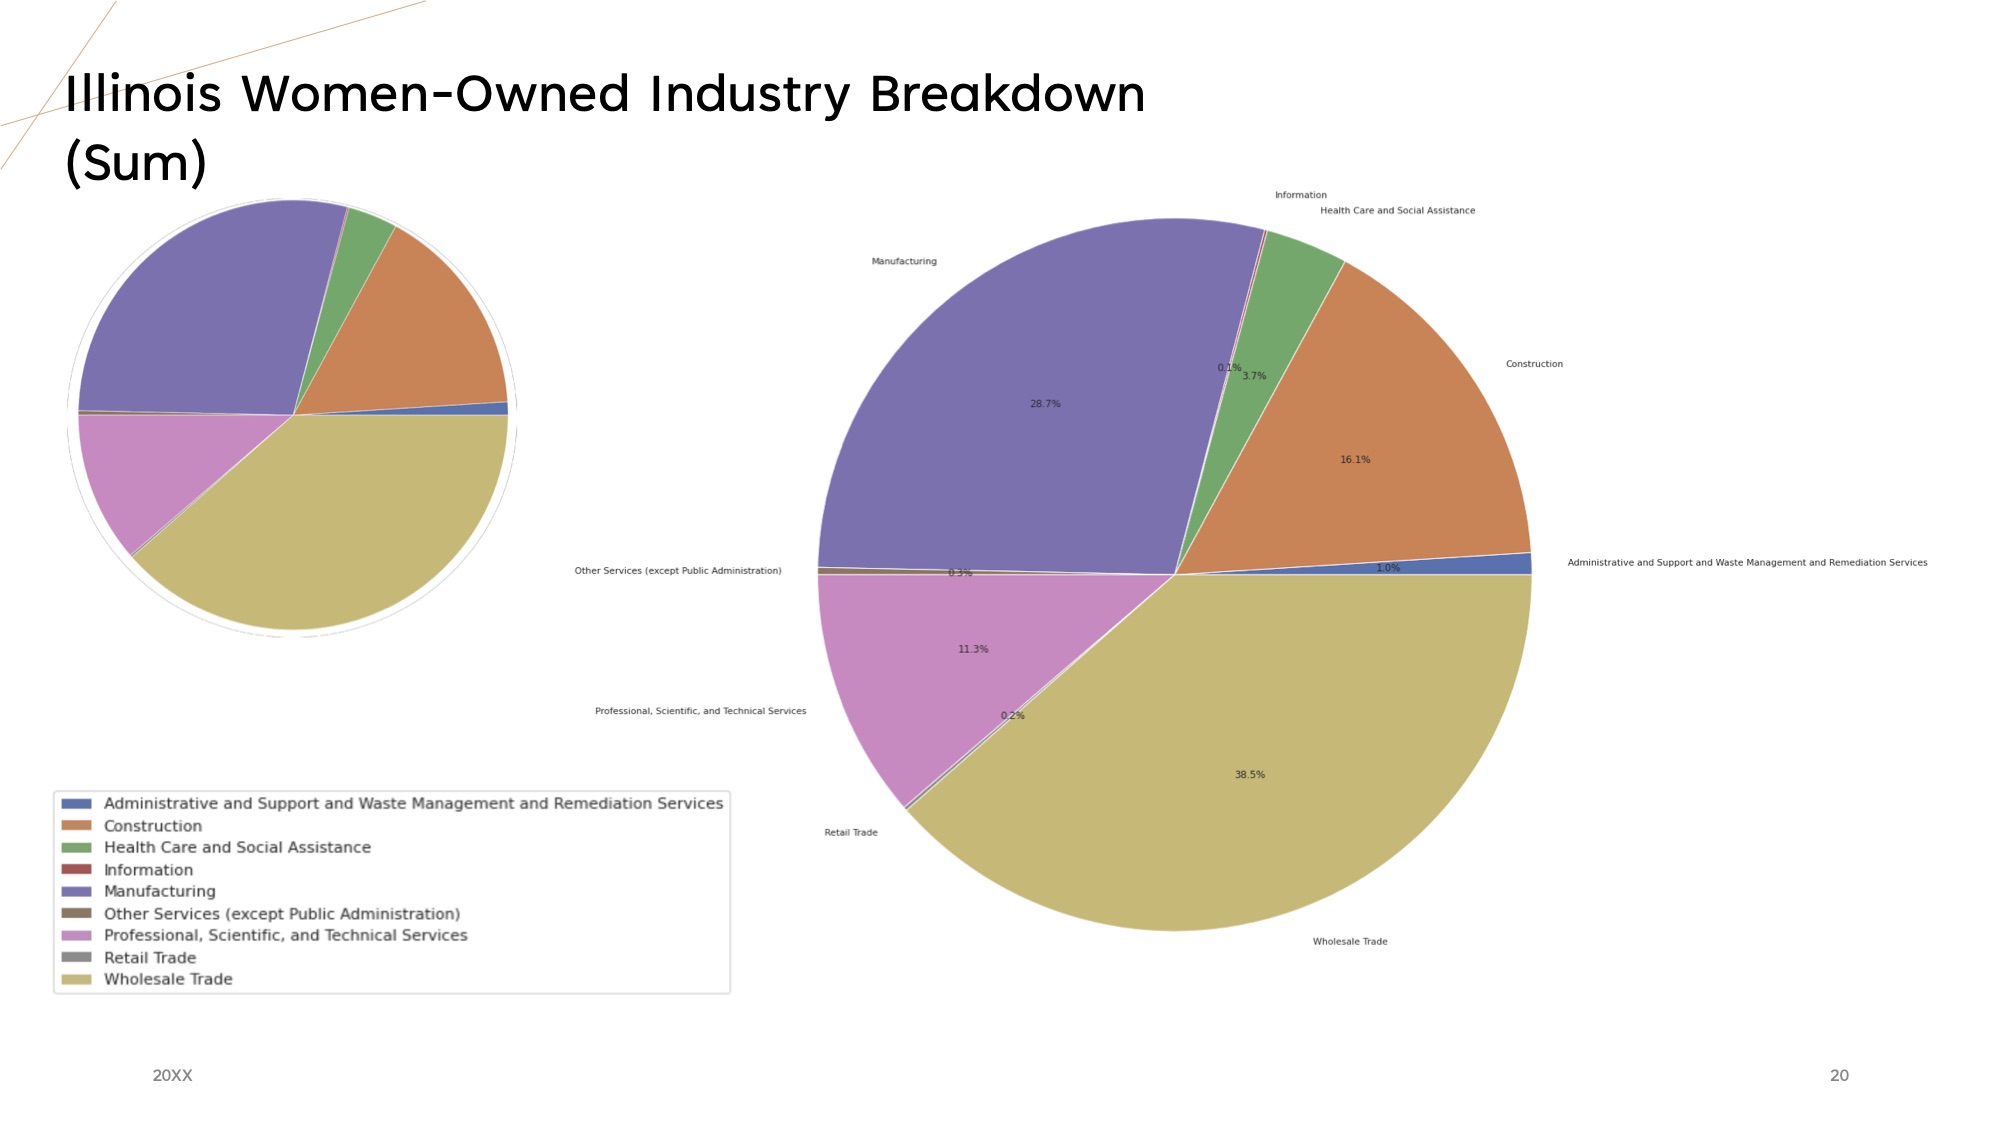
Creating visualizations to represent woman-owned versus nonwoman-owned businesses, minority versus not minority-owned businesses, and what particular industries some of these contractors that are woman-owned are in versus the industry distribution of all government contractors who received bids.
How we built it
We utilized Python Jupyter notebooks.
Challenges we ran into
Cleaning the data was a challenge. We were able to exclusively look at contracts with total obligated amounts greater than $25K and Modification number of zero indicating they are not a modification to an existing contractor.
Accomplishments that we're proud of
We believe we found some interesting insights, particularly looking at industry distribution for woman and nonwoman-owned businesses.
What we learned
We learned more about python libraries including pandas, matplotlib, and seaborn, in addition to learning interesting information about the dataset we were looking at. Also, we learned how to work together as a team, and prioritize work in a crunch-time type situation.
What's next for DATATHON: THE MASON PANDAS
These data insights are just the beginning. In the future, more in-depth analysis could be conducted. Also, if we were able to find more information regarding those who applied for these bids, we could determine more about why contractors may lose bids. This is something we could explore in the future. In addition, we will all take what we learned into consideration through our regular workdays, especially if we interact with government contractors.

Log in or sign up for Devpost to join the conversation.