-
-
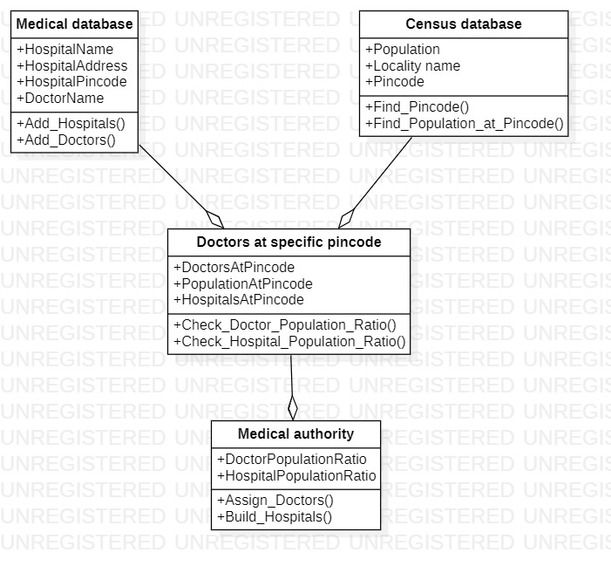
Class Diagram
-
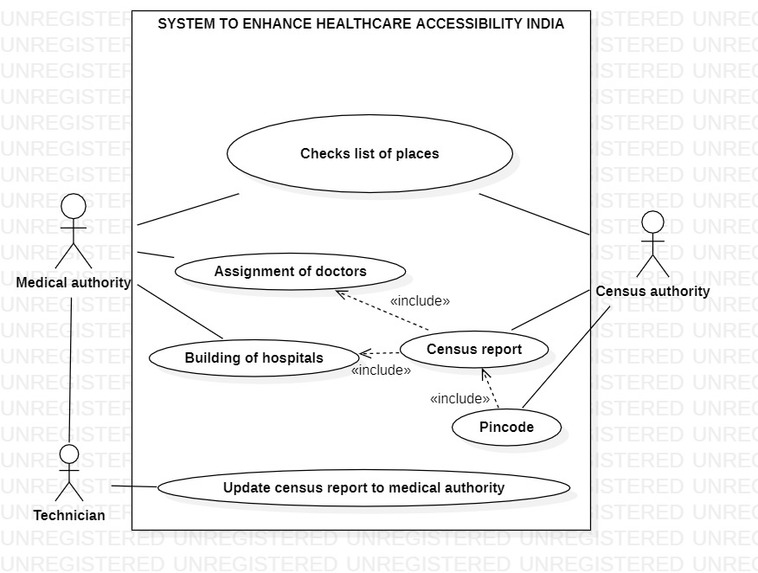
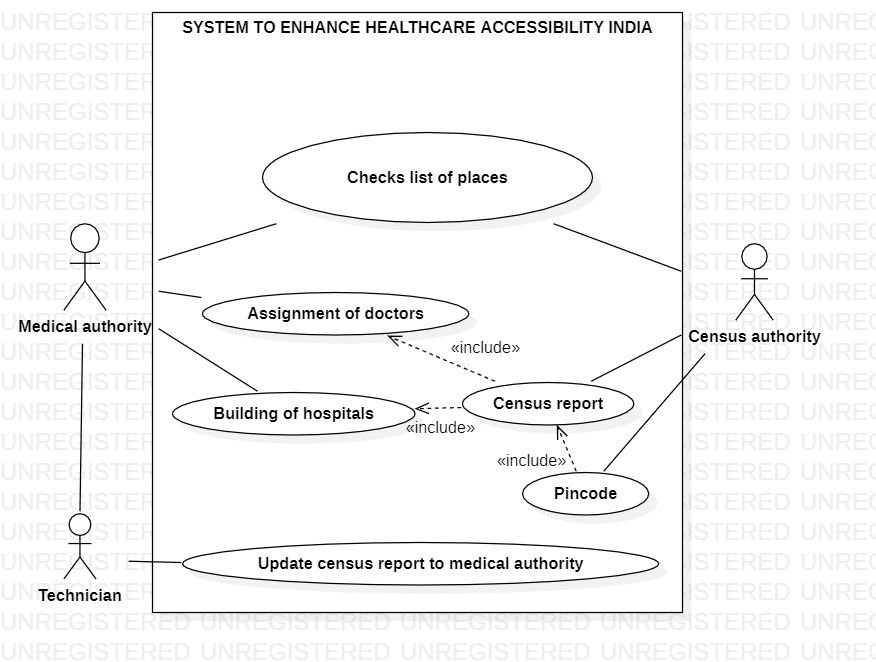
Use Case Diagram

Inspiration
The doctors and interns around me seemed to have a hectic life with bad work life balance often due to high workload. I believed that proper allocation of resources would lessen their burden and would allow them to give better quality of service. And hence this project.
What it does
Collect and analyze data related to stress levels among medical doctors. Identify the prevalence and patterns of stress and its associated risk factors. Develop predictive models to determine the likelihood of doctors experiencing stress. Provide actionable insights to healthcare systems for resource allocation and interventions. Incorporate location data to offer a more comprehensive view, from countries to states. Ultimately, the project seeks to reduce stress among medical doctors, improve healthcare quality, and enhance the overall well-being of healthcare professionals. We suggest integrating the already existing telemedicine services as a practical answer that would greatly help in solving the problem as early as possible.
How I built it
I built this project using a data-driven approach focusing on data preprocessing, analysis, and machine learning. However, the exciting part is that this project is scalable to larger nations like India, where the incorporation of geographical data can significantly enhance the efficiency of our prediction model. By harnessing geographical information, we can offer more precise insights and interventions, making a substantial impact on healthcare quality and the well-being of medical professionals on a national scale.
I developed this project using a tech stack tailored for data-driven solutions. Our primary tools and technologies include:
Python: We leveraged Python as our core programming language, which is ideal for data analysis and machine learning.
Libraries and Frameworks: We harnessed the power of data science libraries such as pandas, Matplotlib, Seaborn, Scikit-Learn, and Random Forest to manipulate data, create visualizations, perform analysis, and build machine learning models.
Excel: For data manipulation and initial data exploration, we used Microsoft Excel.
Machine Learning: We applied Random Forest to create a predictive model as a part of our solution.
While we've already made significant progress, the scalability of our project is where it truly shines. By integrating geographical data, we can extend our solution to address the challenges faced by large nations like India more efficiently and comprehensively.
Challenges I ran into
Getting the right data set was the biggest challenge. I need a dataset with survey done by doctors with their location and work hours as a parameter which had to be made and I had limited time to put a survey out. I used the data set from The major worldwide stress of healthcare professionals during the first wave of the COVID-19 pandemic – the international COVISTRESS survey | PLOS ONE https://journals.plos.org/plosone/article?id=10.1371/journal.pone.0257840 This allowed me to go ahead with the project although the location parameter is wide and used for the continent sense. I believe that with the right dataset that can be collected we can give better work life balance to the people who protect us.
Accomplishments that I'm proud of
I am happy that I decided to do a simple POC for this project as this is my first data science project. I was really happy when the simple parts of the code worked, from see the head of the data set in pandas to the really cool visualization libraries with cool names like seaborn. The visualization part was awesome. At last to blow me away was the prediction models itself which are very interesting and it's exciting to see how the world would change in so many ways with these models around.
What I learned
I learnt about the data science libraries in python although I predominantly used python in web applications and NLP libraries, it was an interesting experience to work on a different domain project. In fact, I believe I can take these skills I learnt to other projects to perform data analysis and data visualization using the cool matplotlib and seaborn libraries. I also had a feel for the pandas libraries as well. Learning about hot encoding the data and pre-processing the data was a very knowledgeable process. Working on this project made me get a feel of how data science projects are made and worked on.
What's next for Datathon
Well, if the project does work out, I want to make a proper survey and distribute it. Then take the data as I wanted and then perform the predictive analysis so that it can be put into action as early as possible so that some doctors can sleep better a little early.
Built With
- excel
- matplotlib
- pandas
- python
- random-forest
- scikit-learn
- seaborn

Log in or sign up for Devpost to join the conversation.