Drop a CSV. Get a publishable data story — autonomously.
Inspiration
Every newsroom, nonprofit, and city agency sits on mountains of data they never turn into stories. The bottleneck is not data — it is the hours of cleaning, exploring, testing, and writing that stand between a spreadsheet and an insight anyone can act on. We wanted to see if a truly autonomous agent could close that gap: hand it a CSV, walk away, and come back to a finished, publication-quality data story.
What it does
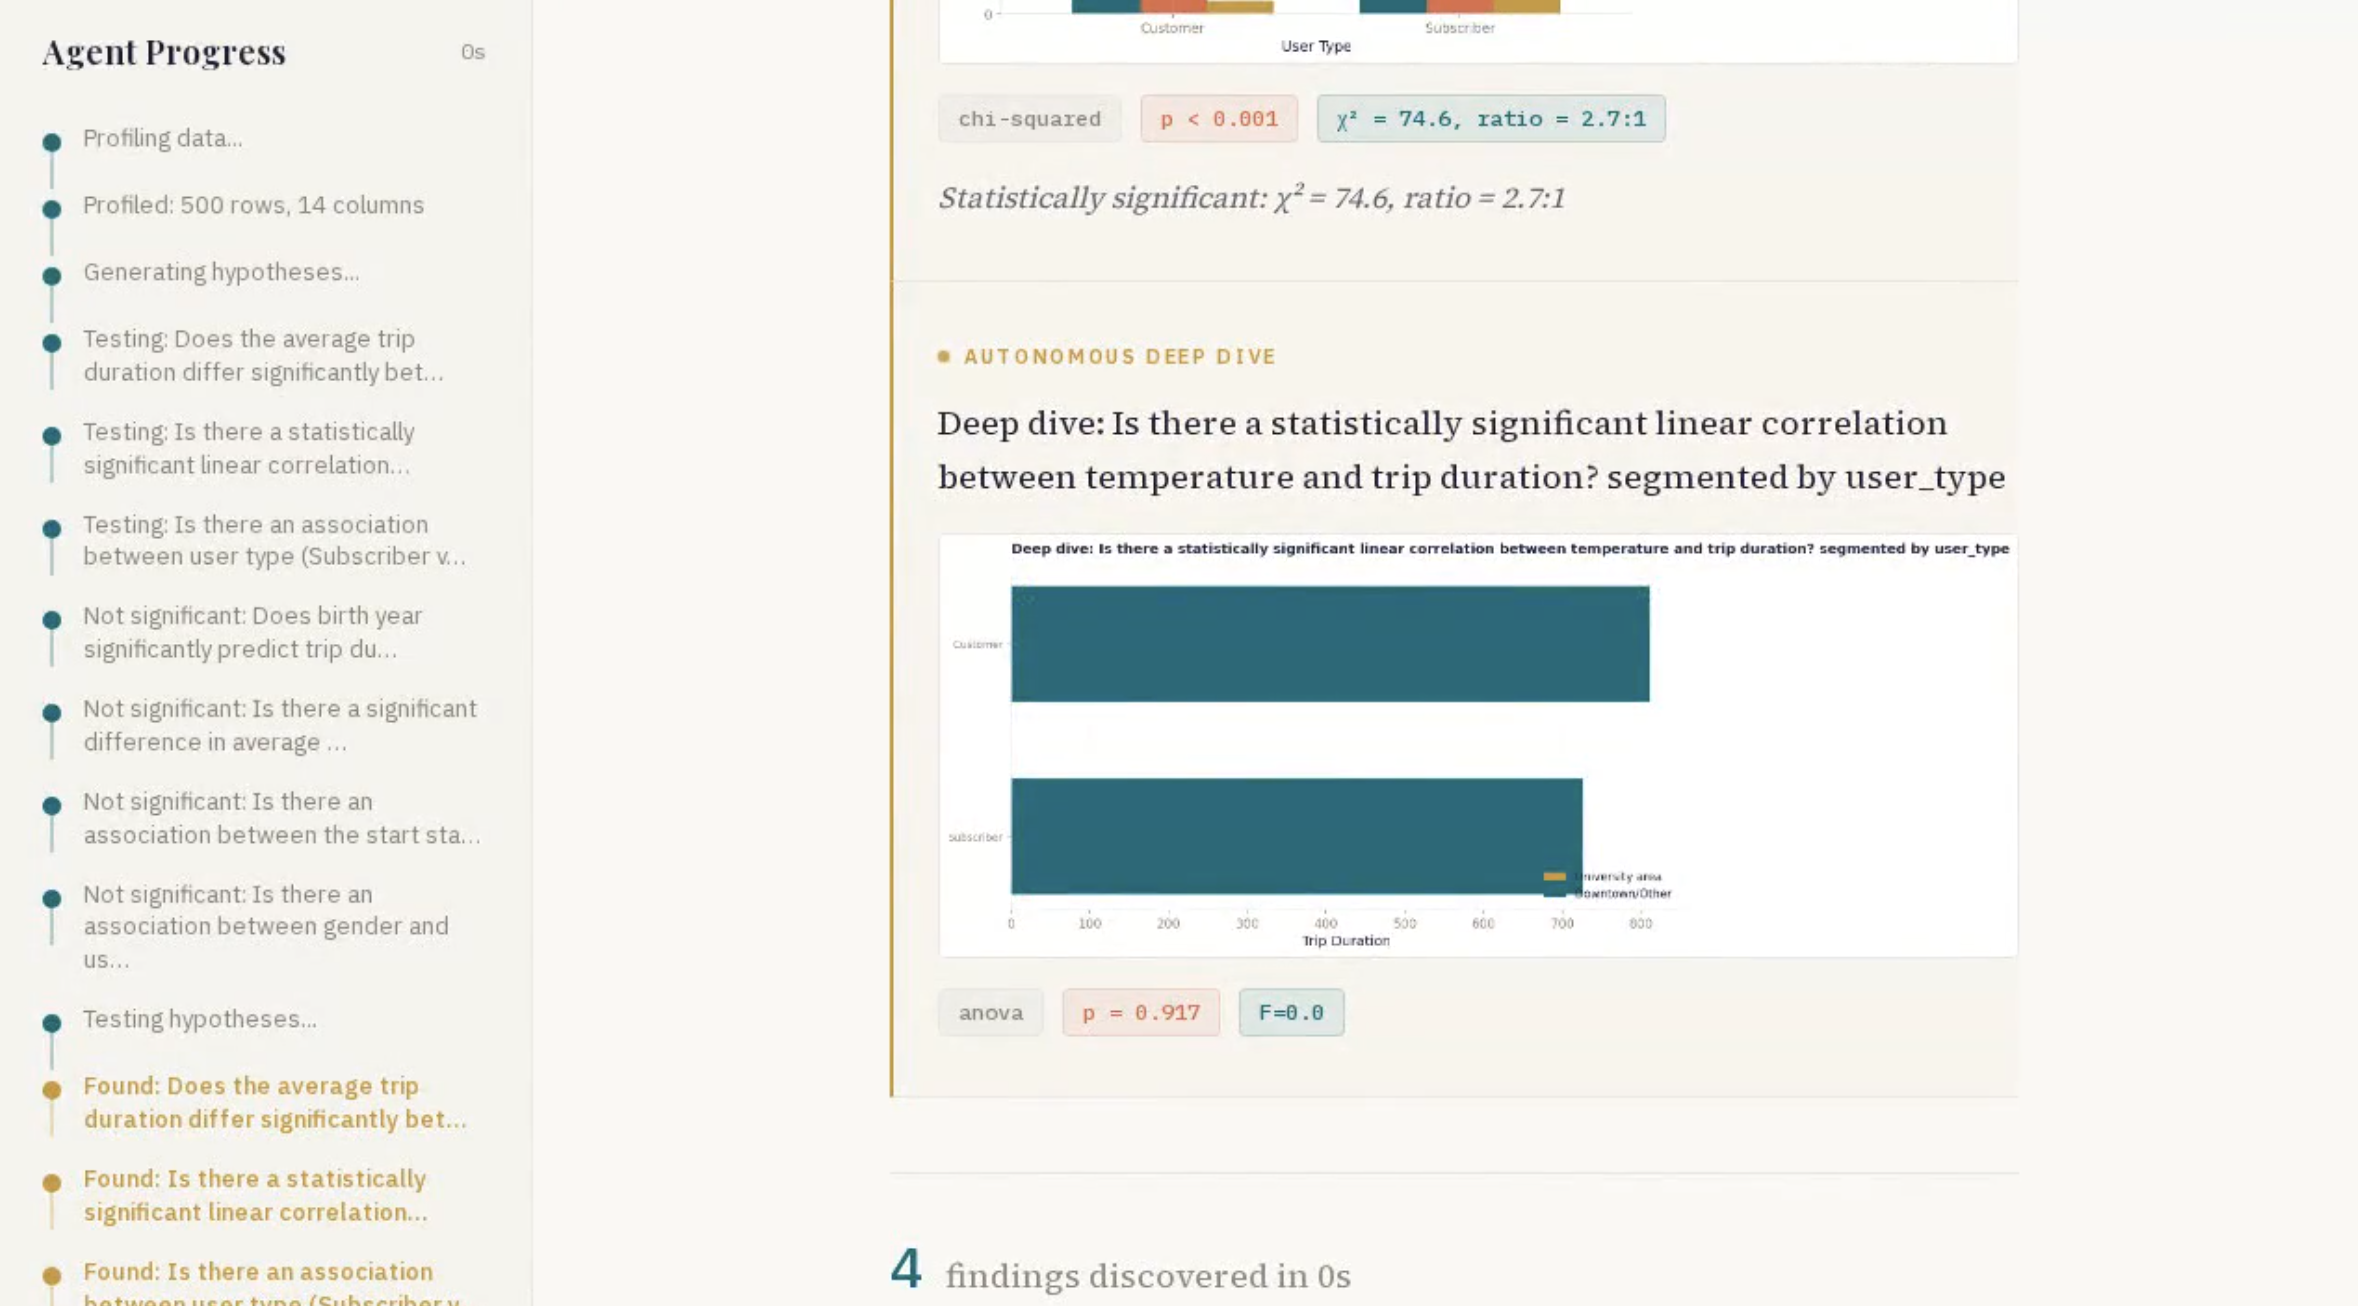
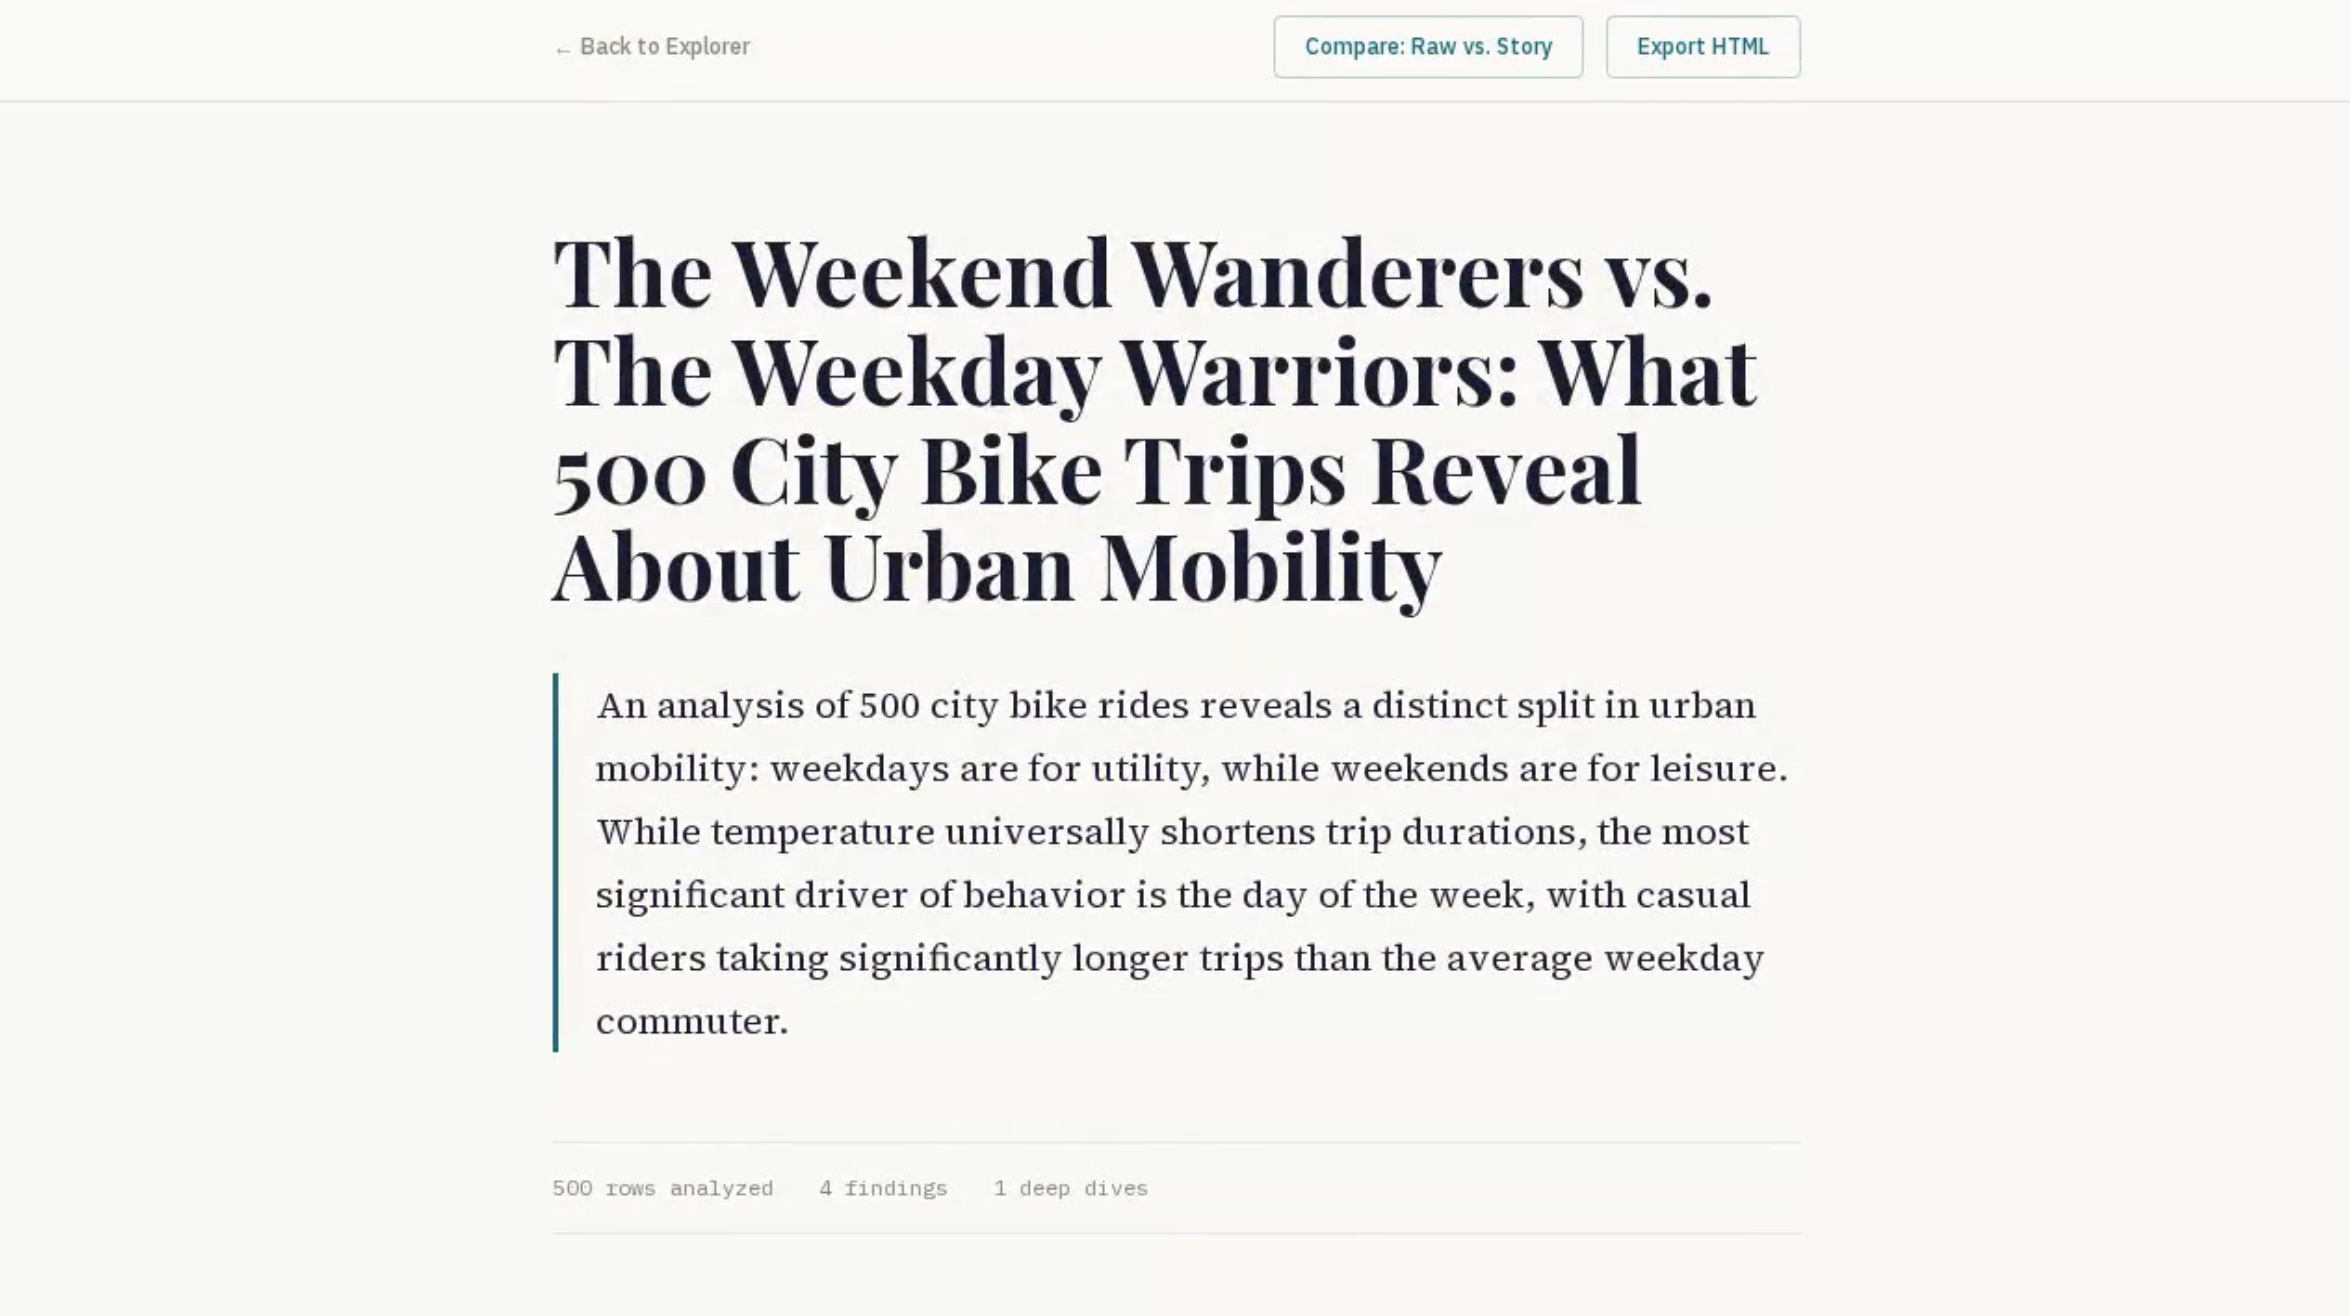
You upload a CSV file. That is the only thing you do. DataStory takes over from there. It profiles your data — column types, distributions, missing values — then generates hypotheses worth testing. It runs real statistical tests (chi-squared, t-tests, correlations, regressions) to separate genuine patterns from noise. Then something unusual happens: the agent picks the most interesting finding it discovered and investigates further on its own, without anyone asking it to. When the analysis is complete, it writes a full narrative report — title, executive summary, key findings with charts, methodology section, and actionable recommendations. You can watch the whole process unfold in real time through a timeline that streams each step as the agent works, or compare the raw CSV side-by-side with the finished story. When you are satisfied, export the report as HTML and share it.
We tested it with a dataset of 500 city bike-sharing trips containing trip duration, station names, user types, gender, birth year, temperature, and day type. Within minutes, DataStory surfaced that casual riders took significantly longer trips than subscribers, that temperature had a measurable effect on ride duration, and — during its autonomous deep dive — discovered an unexpected age-related pattern in trip behavior that none of us had noticed manually.
How we built it
The frontend is built with Next.js 16 on React 19, styled with Tailwind CSS and written in TypeScript. It handles file uploads, streams findings in real time, and renders the side-by-side comparison and final report views. The backend is a FastAPI service in Python that orchestrates the entire agent pipeline. pandas, scipy, and numpy handle the statistical heavy lifting, while matplotlib and seaborn generate the charts.
GLM 5.1 is the brain behind every autonomous decision. It reasons over data profiles to generate testable hypotheses, writes the statistical test code, decides which finding deserves a deeper investigation, and authors the complete narrative report. We leaned hard on its 131K output window to produce long-form, structured reports in a single pass without chunking or stitching.
The frontend is deployed on Vercel and the backend on Render, connected through a streaming API so results appear as the agent works rather than after a long wait.
Challenges we ran into
Getting the agent to write statistically valid test code on the first try was harder than expected. Early iterations would pick the wrong test for a column type — running a t-test on categorical data, for example — so we invested heavily in the profiling step to give the model rich context about each column before it chose a test. Streaming intermediate results through FastAPI to the Next.js frontend required careful handling of server-sent events and partial JSON payloads. And honestly, tuning the autonomous deep-dive prompt took more iterations than any other piece — the agent needed to be curious enough to investigate but disciplined enough to stay relevant.
Accomplishments that we're proud of
The autonomous deep dive. This is not a chatbot waiting for your next prompt. The agent finds a statistically significant pattern, evaluates whether it is interesting enough to warrant further investigation, and then designs and executes a follow-up analysis — all on its own. When we watched it discover an age-related riding pattern in the bike-sharing data and then spontaneously break it down by user type, it felt like the moment the project crossed from "tool" to "agent." That is the behavior we set out to build, and it works.
What we learned
We learned that the gap between "the model can do analysis" and "the model can do analysis autonomously and reliably" is enormous. Giving an LLM a single task is easy. Giving it a pipeline where each step depends on the last, where it has to make judgment calls about what to explore next, and where the output has to be statistically sound — that requires careful orchestration, rich context at every step, and a lot of testing with real data. We also learned that streaming intermediate results changes how people feel about AI tools; watching the agent think makes people trust it more than seeing a finished result appear out of nowhere.
What's next for DataStory
We want to support multi-file analysis so the agent can join and compare datasets, add interactive chart editing in the browser, let users ask follow-up questions about the report in a conversational mode, and support more file formats beyond CSV. Longer term, we envision DataStory as the foundation for an autonomous data journalism assistant — one that can monitor public datasets, detect meaningful changes, and draft stories for human editors to review and publish.
Built With
- Next.js 16
- React 19
- TypeScript
- Tailwind CSS
- FastAPI
- Python
- GLM 5.1
- pandas
- scipy
- numpy
- matplotlib
- seaborn
- Vercel
- Render
Built With
- fastapi
- nextjs
- z.ai

Log in or sign up for Devpost to join the conversation.