Inspiration
Looking through the datasets, we found these two to be the most interesting.
What it does
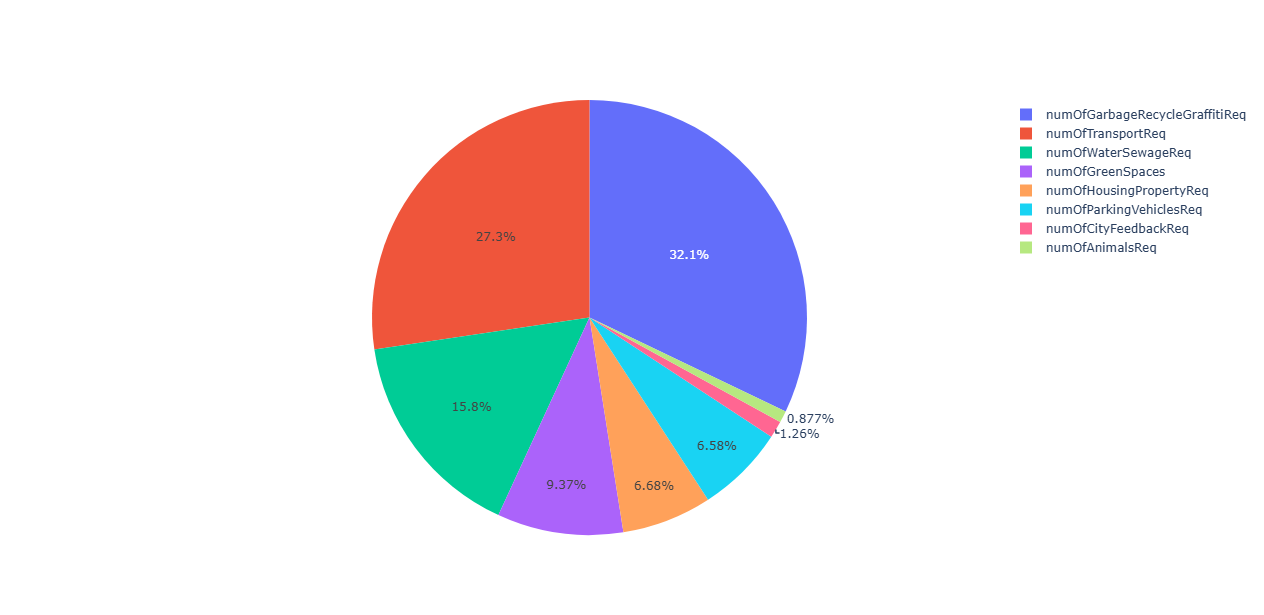
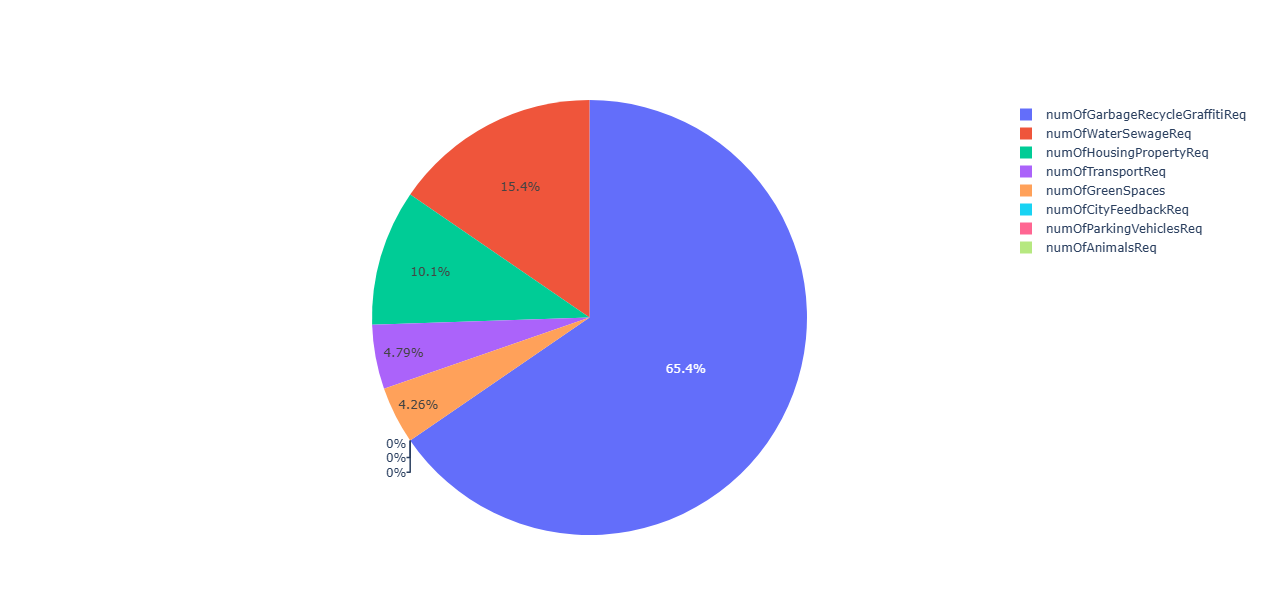
Creates a pie chart of the agencies in the different areas of high parking violations.
How we built it
Using python.
Challenges we ran into
Visualizing the data.
Accomplishments that we're proud of
Overcoming the challenge of making the pie chart.
What we learned
To work together.
What's next for Dataset of Agencies in areas of Parking Violations
Create more visualizations in the future.

Log in or sign up for Devpost to join the conversation.