DataPulse for DataHub
Continuous intelligence monitoring that writes back to your data catalog
Inspiration
DataHub solves the metadata problem brilliantly — lineage, ownership, schema, governance, all in one place. But there's a gap: it tells you everything about what your data looks like, and nothing about what your data is doing.
A dataset can have perfect ownership, a clean schema, and a passing health check — and still be quietly drifting. Freshness degrading. Correlations breaking. The catalog has no way to see it coming.
The question we started with: what if the catalog could watch its own data over time, detect when something structurally shifted, and surface that intelligence directly in DataHub — without requiring a separate monitoring tool?
What it does
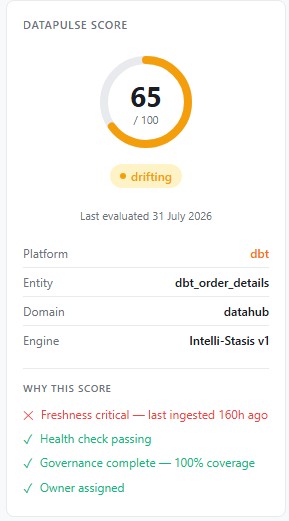
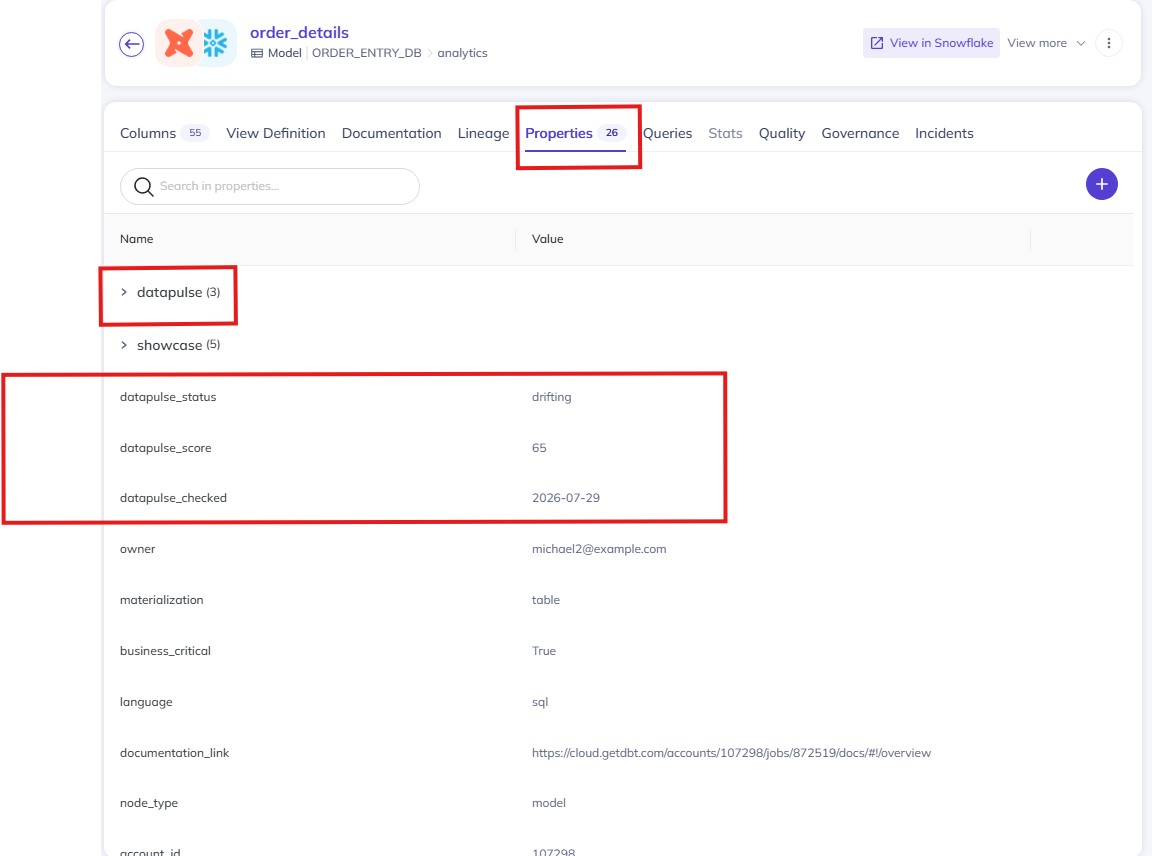
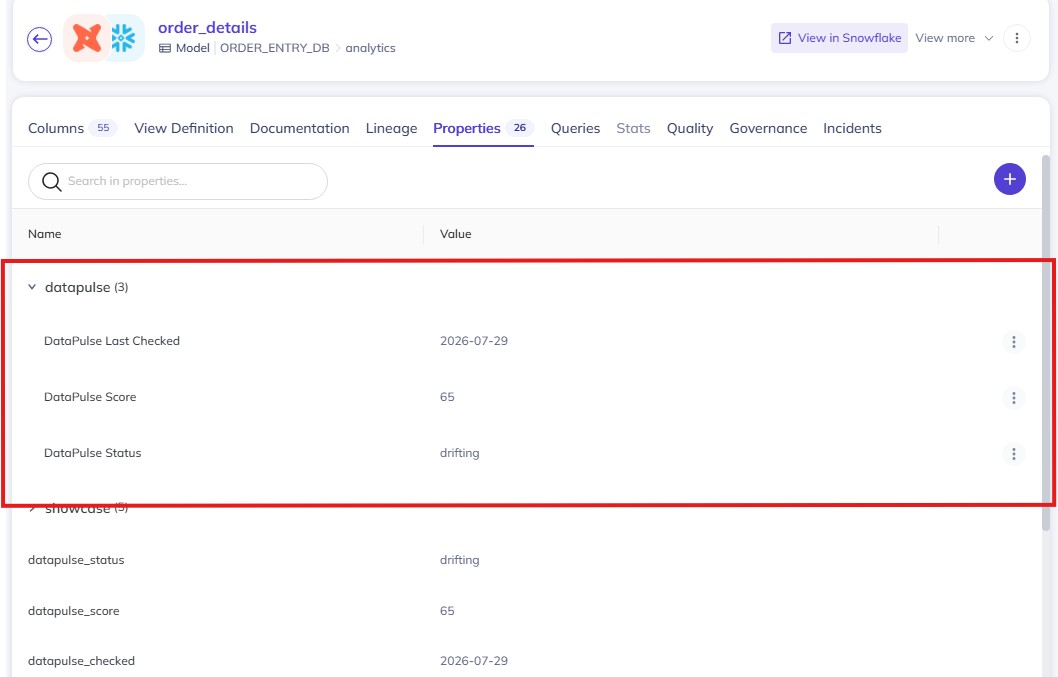
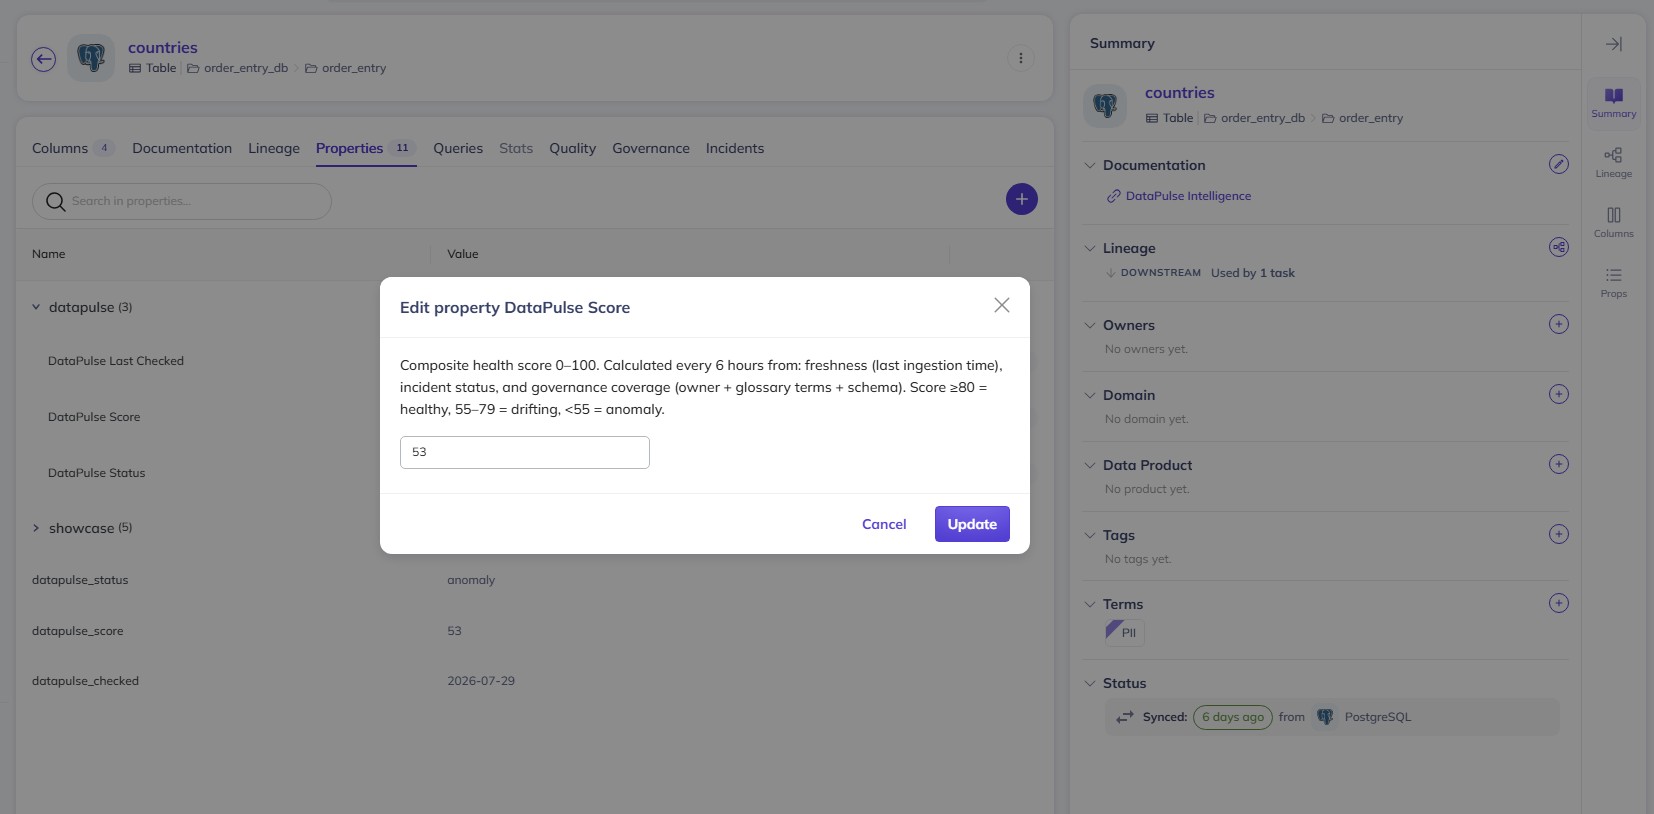
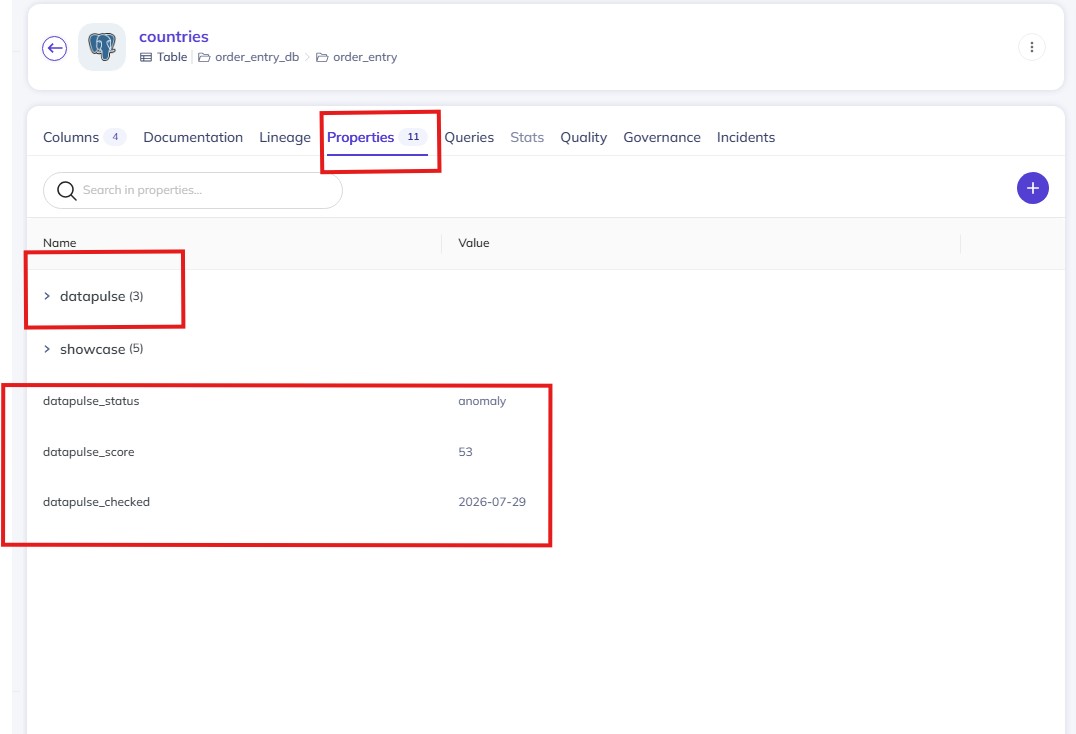
DataPulse connects DataHub to the Intelli-Stasis intelligence engine. Every 6 hours it pulls metadata signals from every dataset, dashboard, and data job in your catalog and runs them through structural break detection and cross-entity correlation analysis. The results write back to each dataset as DataHub structured properties — a DataPulse score (0–100), a status (healthy / drifting / anomaly / deprecated), and the date of last evaluation — visible directly in the DataHub UI without opening another tool.
Four MCP tools let AI agents query dataset intelligence programmatically:
- datahub_dataset_intelligence — full signal history, breaks, and correlations for one entity
- datahub_health_overview — stack-wide structural breaks and affected entities
- datahub_anomaly_alerts — datasets currently in structural break, ranked by severity
- datahub_correlation_graph — blast-radius analysis: what breaks if this dataset fails
The scoring formula is transparent and auditable: freshness (35pts) + health check pass/fail (40pts) + governance coverage (25pts). The real value isn't the point-in-time score — it's the engine watching scores over time and detecting when a dataset that was always healthy starts drifting, and which other datasets correlate with the shift.
How we built it
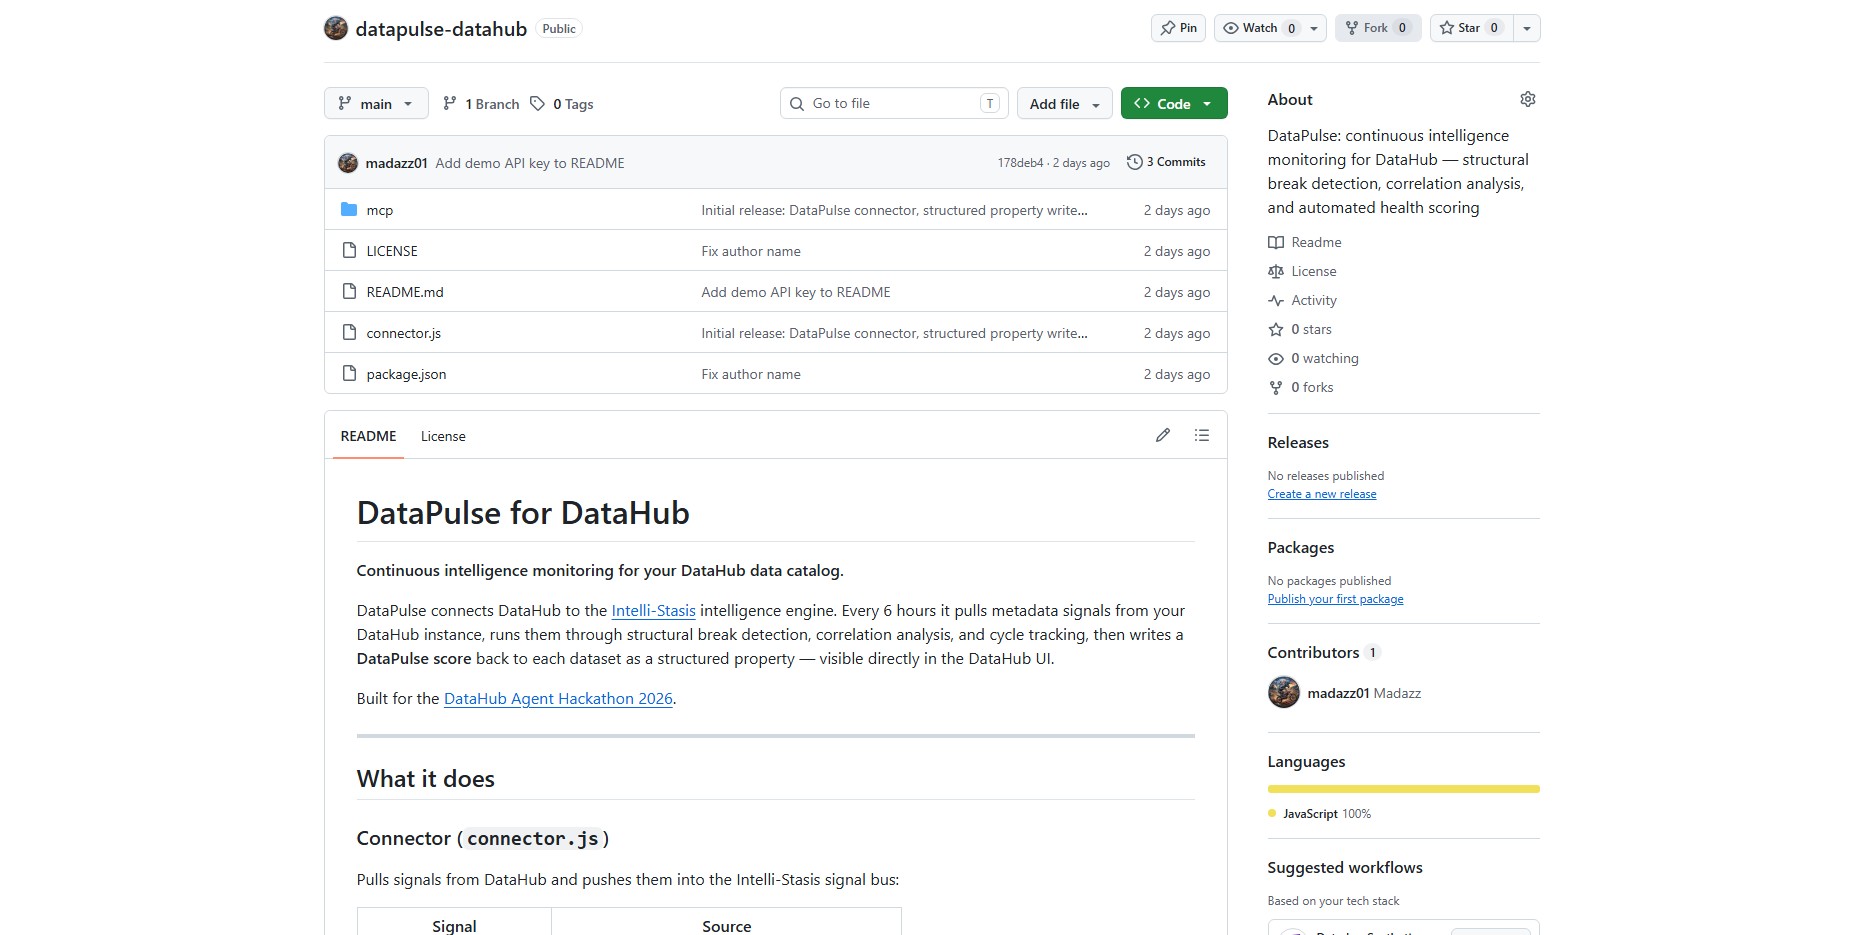
Connector (connector.js): Pulls six signals per entity from DataHub's GraphQL API — hours since last ingestion, health score, field count, ownership coverage, governance score, and deprecation status. Writes them to the Intelli-Stasis signal bus as immutable time-series records.
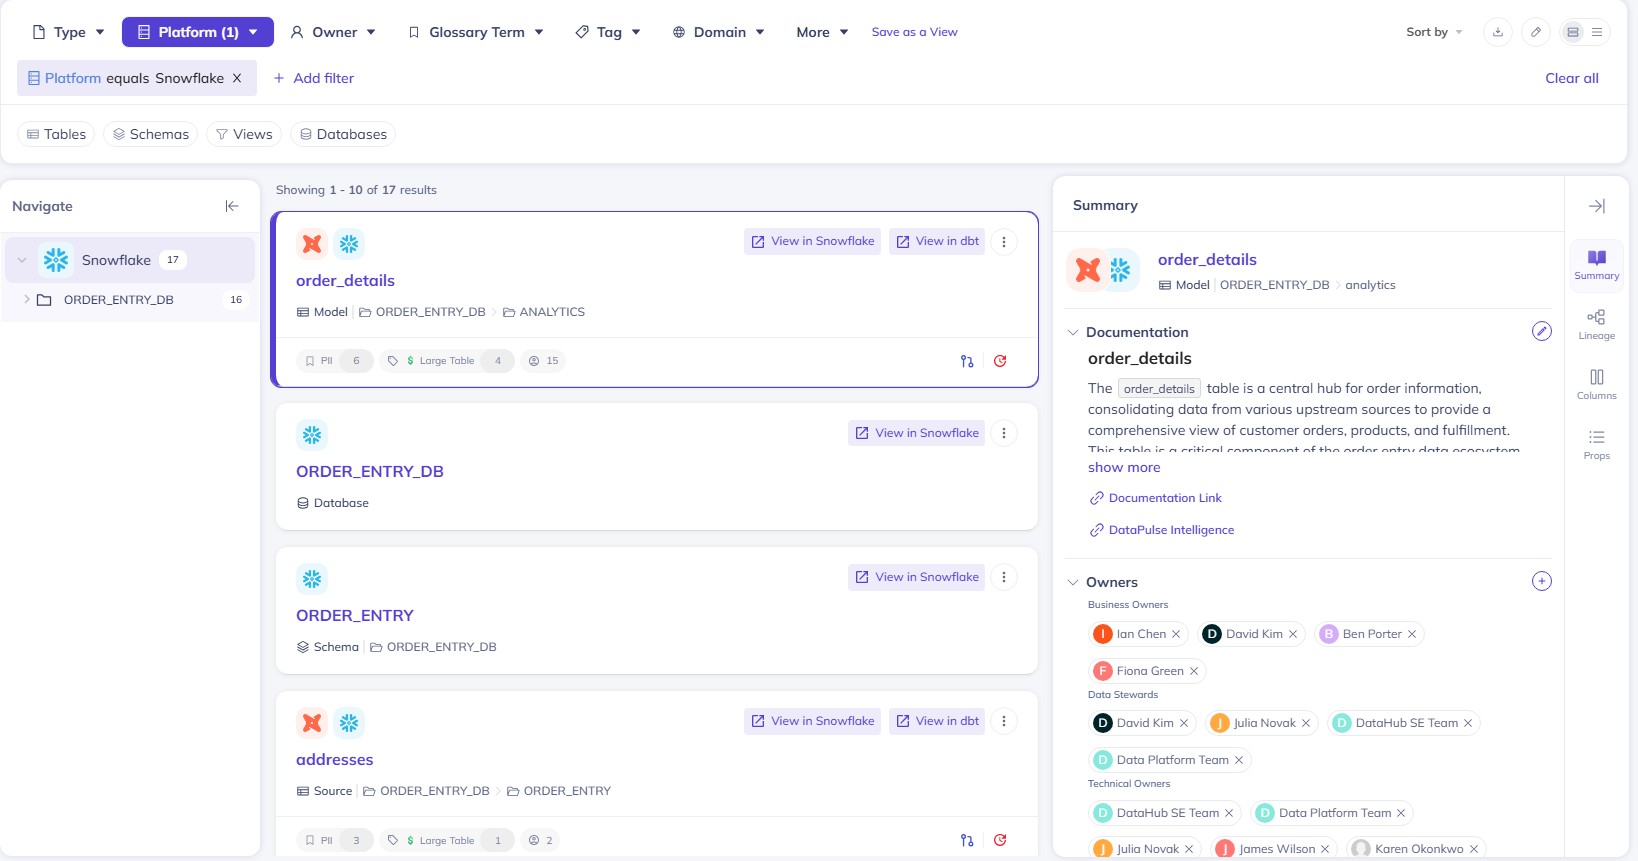
Structured properties: On first run, registers three DataHub structured property definitions via the createStructuredProperty GraphQL mutation (datapulse.score, datapulse.status, datapulse.checked_at). On each run, updates all 67 entities via upsertStructuredProperties. The properties appear as a dedicated datapulse section on every dataset page.
Intelligence engine (Intelli-Stasis): Pre-existing infrastructure — CUSUM structural break detection, Pearson cross-correlation with lag 0–6, PAVA + Bayesian calibration. The DataHub connector plugs into it via a standard signal bus interface. Adding DataHub as a monitored domain required writing one connector, nothing else.
MCP tools (mcp/datahub.js): Four tools registered with the Intelli-Stasis MCP server, calling the intelligence API. AI agents using Claude or any MCP-compatible system can query dataset health, anomalies, and correlation graphs in natural language.
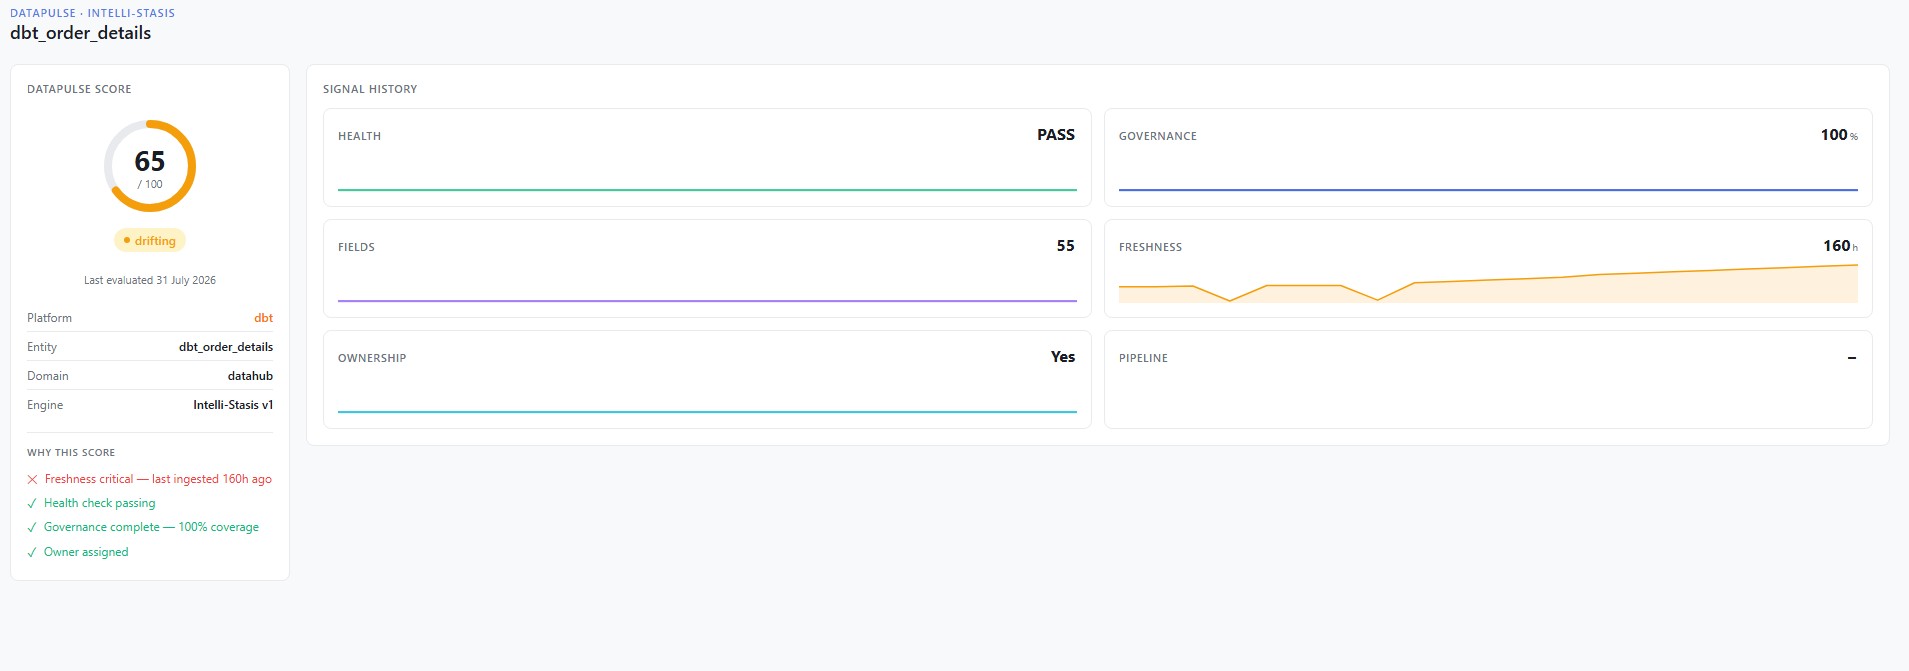
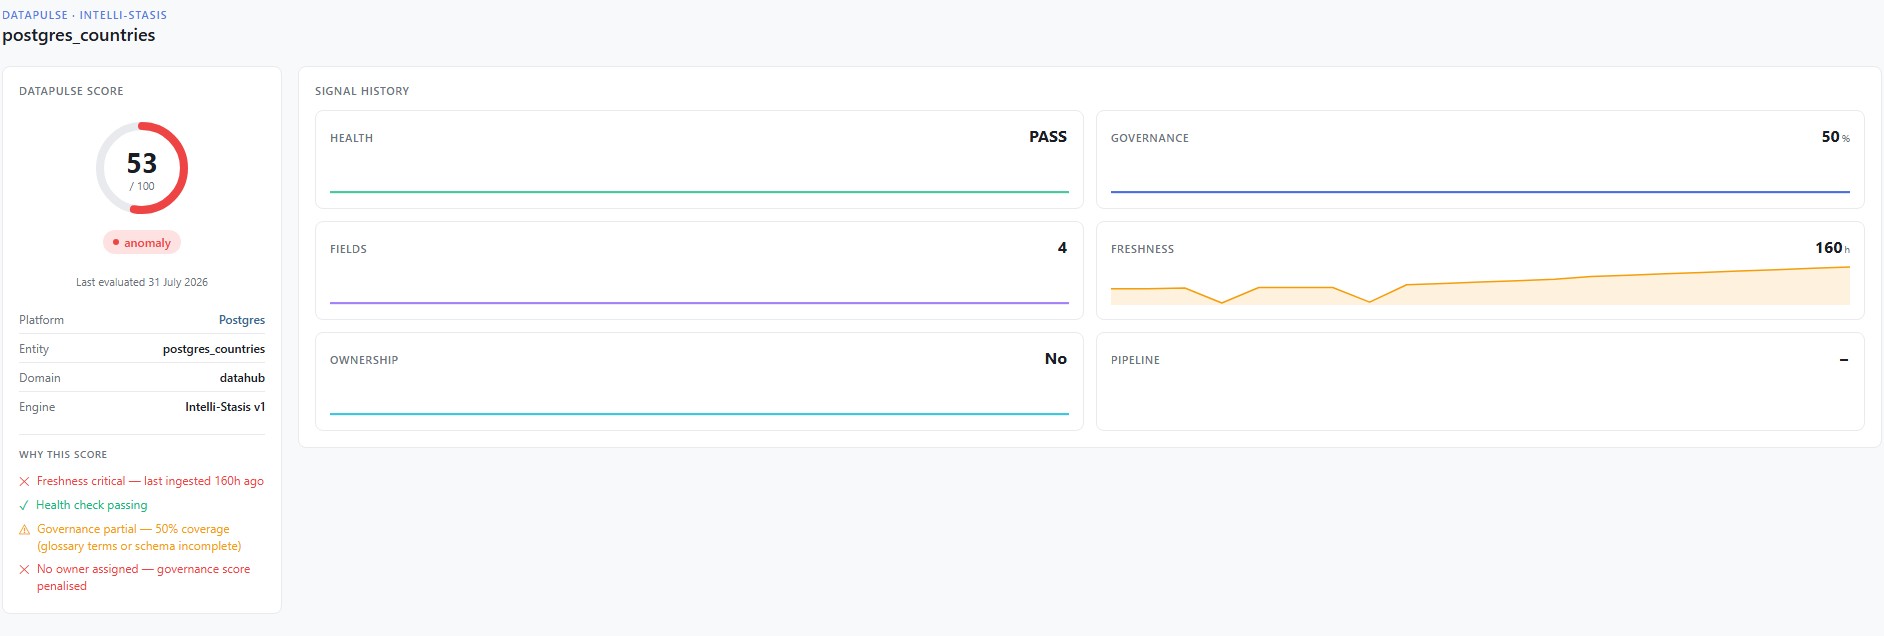
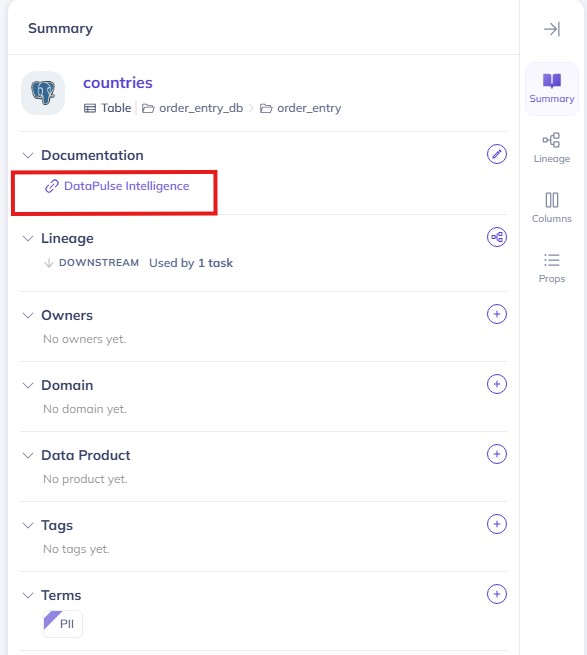
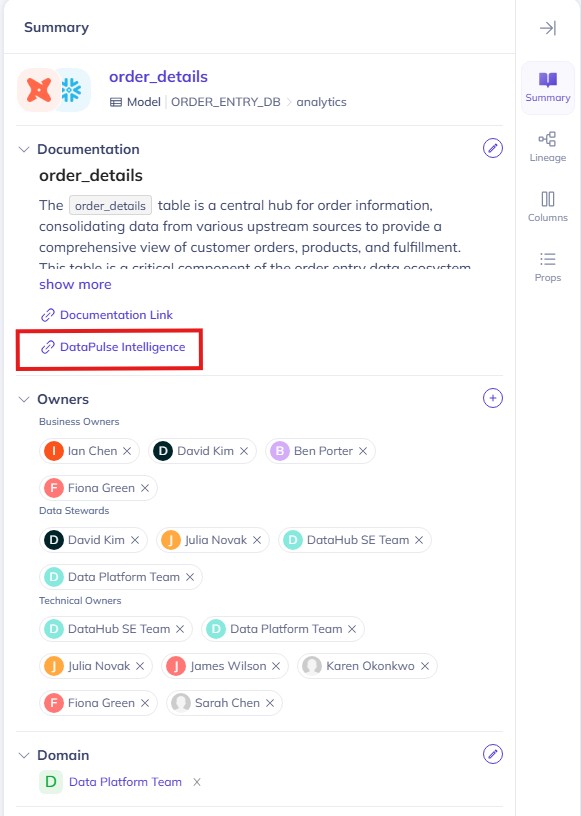
Intelligence dashboard: A lightweight companion page served at api.intellistasis.com/datapulse-plugin.html — linked from every dataset's documentation section. Shows the score ring, status badge, and signal history sparklines for each metric. Fetches live from the API on every load.
Challenges we ran into
Structured properties vs custom properties: DataHub v1.5.0.6's REST v3 endpoint for structured properties returns 405. The only working path is the createStructuredProperty GraphQL mutation — not documented clearly for this version. Several unsupported fields (showInAssetSummary, showInSearchFilters) in the CreateStructuredPropertyInput caused silent failures until stripped.
OpenSearch stability: DataHub's OpenSearch container has no restart policy by default — it was crashing overnight and staying down silently. Fixed with docker update --restart=unless-stopped and a proper startup sequence (OpenSearch must be healthy before GMS restarts).
Entity name mapping: The connector stores entities as platform_name (e.g. snowflake_ORDER_DETAILS) but DataHub URNs expose the fully-qualified identifier. Getting the documentation links to resolve to the correct signal history required replicating the connector's entityKey() function in the link registration script.
Accomplishments we're proud of
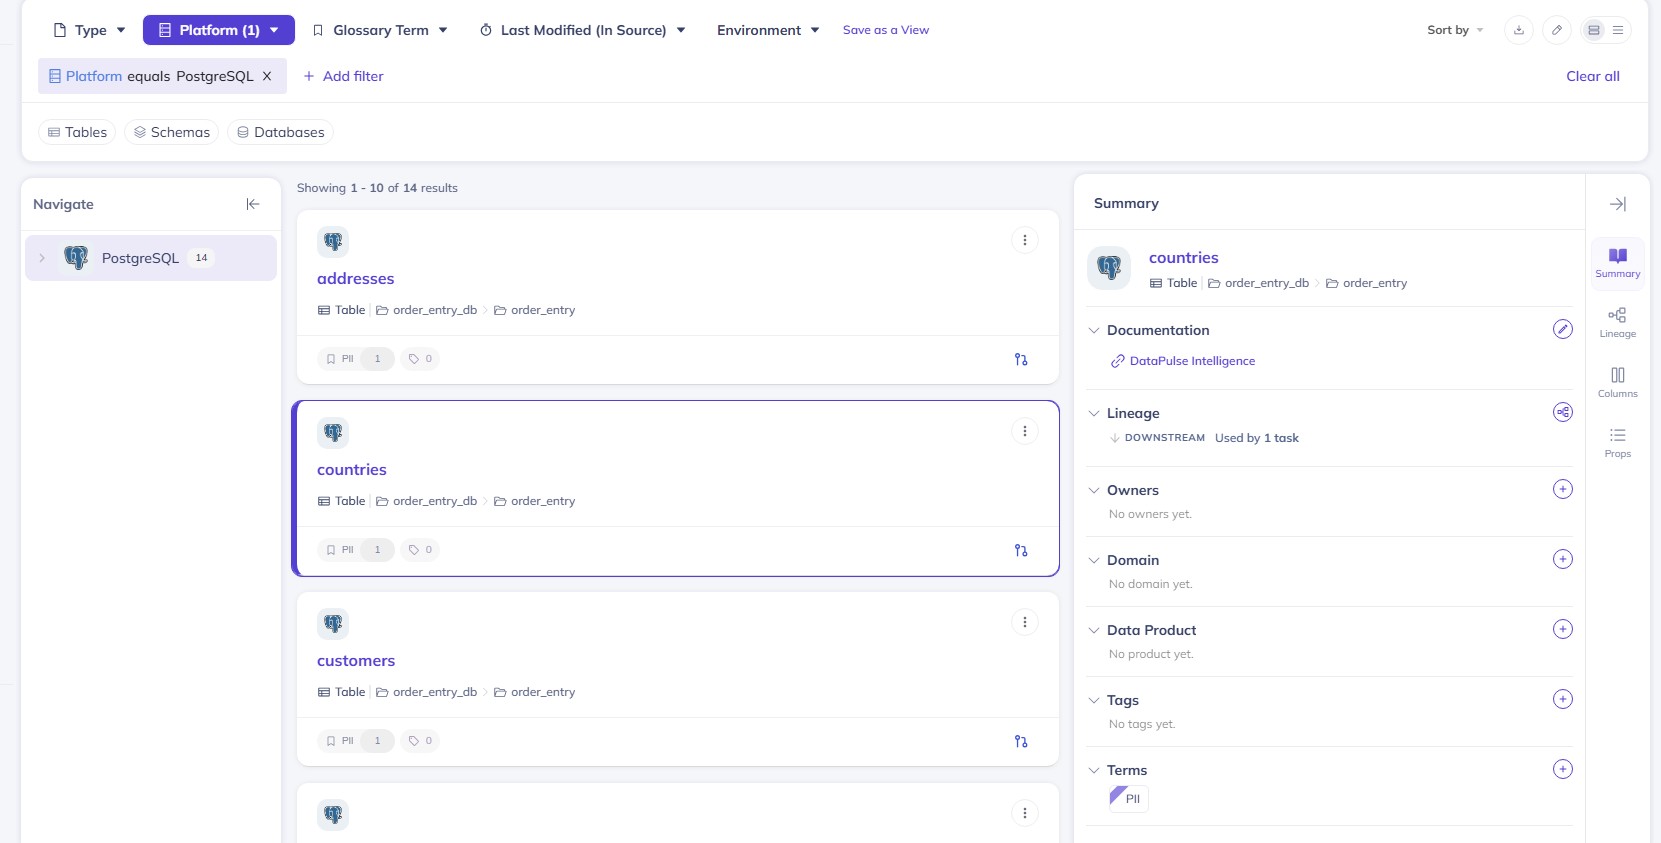
DataPulse scores are live on all 67 datasets in a real DataHub instance — not a mock, not a demo environment. The Intelli-Stasis engine has been running on DataHub metadata for several weeks, building a genuine historical signal record. The freshness sparkline on the intelligence dashboard shows real movement across real connector runs.
The MCP tool interface means this isn't just a dashboard — it's queryable by AI agents. An agent can ask "which datasets are at risk right now" and get a structured answer backed by the same engine.
Everything in the repo runs in three commands against any DataHub instance.
What we learned
DataHub's GraphQL API is more capable than the REST API for anything involving structured metadata — mutations that fail via REST work cleanly via GraphQL. For v1.5.x, GraphQL should be the default approach for anything beyond basic reads.
The harder problem isn't detecting anomalies — it's establishing what normal looks like for a specific dataset over time. A dataset that's always 30 hours stale isn't drifting; a dataset that's usually fresh and suddenly 30 hours stale is. CUSUM handles this well but needs enough history to calibrate. The longer DataPulse runs, the more accurate its signals become.
What's next
- Native DataHub tab via webpack Module Federation — a dedicated Intelligence tab on every entity page, no documentation link required
- Lineage-aware correlation — propagate break signals through DataHub's lineage graph so upstream failures surface before downstream datasets show symptoms
- Alert webhooks — push anomaly alerts to Slack or PagerDuty when DataPulse detects a structural break
- Broader entity coverage — dashboards, data jobs, and data flows currently tracked, governance scoring extended to all entity types

Log in or sign up for Devpost to join the conversation.