-
-
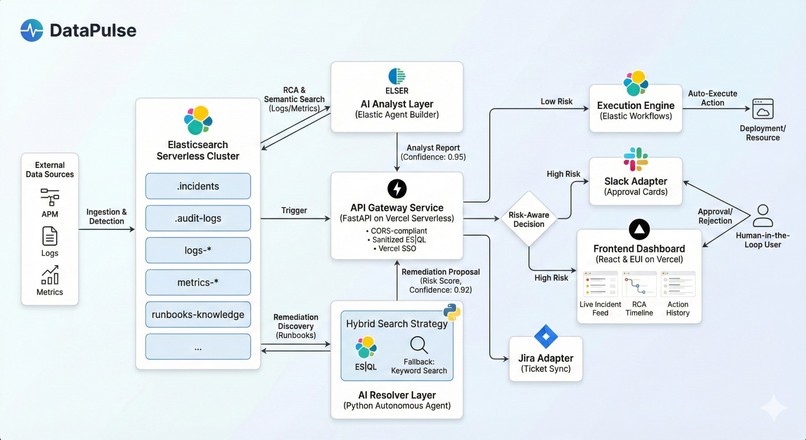
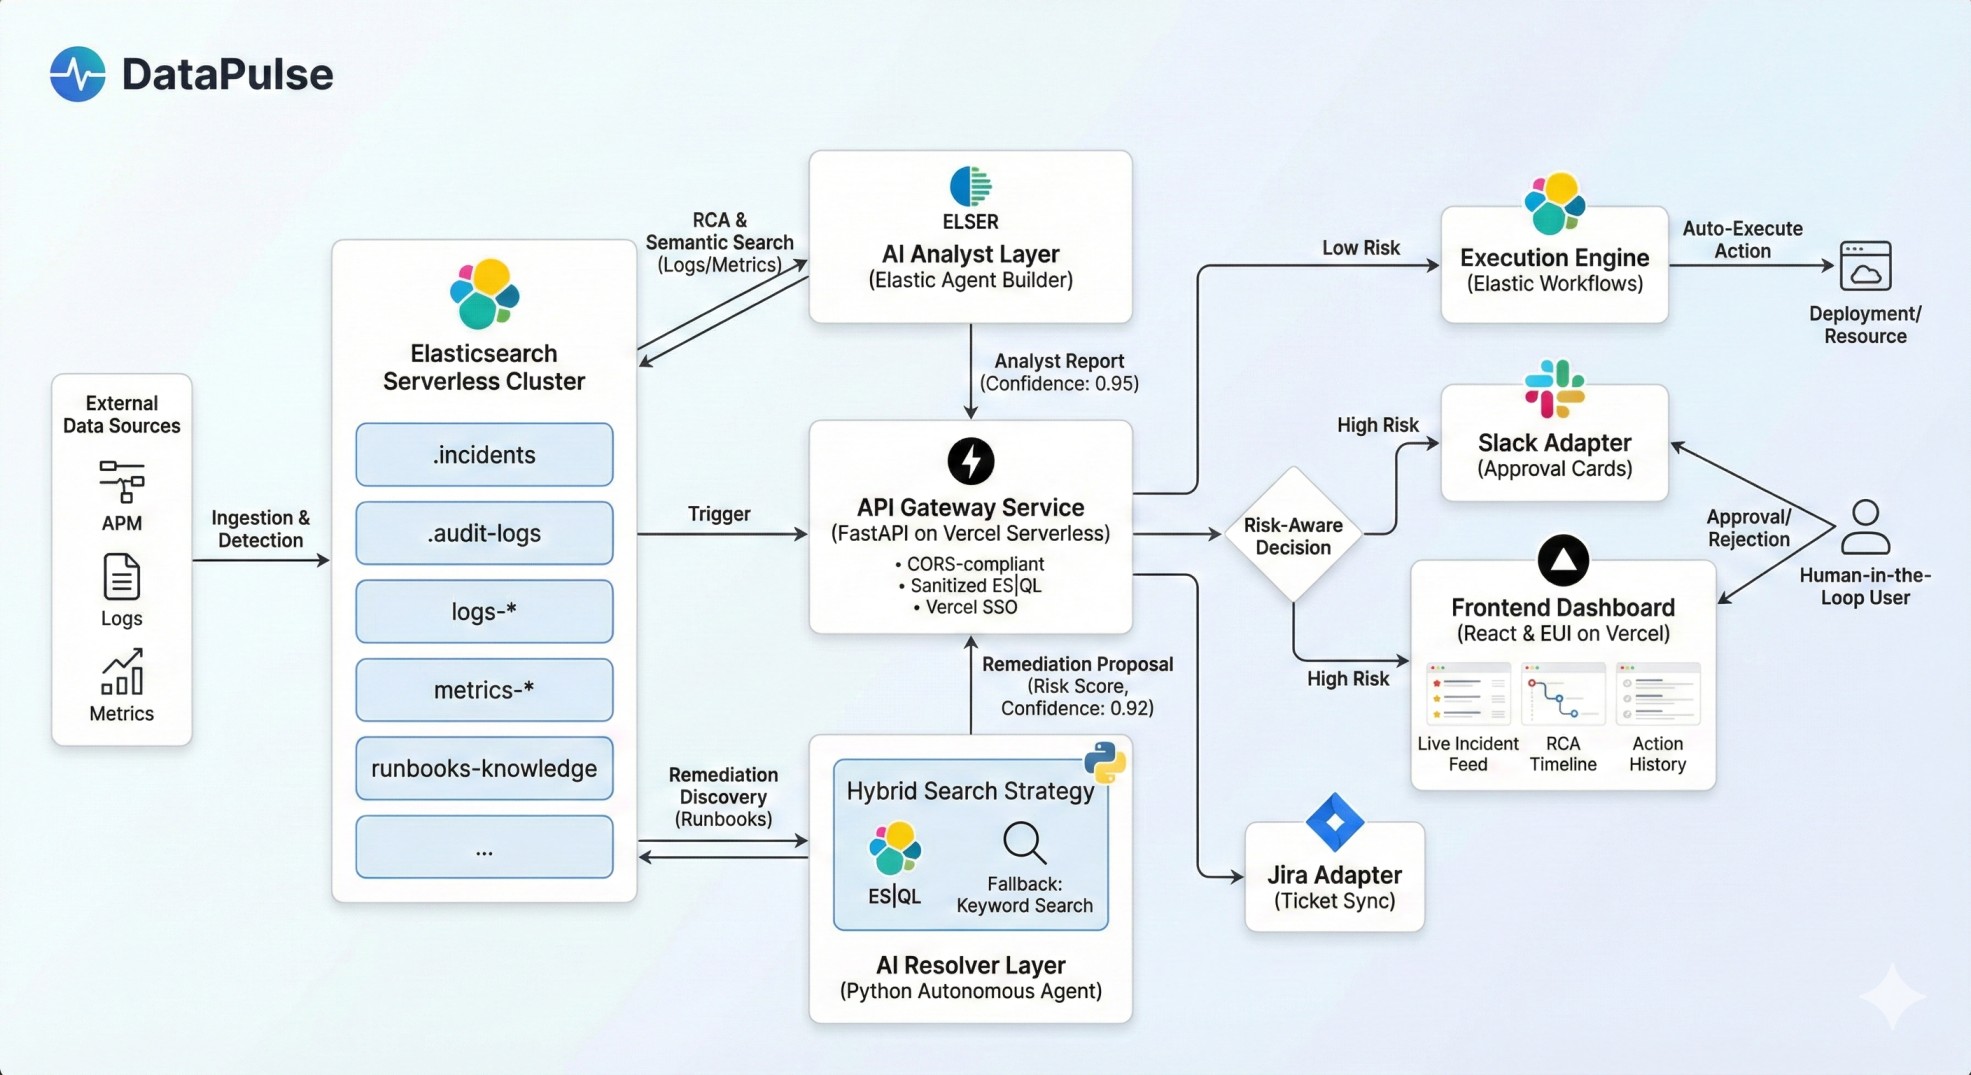
DataPulse: AI-Driven architecture
Inspiration Modern SRE teams are buried in alerts. When a production incident hits at 2AM, engineers spend more time hunting for the root cause than actually fixing it. We wanted to build a system that could do the detective work autonomously querying logs, correlating metrics, and surfacing a diagnosis so humans could focus on making the call, not finding the problem. Elastic's Agent Builder felt like the perfect foundation. It gave us a native way to build reasoning agents that could use real tools (ES|QL queries, log lookups, trace analysis) rather than hallucinating answers.
What It Does DataPulse is an AI-driven, Human-in-the-Loop incident response platform. Here's the flow:
Sentinel continuously analyzes logs for anomalies and fires an incident when thresholds are breached. The Analyst Agent (powered by Elastic Agent Builder) autonomously investigates querying ES|QL, pulling traces, and synthesizing a root cause. The Resolver Agent matches the RCA findings against a runbook knowledge base using ELSER v2 semantic search and recommends a remediation strategy (rollback, scaling, config change, etc.). The proposed fix is routed to Slack or Jira for human approval. Engineers can approve or reject production changes directly from a Slack button no context switching required. Everything is visible in a Kibana-integrated SRE Command Center showing real-time incident tracking, agent thought logs, and operational impact metrics.
How We Built It The architecture is a distributed agent pipeline:
Backend: Python 3.10+ with FastAPI handles orchestration, agent routing, and Elasticsearch persistence. Pydantic models enforce strict data contracts throughout. AI Layer: Elastic Agent Builder drives the Analyst and Resolver agents. ES|QL handles structured log interrogation. ELSER v2 powers semantic search over the runbook knowledge base. Integrations: A custom MCP (Model Context Protocol) server exposes Slack and Jira as tools discoverable by Agent Builder. We added a JSON plugin manifest system so new tools can be loaded at MCP server startup without code changes. Frontend: React + Elastic UI (EUI) renders the SRE Command Center. A Kibana plugin embeds the dashboard natively inside Kibana for teams already living in the Elastic stack. Infrastructure: Docker Compose for local orchestration, with Bash automation scripts for index setup and runbook seeding.
Challenges We Faced Pydantic v1/v2 conflicts were the most painful deployment blocker. The MCP library required Pydantic v1 while much of our stack assumed v2 semantics — resolving this without breaking Vercel builds took significant debugging. Agent determinism was another challenge. Getting the Analyst Agent to reliably produce structured RCA output (rather than freeform text) required careful prompt engineering and output schema enforcement. Elasticsearch index design needed careful thought balancing ILM policies for log retention, vector dimensions for ELSER embeddings, and search template performance under simulated incident load.
What We Learned
Elastic Agent Builder is genuinely powerful for tool-calling workflows. The ability to define real ES|QL queries as agent tools and have the agent decide when to call them produces far more reliable RCA than pure LLM inference. MCP is an underrated integration layer. Treating external services (Slack, Jira) as discoverable tools rather than hardcoded integrations makes the system dramatically more extensible. Human-in-the-loop isn't a limitation it's a feature. Giving engineers the final approval on remediation actions builds trust in the system and prevents automated changes from making things worse.
What's Next
RAG-based runbook generation from historical incidents Adaptive agent behavior based on operator trust scores Multi-region incident correlation across distributed Elasticsearch clusters
Built With
- agent
- docker
- elastic
- elasticsearch
- elser
- fastapi
- jira
- kibana
- mcp
- pydantic
- python
- slack


Log in or sign up for Devpost to join the conversation.