-

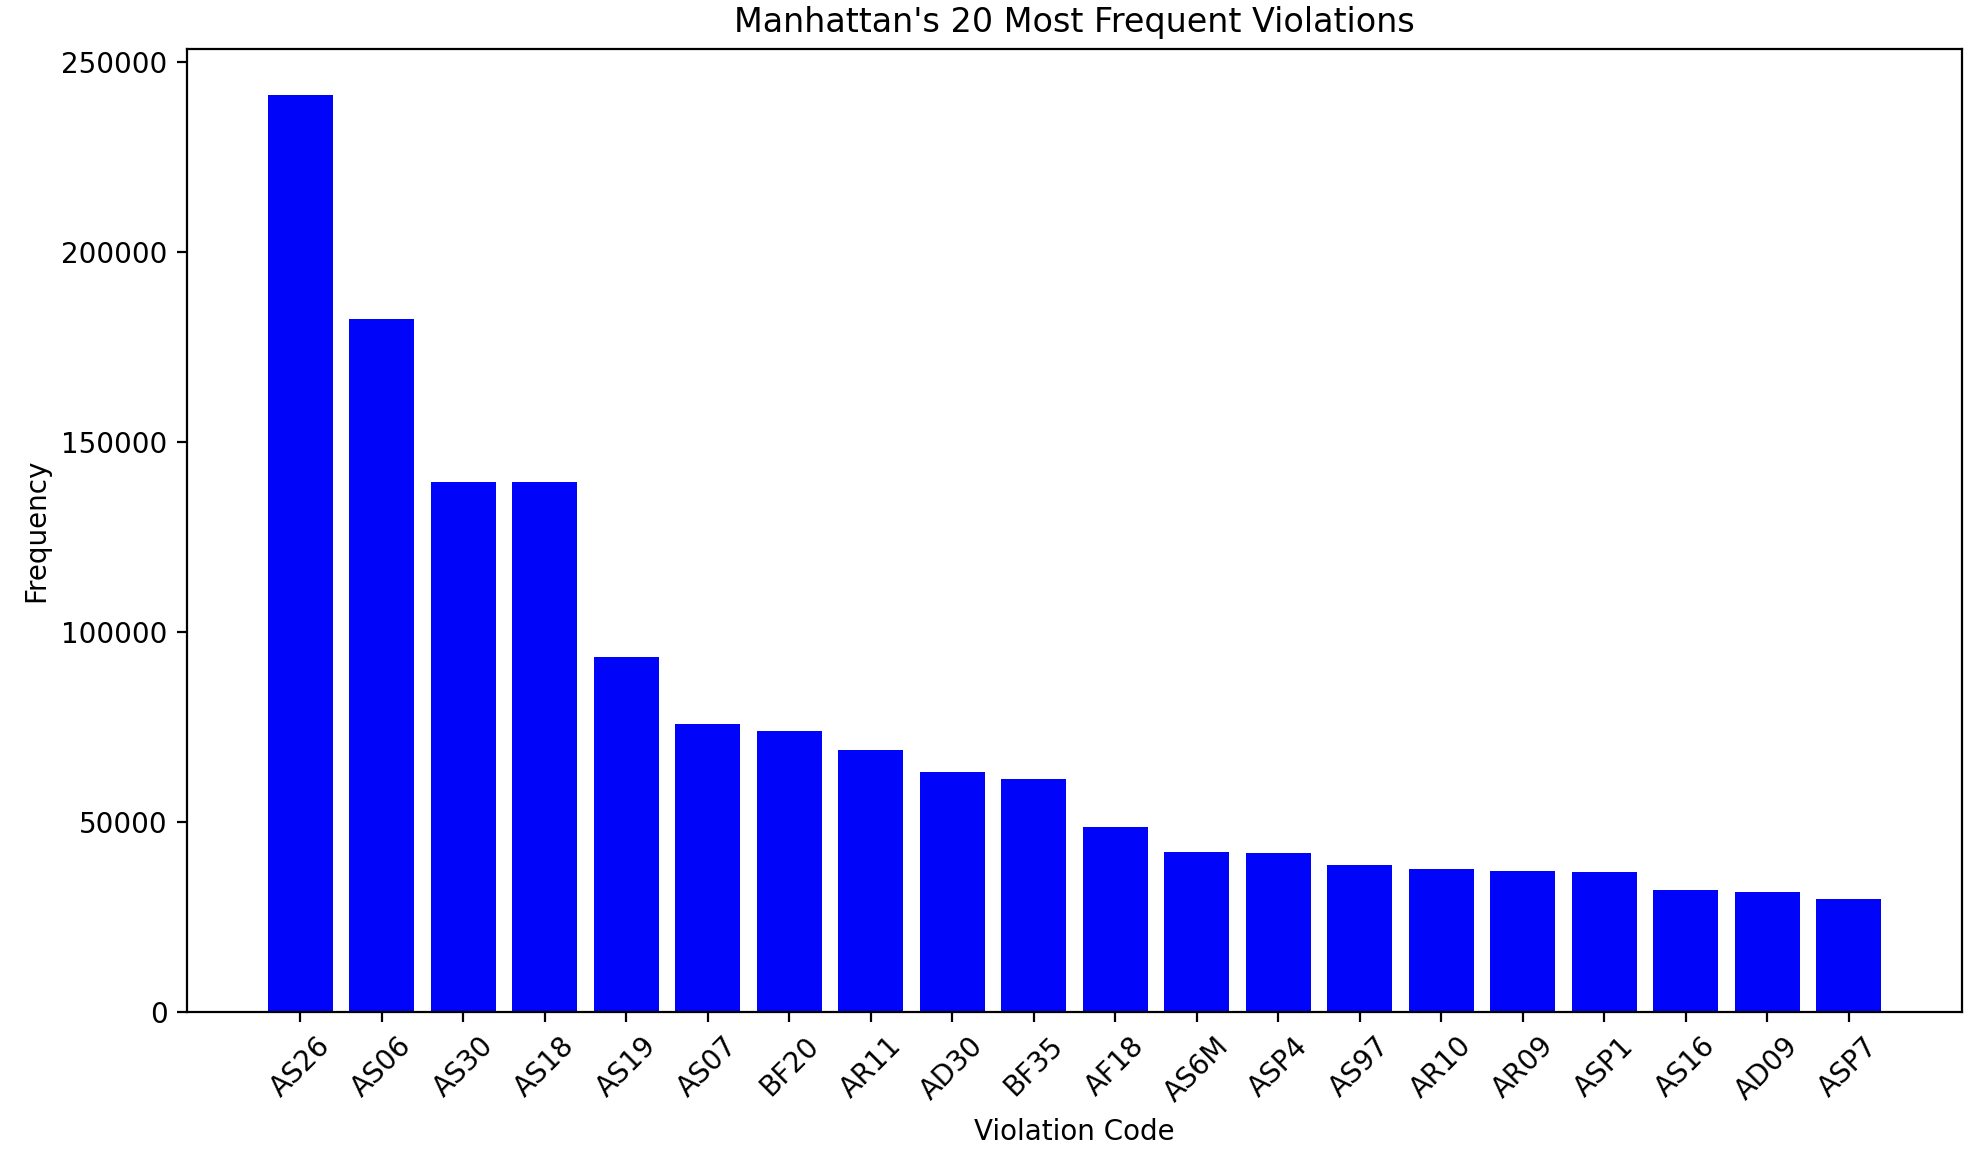
Manhattan's 20 most frequent violations (table made via FileReader.py)
-
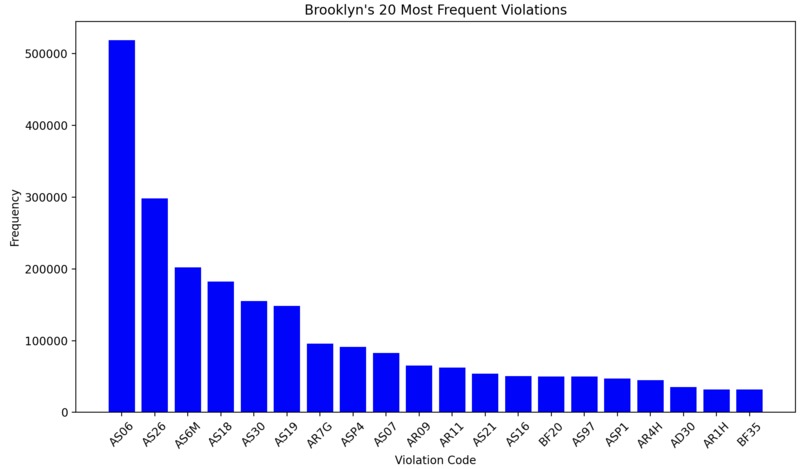
Brooklyn's 20 most frequent violations (table made via FileReader.py)
-
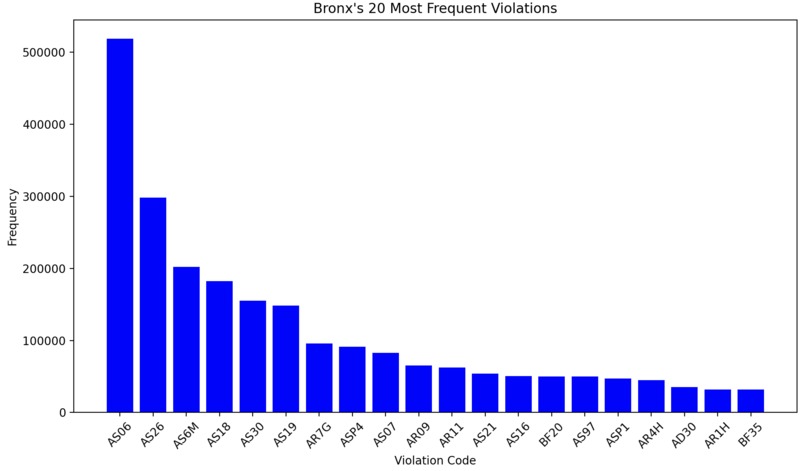
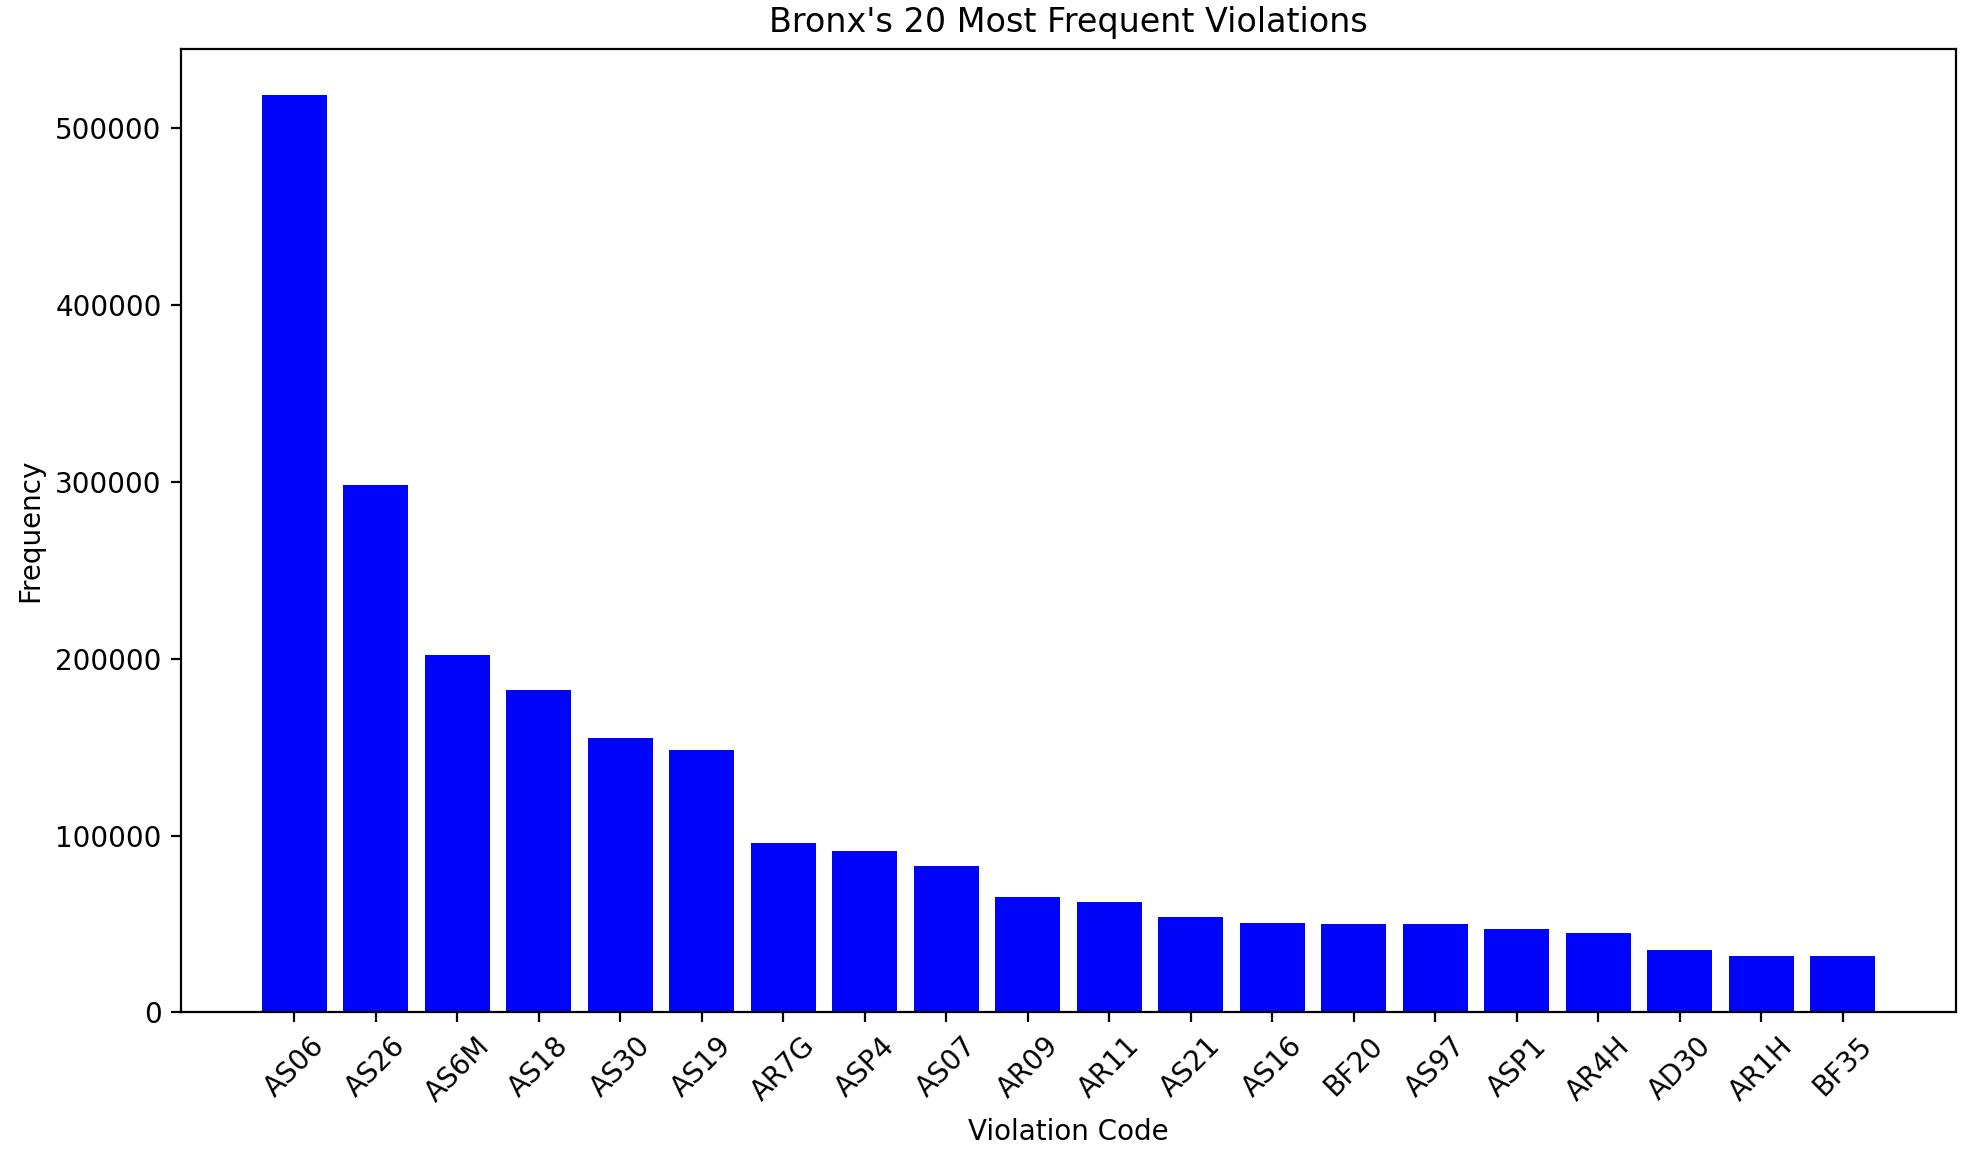
Bronx's 20 most frequent violations (table made via FileReader.py)
-
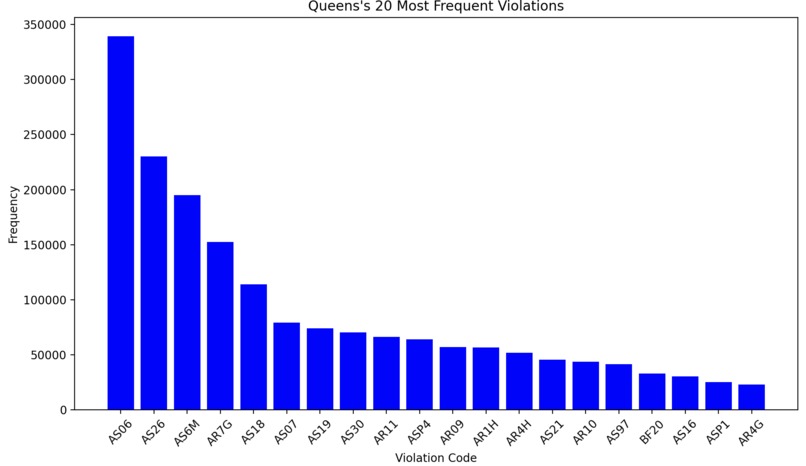
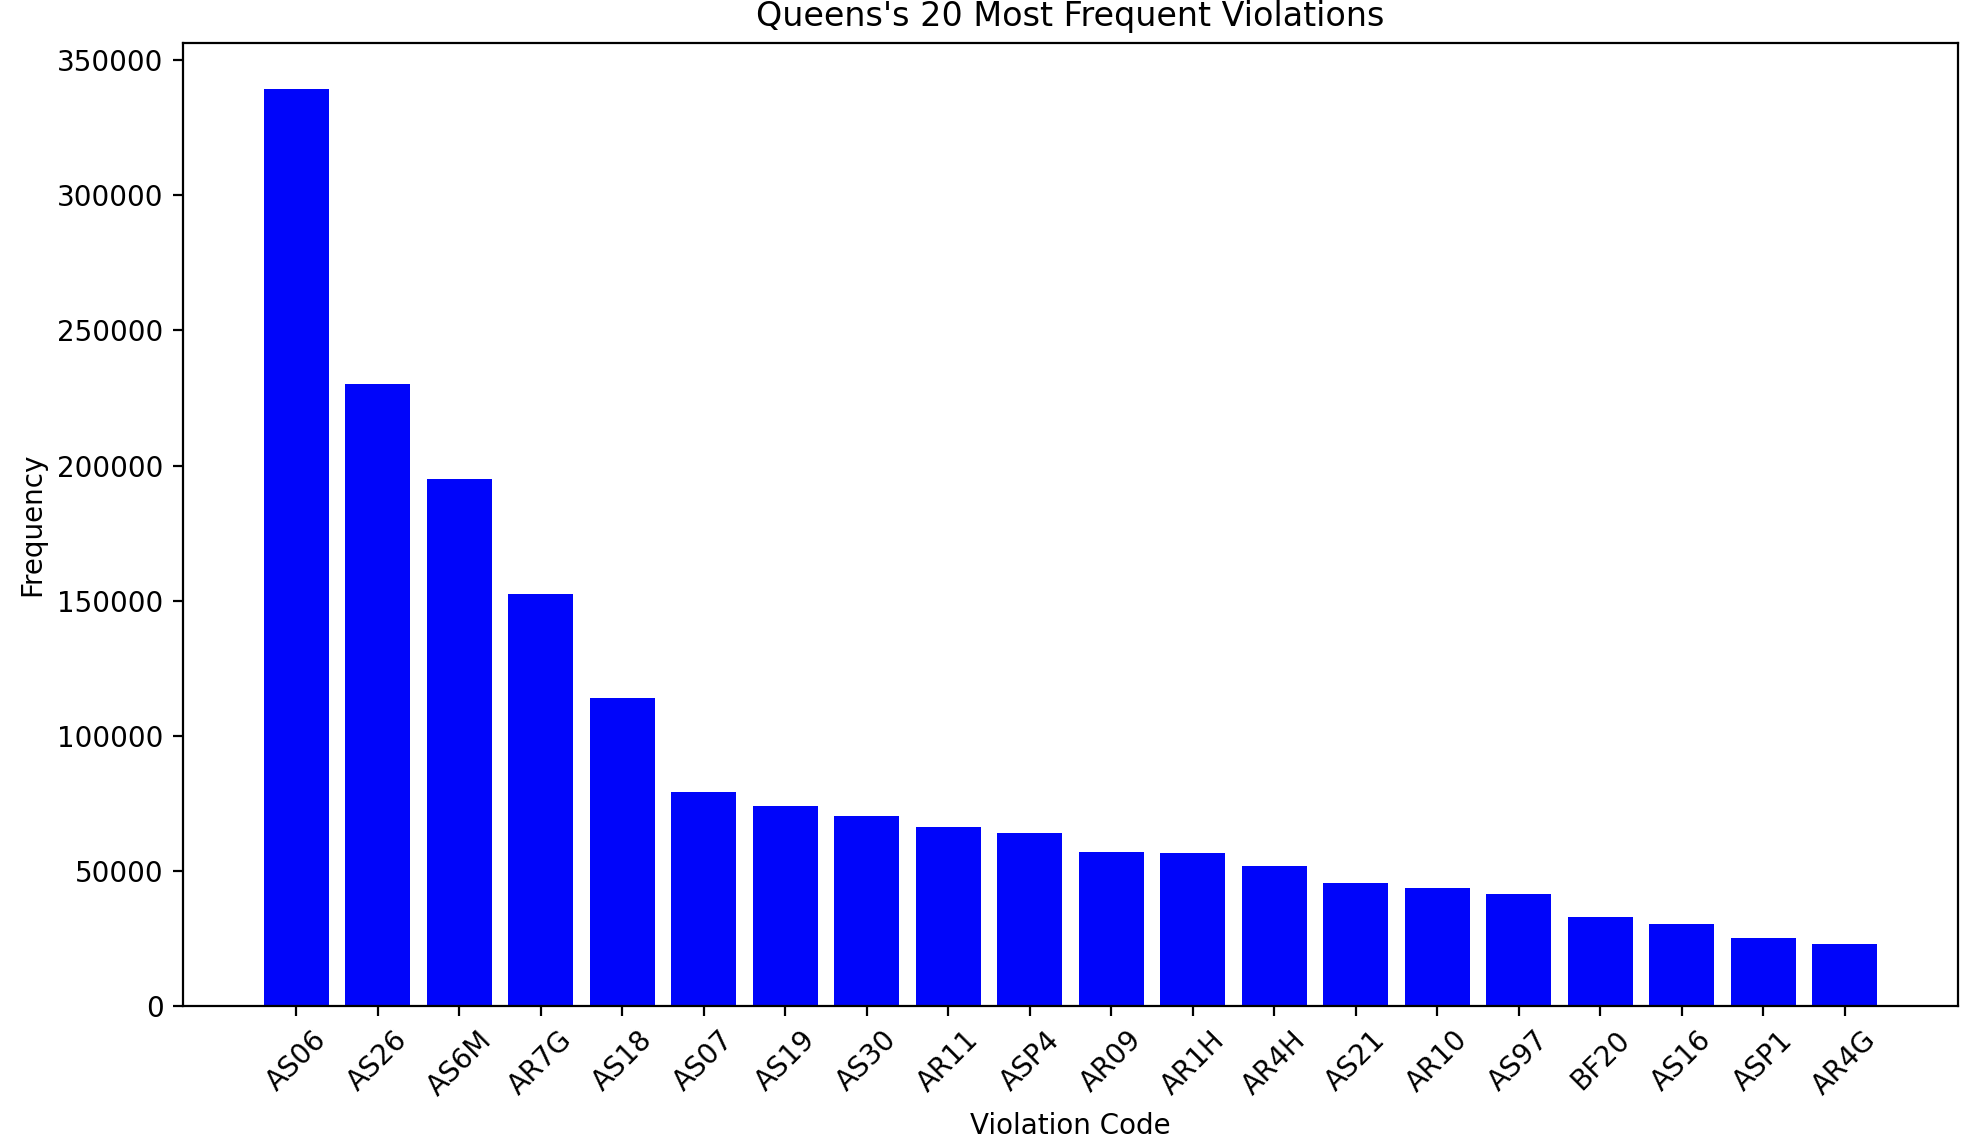
Queens' 20 most frequent violations (table made via FileReader.py)
-
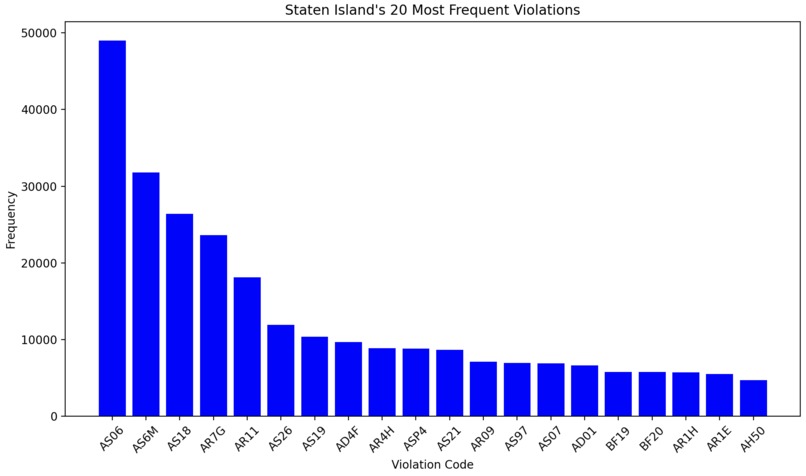
Staten Island's 20 most frequent violations (table made via FileReader.py)


Inspiration
We had the desire to help local NYC businesses avoid unnecessary fares by distilling the most common violation per burrow.
What it does
Parses NYC OATH csv files (downloaded locally on my computer) and creates a new csv file of the necessary data to read. From this point another python function analyzes this csv created file to display bar graphs of every borough's 20 most frequent violations.
How we built it
Python and matplotlib library
Challenges we ran into
Data analysis, analyzing all 20 million cases at once
Accomplishments that we're proud of
File creation/ writing and matplotlib graph displaying.
What we learned
time management, csv files, matplotlib utilization, api utilization (apparent in our outdated python file)
What's next for DataParser
A presentation can be made from this information compiling to small businesses urging them to clean the front of their stores, as that was the most frequent issue.

Log in or sign up for Devpost to join the conversation.