-
-
Slack
-
Dashboard
-
Story
Inspiration
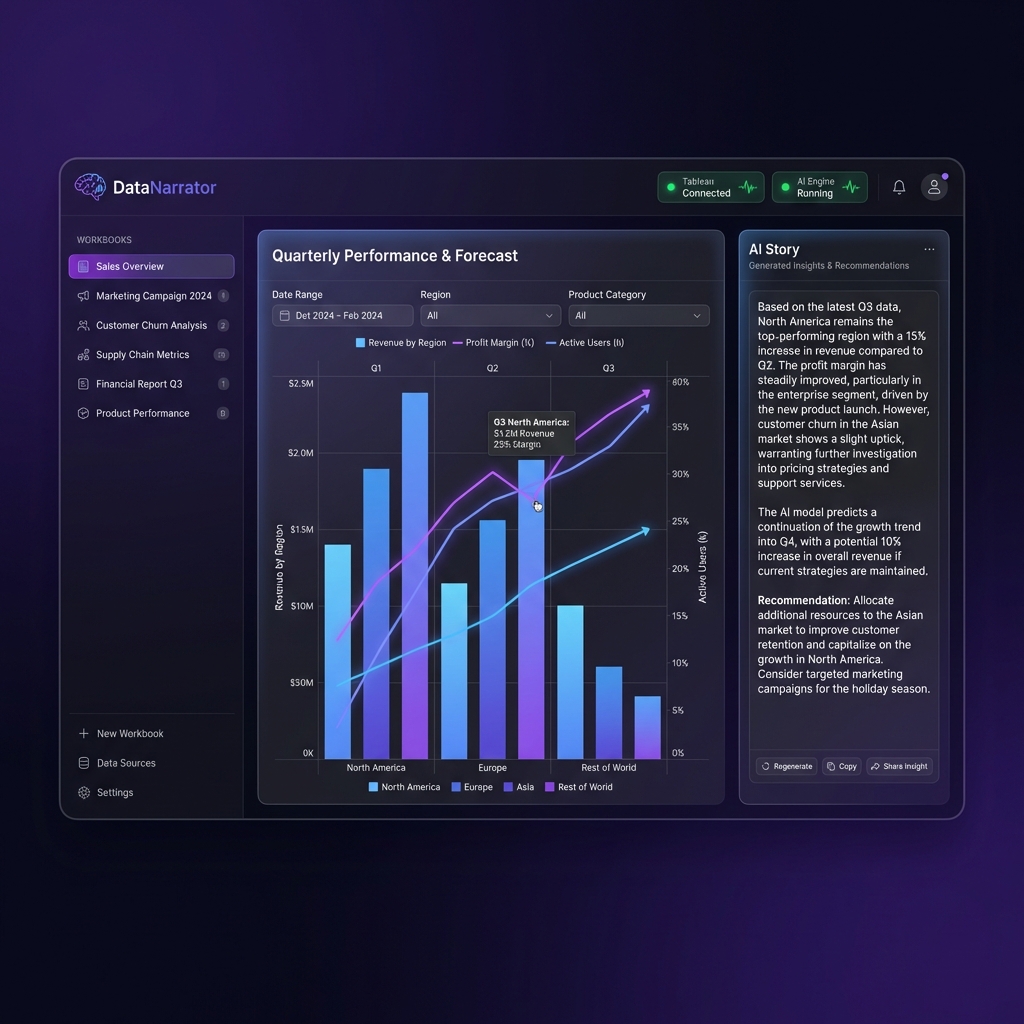
Working with Tableau dashboards, we noticed a recurring challenge: data visualization is powerful, but not everyone can interpret charts quickly. Executives need summaries, not spreadsheets. Teams need insights shared in Slack, not buried in tabs.
We asked: What if AI could look at your Tableau dashboard and tell you the story behind the data?
That's how DataNarrator was born — an AI-powered companion that transforms Tableau visualizations into compelling narratives.
What it does
DataNarrator connects to your Tableau Cloud site and:
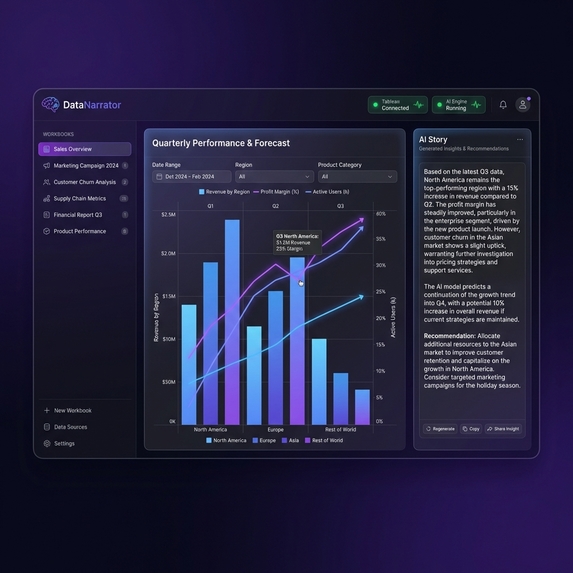
- 📊 Fetches your dashboards via the Tableau REST API
- 🤖 Analyzes underlying data using local AI (Ollama/Llama)
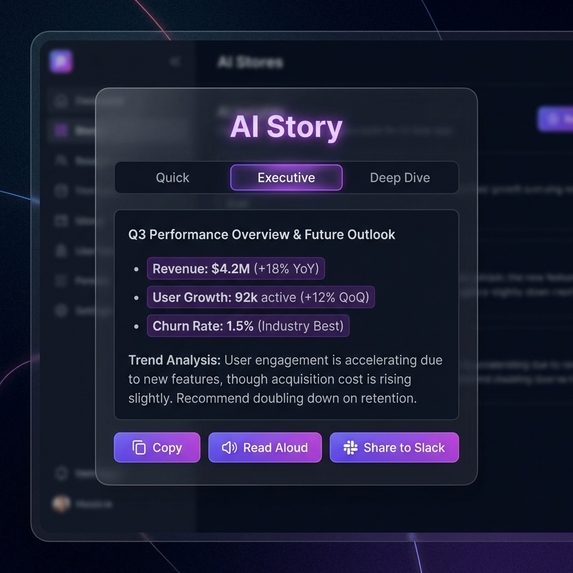
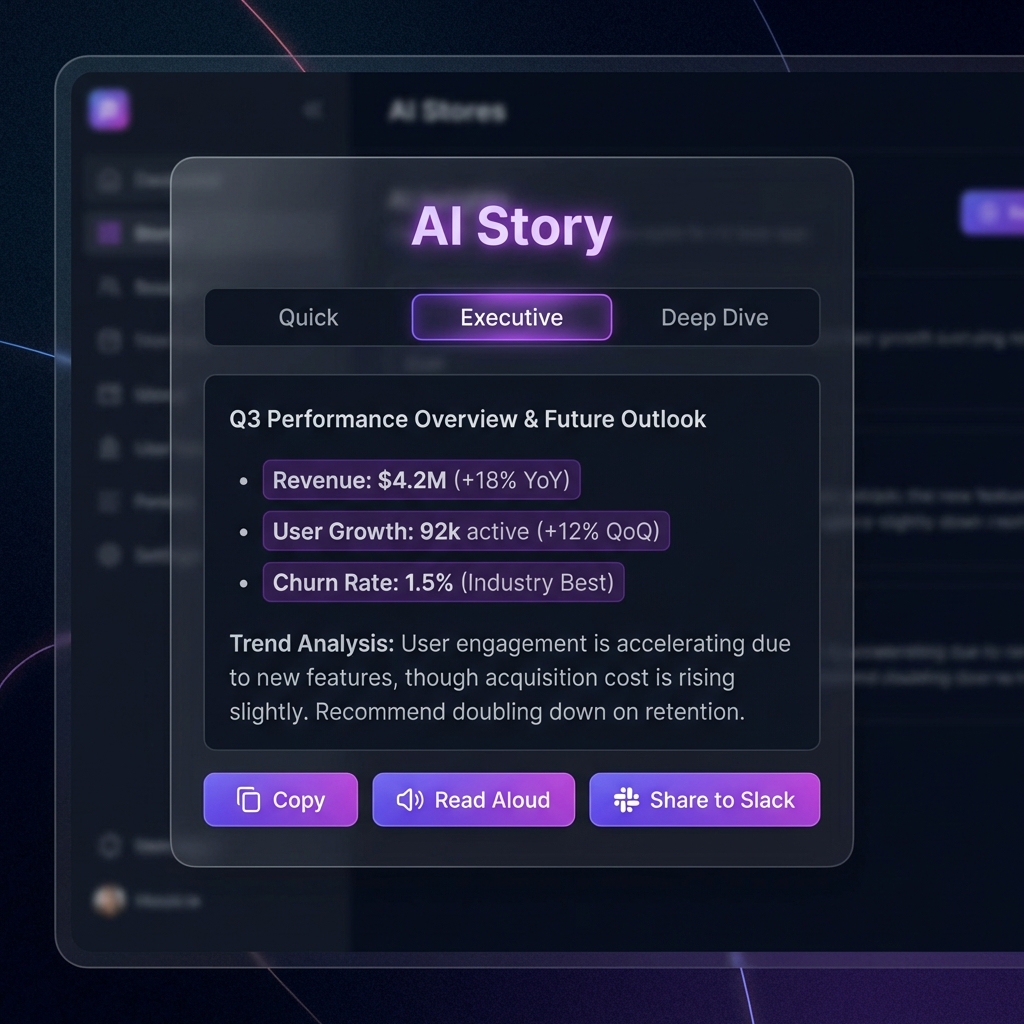
- 📝 Generates data stories in multiple formats:
- Quick Summary (2-3 sentences)
- Executive Brief (metrics + trends + recommendations)
- Deep Dive (comprehensive analysis)
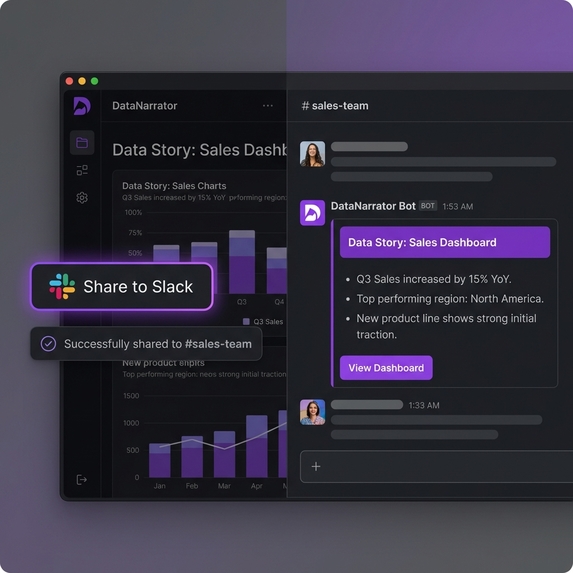
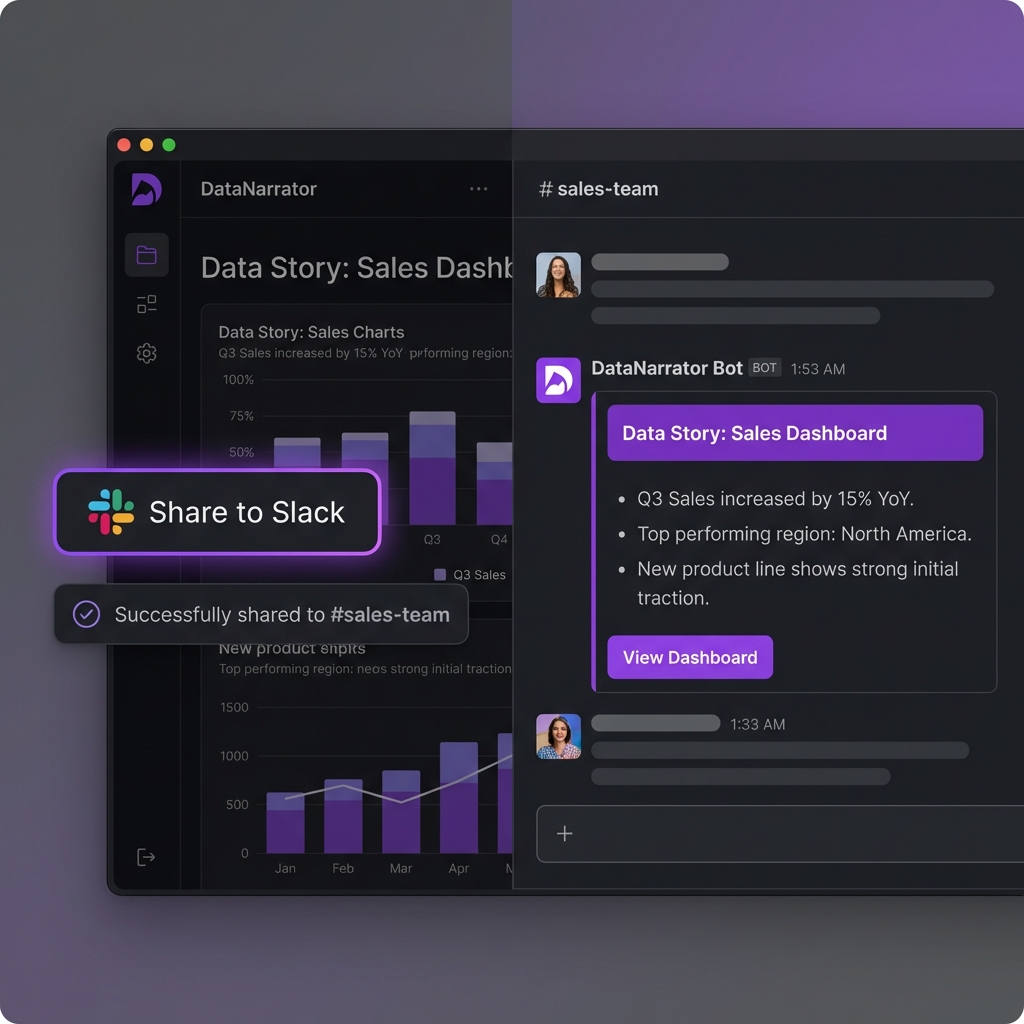
- 💬 Shares to Slack with one click
- 🔊 Reads stories aloud using text-to-speech
How we built it
Backend:
- Node.js + Express server
- Tableau REST API for authentication & data extraction
- Ollama (local LLM) for AI story generation
- Slack Web API for sharing
Frontend:
- React + Vite for fast development
- Tableau Embedding API v3 for interactive dashboards
- Custom dark theme with glassmorphism design
- Web Speech API for voice narration
Challenges we faced
Tableau API Authentication — Getting PAT (Personal Access Token) authentication working required careful handling of the multi-step auth flow.
Data Context for AI — Raw CSV data isn't enough. We had to build summary statistics (min, max, avg, unique values) to give the LLM meaningful context.
Prompt Engineering — Crafting prompts that produce consistent, insightful narratives took multiple iterations.
What we learned
- The Tableau Developer Platform is incredibly powerful and extensible
- Local LLMs (via Ollama) are now good enough for production use cases
- The best analytics tools don't just show data — they tell stories
What's next for DataNarrator
- 📅 Scheduled story generation (daily/weekly reports)
- 📧 Email delivery of stories
- 🎨 Custom story templates
- 🔗 Integration with more BI tools (Power BI, Looker)
Built With
- css3
- express.js
- javascript
- llama-3.2
- node.js
- ollama
- react
- slack-api
- tableau-embedding-api
- tableau-rest-api
- vite
- web-speech-api


Log in or sign up for Devpost to join the conversation.