

Inspiration
as a full stack engineer and my previous project to build dashboard app, I need a lot of time to finding the right visualization (various types of chart,diagram,map) for my API response data and transform the external data that required to visualize it.
What it does
help developer to transform and visualize test their api response data through Postman before implement it in their project code.
a. DataTransform (Postman Collection) :
help developer to transform the data
- TransformMap
adding new key-value in data row
- TransformFiltering
return filtered data based on specific value
- TransformPickField
return specific field in data. e.g return type field
- TransformRename
rename field or key in data. e.g rename 'type' field to 'department.
- TransformReverseOrder
reverse data order, from index 0...n to n...0.
- TransformSortByCallback
sort data by callback function. e.g sort by minimum value function
- TransformSortByField
sort data by field. e.g sort data based on 'type' field.
- TransformFoldField
fold field data. e.g :
data a = { "month": "Jan", "Tokyo": 7, "London": 3.9 }
when we use transform open fold, the data will be :
data a1 = { "month": "Jan", "city": "Tokyo", "temperature": 7 },
data a2 = { "month": "Jan", "city": "London", "temperature": 3.9 }
- TransformStatistics
return statistic calculation from data. Supported operations: count,Max,min,mean,median,mode,product,standardDeviation,sum,sumSimple, variance
b. DataVisual (Postman Collection) :
help developer to get visual boilerplate code and implement it in their project.
- VisualArea (5 visuals)
- VisualBar (6 visuals)
- VisualColumn (8 visuals)
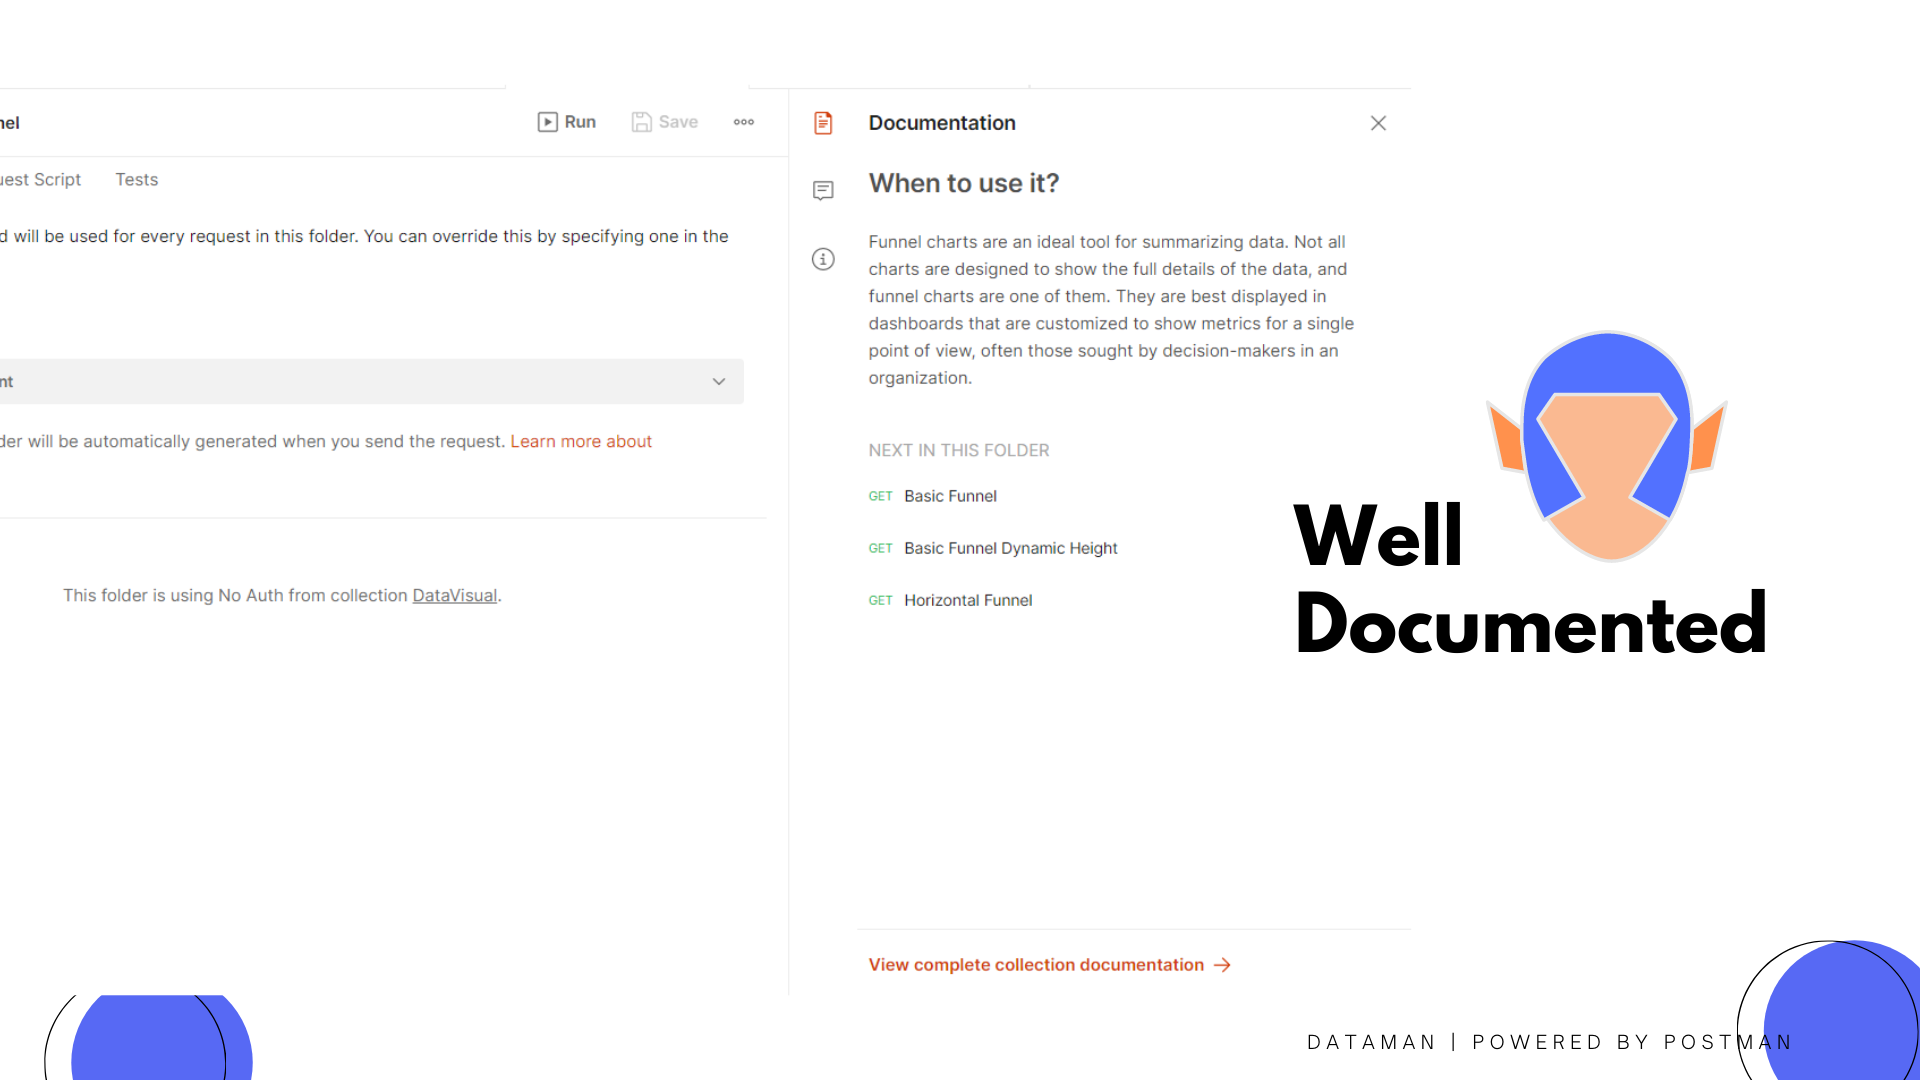
- VisualFunnel (3 visuals)
- VisualLine (8 visuals)
- VisualPie (4 visuals)
- VisualRadar (3 visuals)
- VisualRing (1 visuals)
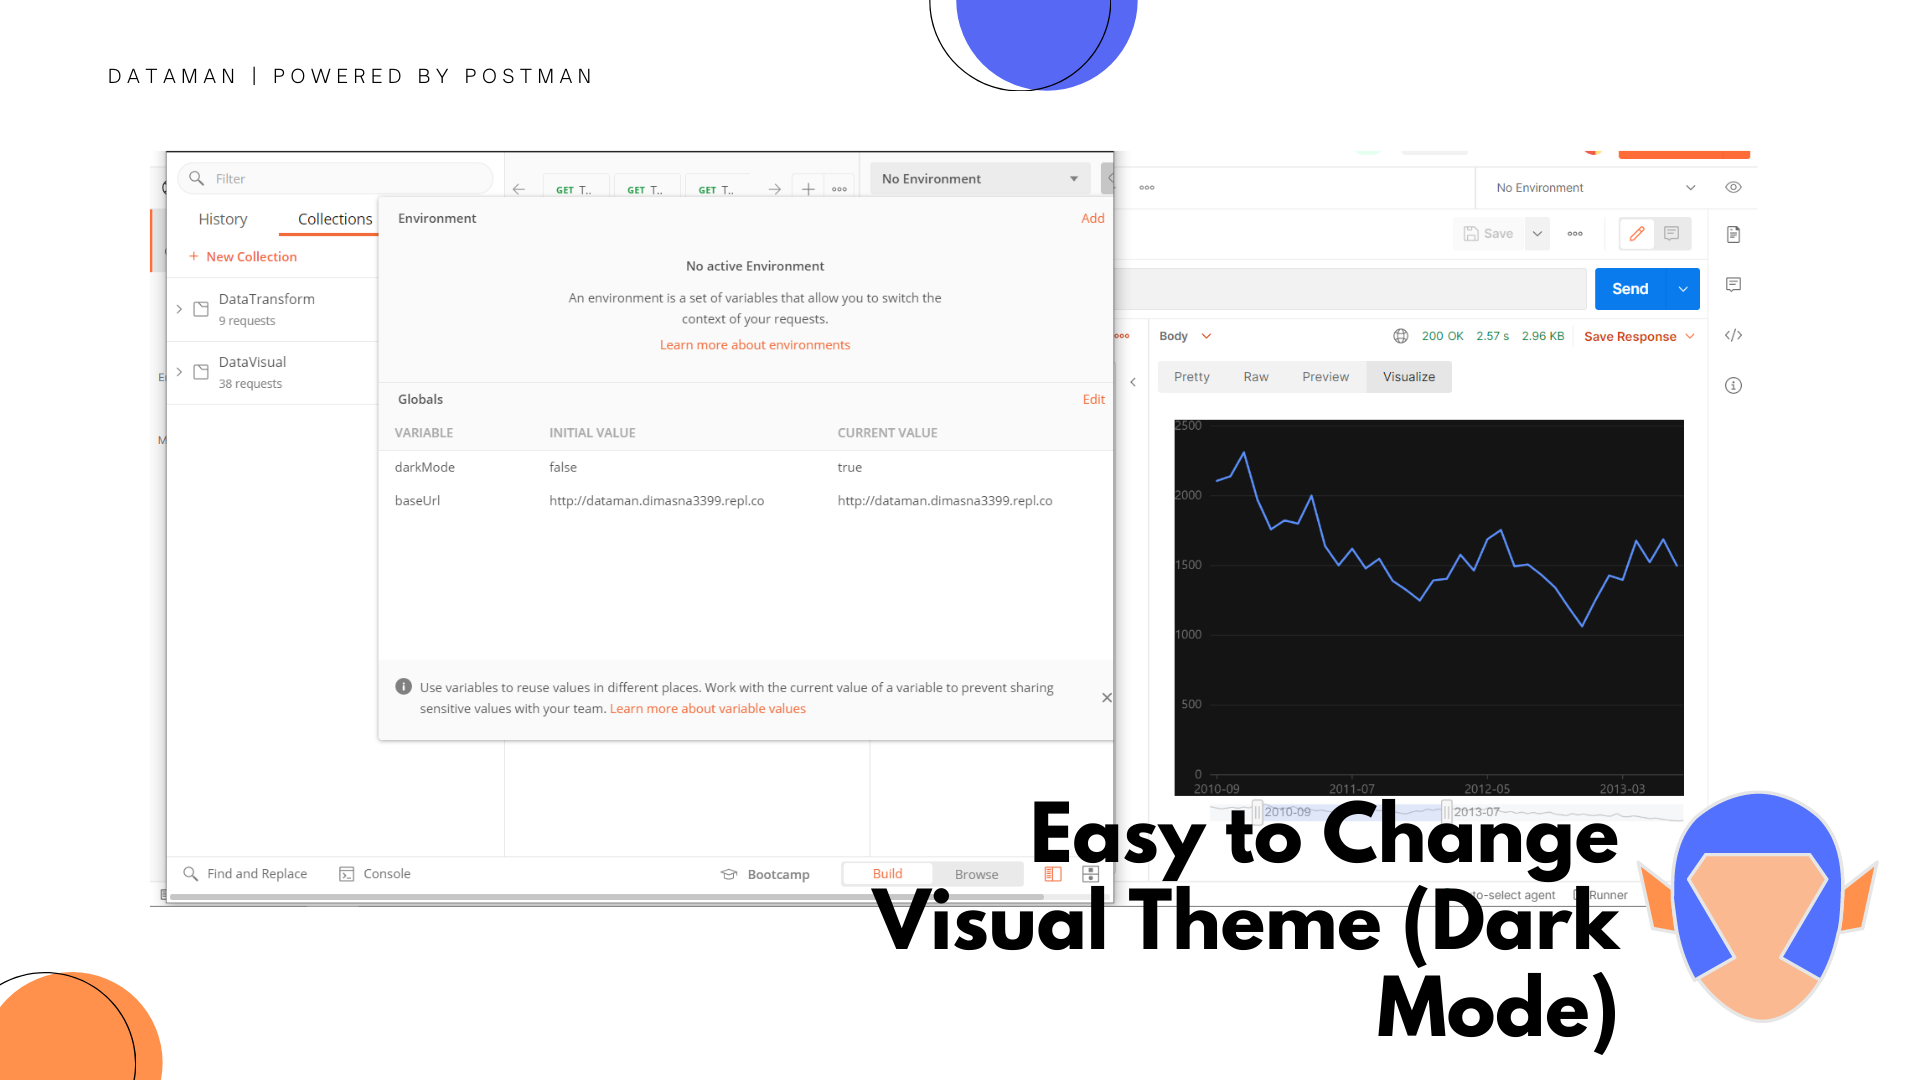
c. change the visuals theme to darkmode with set darkMode global variable to true
How we built it
I use postman platform feature's like test script, global variable, visualize and collection. and in the test script I use g2plot, antv-data-set, react and codemirror libraries. For backend I'm use nodejs to serve the api request for testing
Challenges we ran into
hackathon time limit make me hard to decide what is the importance one to act.
Accomplishments that we're proud of
get more knowledge of postman and its possibilites, and finished this hackathon on time.
What we learned
the Postman capabilities like monitor, mock server, api documentation and so on.
What's next for DataMan - Transform Your API Response Data and Visualize It!
- more visual (chartjs, d3)
- more framework (Vue, Angular)
Built With
- antv-data-set
- codemirror
- g2plot
- javascript
- node.js
- postman
- react

Log in or sign up for Devpost to join the conversation.