-
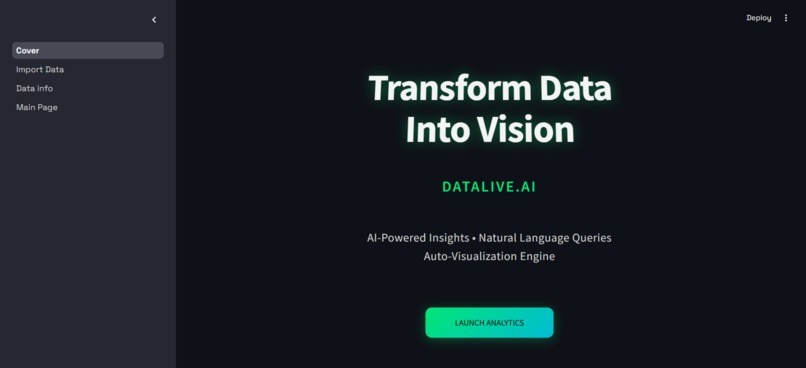
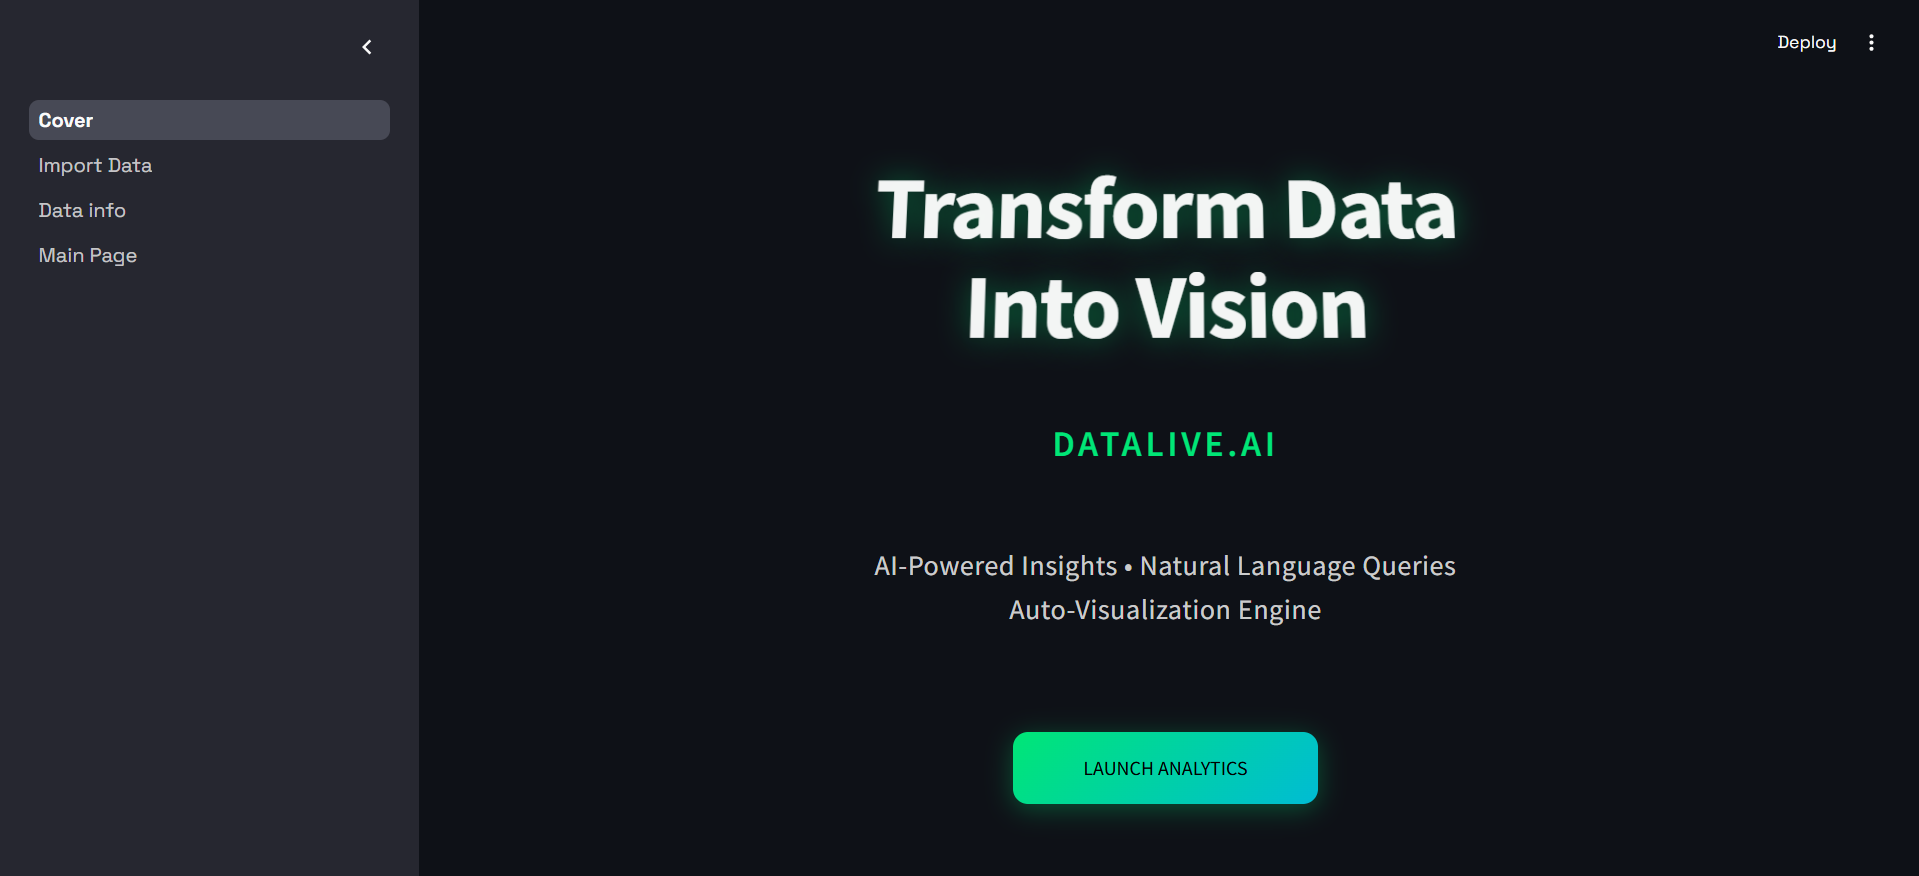
HomePage
-
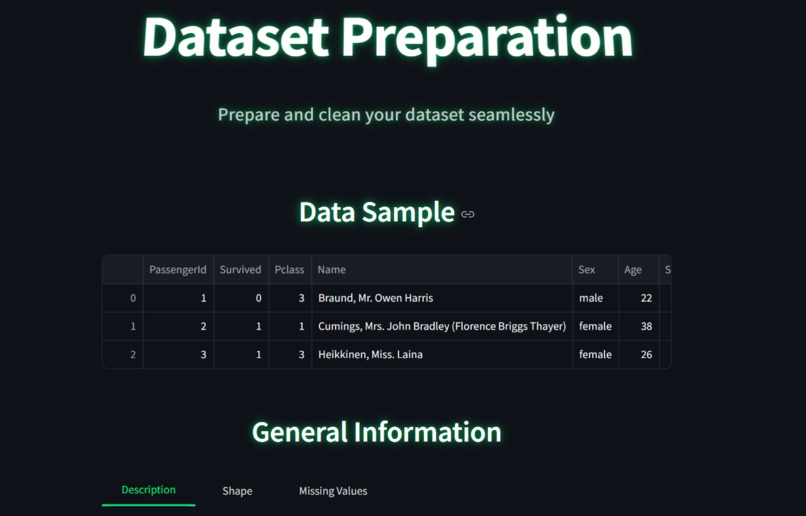
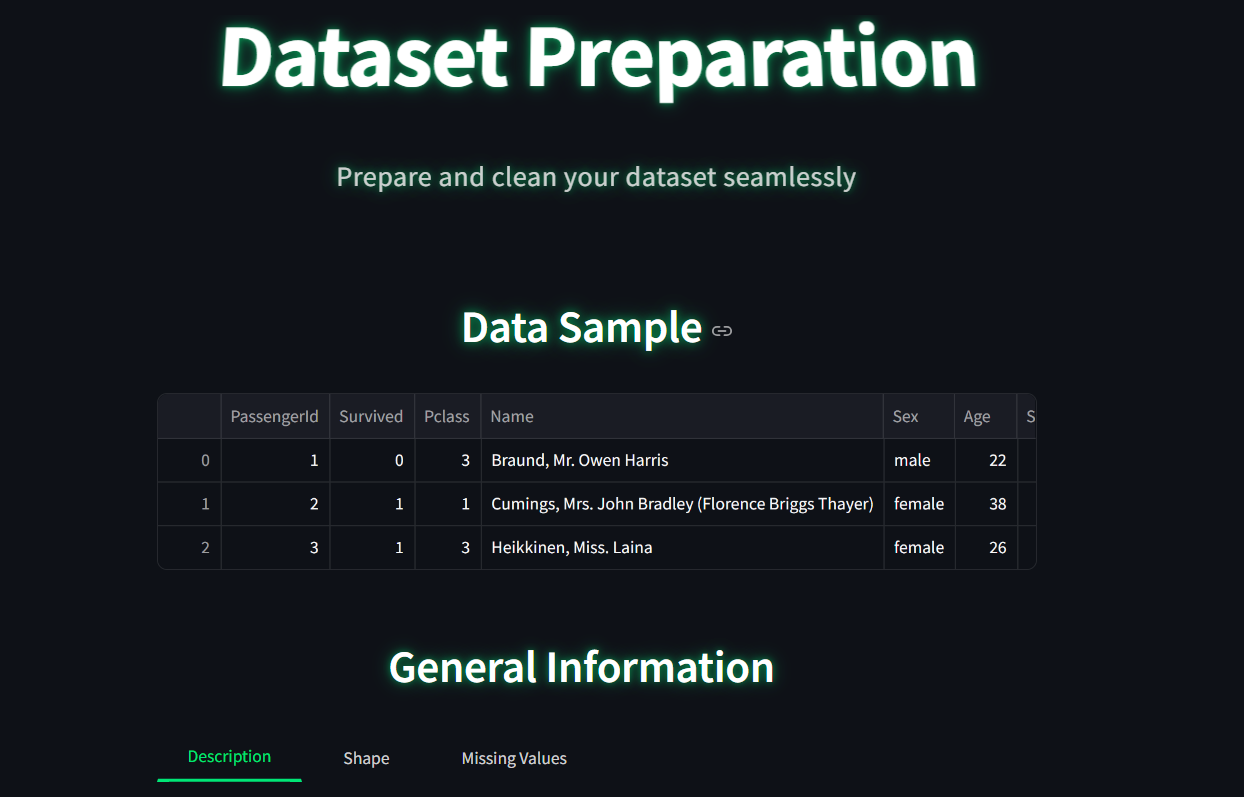
importing dataset
-
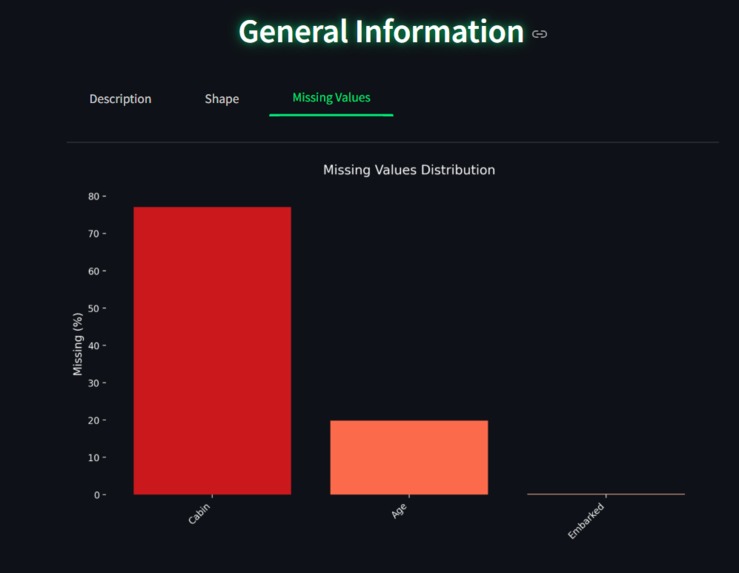
visualisation of data
-
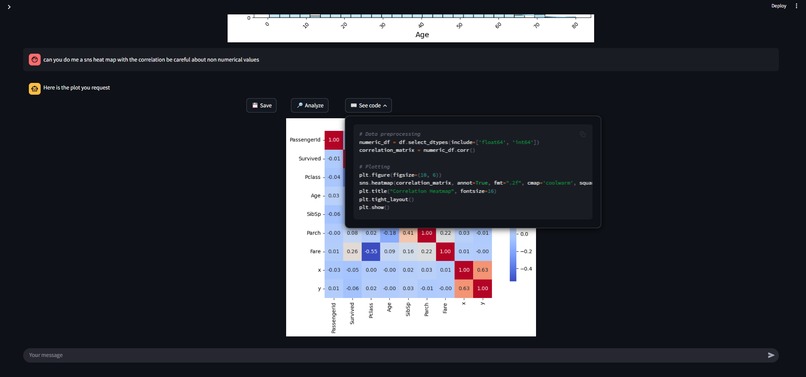
View code source of the generated plot


DataLive.ai 🧠📊
🏆 1st Place Winner – LauzHack Mini Hackathon (GenAI Track) Organized by LauzHack and the EPFL AI Team
Inspiration
We’ve all dealt with messy datasets and repetitive code just to answer simple questions. We wanted a tool that would let anyone explore data just by asking — without writing code or digging through documentation. That’s how DataLive started.
Overview
DataLive.ai is a next-generation AI assistant for data exploration and visualization. It combines automated preprocessing, intelligent code generation, and multimodal reasoning — all through a sleek and interactive Streamlit app.
Upload a .csv file, clean your data, ask natural language questions, generate plots, and even receive AI-driven insights from those plots. All computation is performed locally, keeping your data private while maximizing speed.
This project was built in under 24 hours during the LauzHack Mini Hackathon 2025, where it won 1st place in the Generative AI Track.
Why It's Different from ChatGPT
Unlike general-purpose tools like ChatGPT or Code Interpreter:
Your data is never uploaded to the LLM → We extract only essential metadata (e.g., column names, types, number of missing values) and send that to the model. This:
- Preserves data privacy
- Avoids token overload on large datasets
- Ensures compatibility with sensitive or proprietary files
All code is executed locally → No need to copy/paste code; the app renders output instantly in the interface.
Lightning-fast interactions thanks to Streamlit → Near-instant feedback loop between code generation, execution, and visualization.
Features
Automatic Data Profiling
- Data shape, summary statistics
- Missing values report
- Column data types and inferred structure
Smart Data Cleaning
Choose from:
- Drop rows with missing values
- Fill with column-wise mean
- KNN Imputation
Conversational Code Generation
Powered by OpenAI GPT-4o
Ask natural questions like:
"Show a pairplot of numerical features" "Plot the class distribution as a bar chart"
Returns executable Python code, auto-rendered as:
- Seaborn heatmaps
- Histograms
- Boxplots
- And more...
Multimodal Plot Analysis
- After generating a plot, ask:
"What can you conclude from this?"
The image is sent to Video-LLaMA2B via a custom Hugging Face inference handler
Returns textual interpretation of trends, outliers, and insights
Export & Traceability
- Save all generated code
- Export plots for reuse or reporting
Tech Stack
- Frontend: Streamlit
- Backend: Python (OpenAI API + Hugging Face Inference Endpoint)
LLMs:
- GPT-4o (OpenAI) – Prompt-to-code generation
- Video-LLaMA2B (DAMO-NLP-SG) – Plot interpretation
Libraries: pandas, NumPy, Scikit-learn, Seaborn, Matplotlib
Execution: Local sandboxed Python runtime (safe, fast, private)
How It Works
- Upload your
.csvdataset - Receive an automatic summary of key stats
- Select a data cleaning strategy
- Ask a question or request a visualization
- Get back both:
- The generated code
- The rendered output
- (Optional) Ask for AI-based interpretation of the plot
Getting Started
Launch Locally
streamlit run app.py
Environment Setup
You'll need:
OPENAI_API_KEYHUGGINGFACE_TOKEN(for the Video-LLaMA endpoint)
Future Work
Here are some exciting features planned for the next iteration:
SQL Data Integration → Connect to relational databases (PostgreSQL, MySQL) and run natural language queries directly on live data.
NoSQL Support (MongoDB, Firebase, etc.) → Enable compatibility with document-based datasets.
Advanced Insight Generation → Incorporate models to automatically detect:
- Trends
- Seasonality
- Anomalies
- Correlations and causal patterns
Explainable AI Layer → Provide rationale behind detected trends or statistical recommendations.
Team
Built by Amar Youcef, Vifian Ylan and Vifian Arno during the LauzHack x EPFL AI Team Hackathon 2025.
Built With
- huggingface
- llama
- openai
- python
- streamlit


Log in or sign up for Devpost to join the conversation.