-
-
Business Brief
-
-
Inspiration
Most BI tools start from the same assumption: the data has already been cleaned, the metrics have been agreed, the model has been built, and someone has created the dashboard.
That is often not true, especially in smaller organisations. They may have useful workforce data sitting in spreadsheets, but no analytics team and no time to turn raw records into something a manager can act on.
I built DataLink around a simple idea: a manager should be able to upload the data they already have and get the kind of structured interpretation they would normally need an experienced analyst to produce.
What it does
DataLink Logic Engine takes a workforce CSV and turns it into:
- validated evidence,
- clearly defined workforce metrics,
- data-quality findings,
- an auditable logic trace,
- and a management-ready Business Brief generated with GPT-5.6.
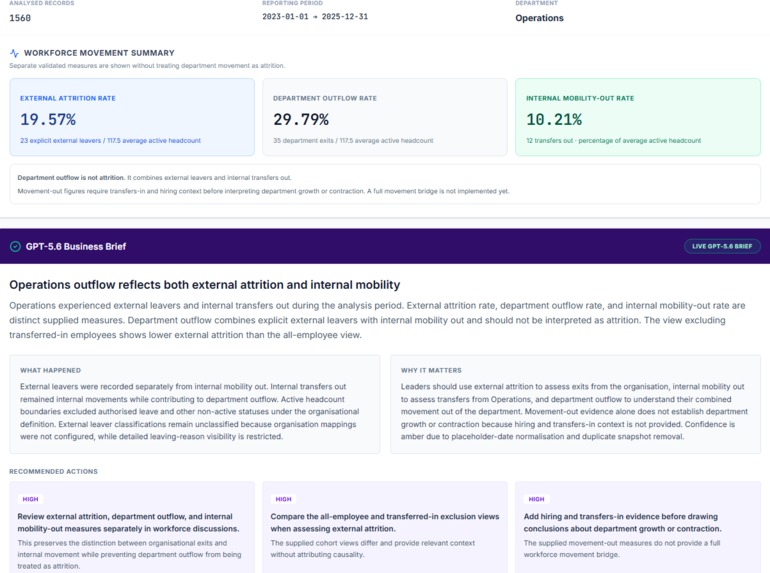
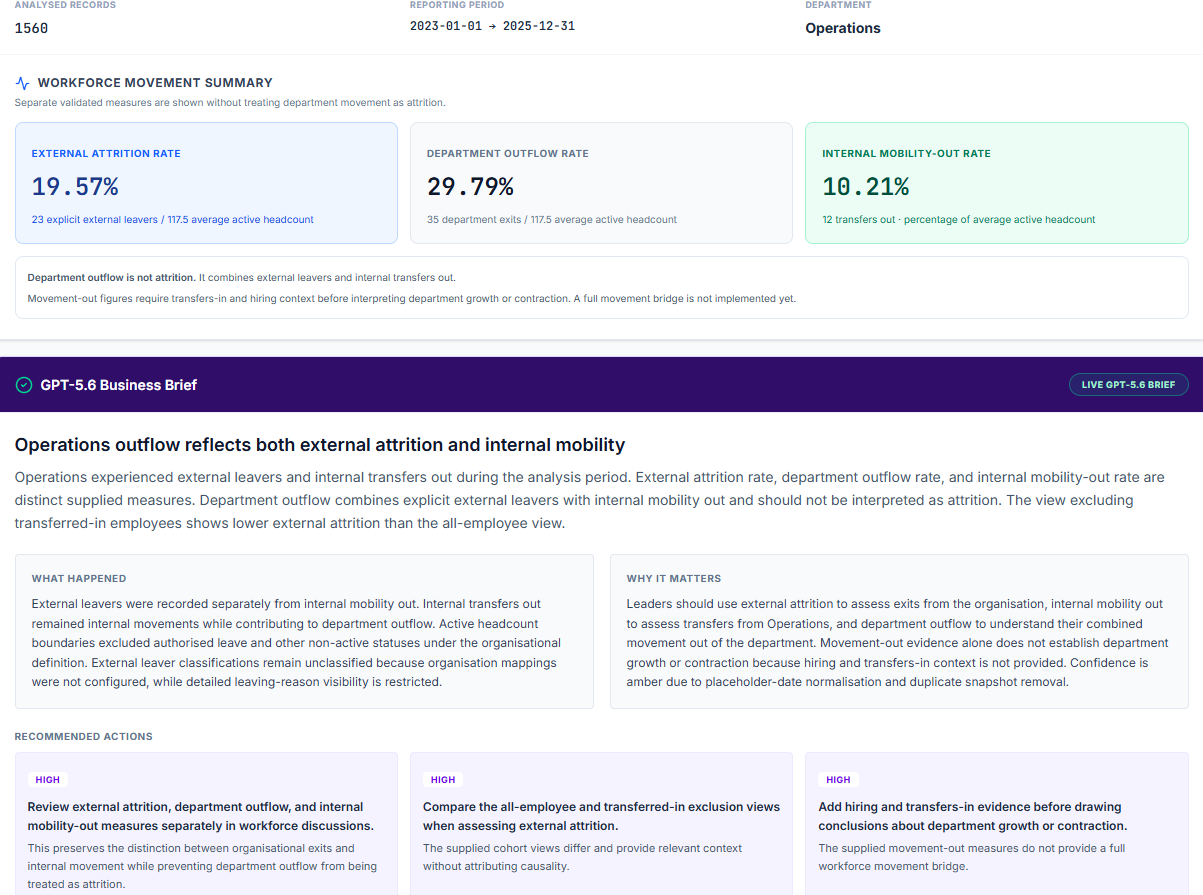
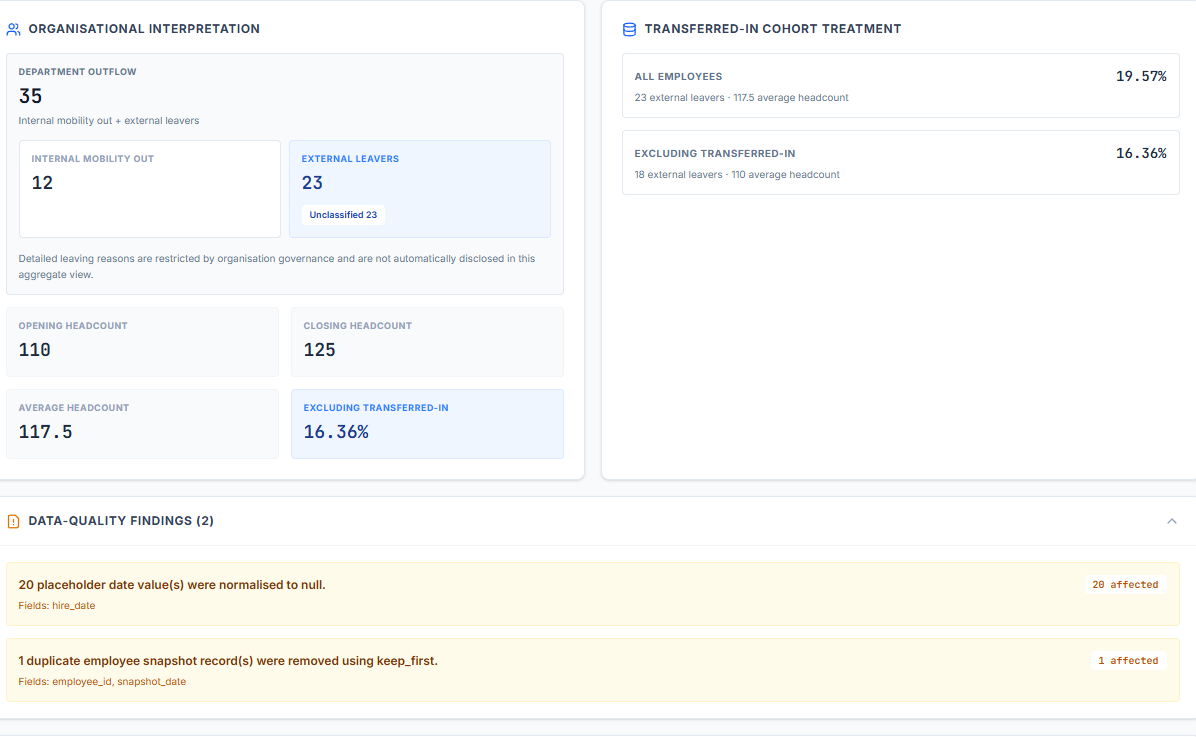
The current demo separates three measures that are often confused:
- external attrition,
- internal mobility out,
- total department outflow.
That distinction matters. Someone who transfers to another department has left the team, but not the organisation. DataLink keeps those movements separate instead of counting every department exit as attrition.
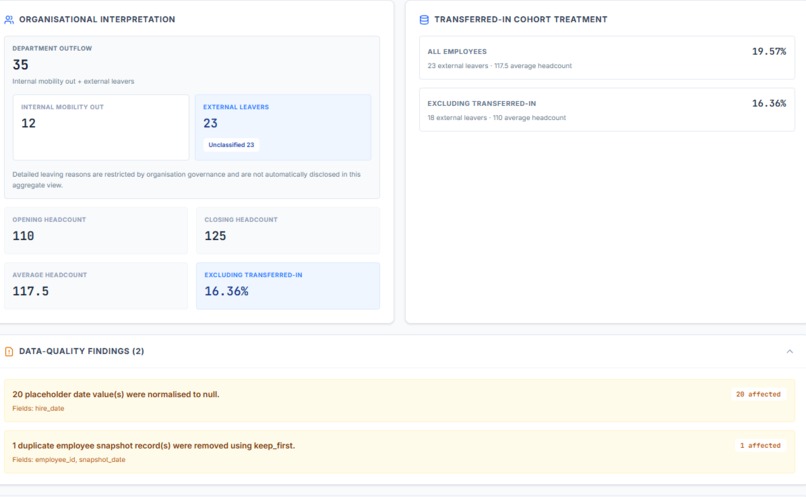
It also flags problems such as placeholder dates and duplicate employee snapshots, lowers confidence when the data requires caution, and shows which assumptions still need confirmation from the organisation.
Why it is different
DataLink is not another dashboard, and it is not just “chat with a CSV.”
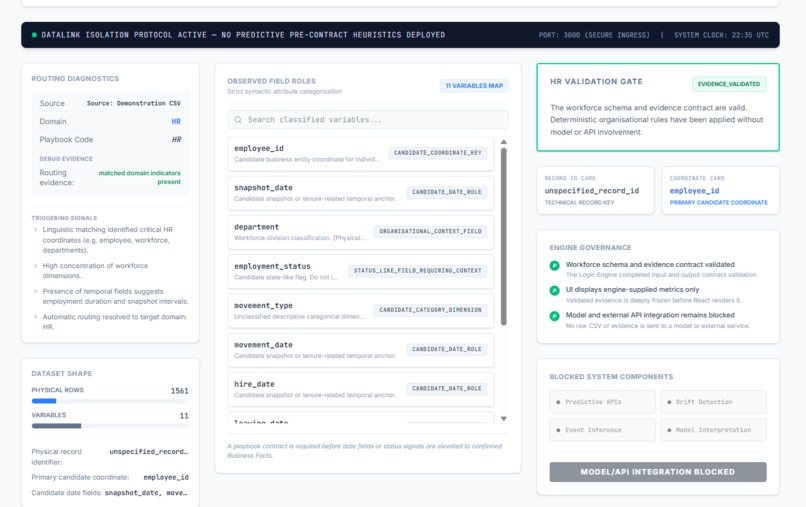
The calculations are handled by a deterministic logic engine. GPT-5.6 does not calculate the metrics and cannot change them. It receives a restricted, identifier-free evidence package and turns the validated findings into a concise Business Brief.
That separation is important:
- The logic engine decides what the data supports
- GPT-5.6 explains why it matters
The model cannot replace calculated values, introduce unsupported evidence, or quietly change the organisation’s definitions.
How I built it
The application uses TypeScript, React, Vite, Node.js serverless functions, the OpenAI Responses API, and Vercel.
The flow is:
- Load a workforce CSV
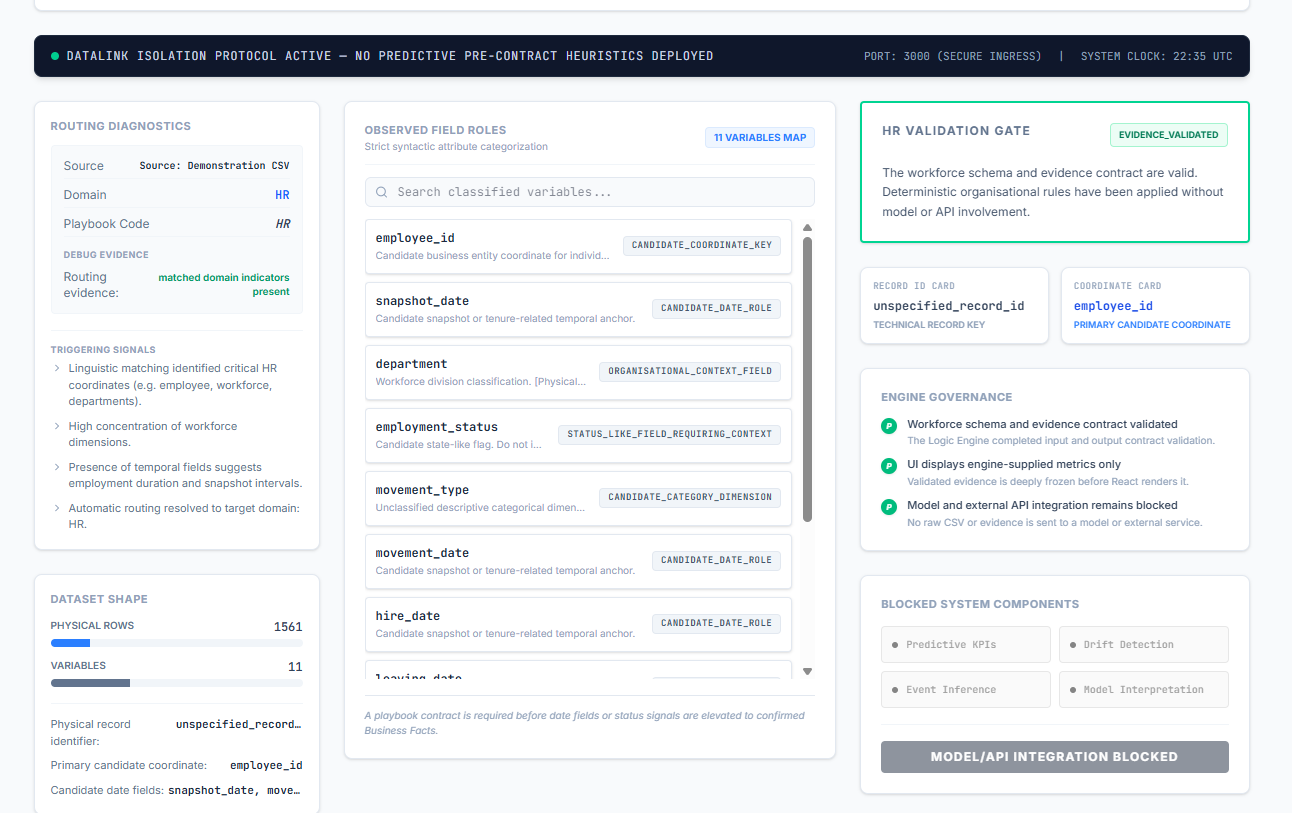
- Validate the schema and identify data-quality issues
- Apply explicit workforce rules
- Calculate the metrics deterministically
- Freeze the evidence object
- Generate a SHA-256 fingerprint
- Send only aggregate, identifier-free evidence to GPT-5.6
- Validate the returned narrative against a strict schema
- Display all numbers directly from the original evidence
The OpenAI API key stays on the server. Raw CSV data, employee identifiers, and detailed leaving reasons are not sent to the model.
The demo also has a cached Business Brief, but it is bound to the exact fingerprint of the synthetic dataset. Uploaded user data can never receive that demonstration response by mistake.
Challenges
The hardest part was not generating text. It was making sure the analysis kept the correct business meaning.
During development, I realised that department outflow, external attrition, and internal mobility were being presented too closely together. The underlying events were correct, but the labels could lead a manager to the wrong conclusion.
I redesigned the evidence model and the interface around three separate rates:
- External attrition rate
- Department outflow rate
- Internal mobility-out rate
I also added validation rules so internal transfers can never be counted as external attrition.
The second challenge was making the GPT layer useful without allowing it to alter the evidence. The solution was strict schema validation, evidence-reference allowlisting, numeric immutability, privacy-safe diagnostics, and a fail-closed fallback path.
What I learned
The biggest lesson was that analytical quality depends as much on definitions and context as it does on arithmetic.
A number can be mathematically correct and still be misleading if the label answers a different business question.
I also learned that the best role for an LLM in analytics is not unrestricted calculation. It is explanation, prioritisation, and communication built on top of controlled evidence.
What is next
The next step is a full workforce movement bridge covering:
- opening headcount,
- external hires,
- transfers in,
- transfers out,
- external leavers,
- authorised adjustments,
- closing headcount reconciliation.
External leavers will also support organisation-configured voluntary, involuntary, and unclassified categories, without automatically exposing sensitive leaving reasons.
The longer-term goal is to apply the same evidence-first approach to finance, operations, and logistics.
DataLink gives smaller organisations access to analytical capability they would normally need a dedicated analyst or BI team to obtain.
Built With
- analytics
- api
- business
- csv
- data
- gpt-5.6
- intelligence
- node.js
- openai
- react
- responses
- serverless
- sha-256
- typescript
- vercel
- vite
- workforce

Log in or sign up for Devpost to join the conversation.