-
-
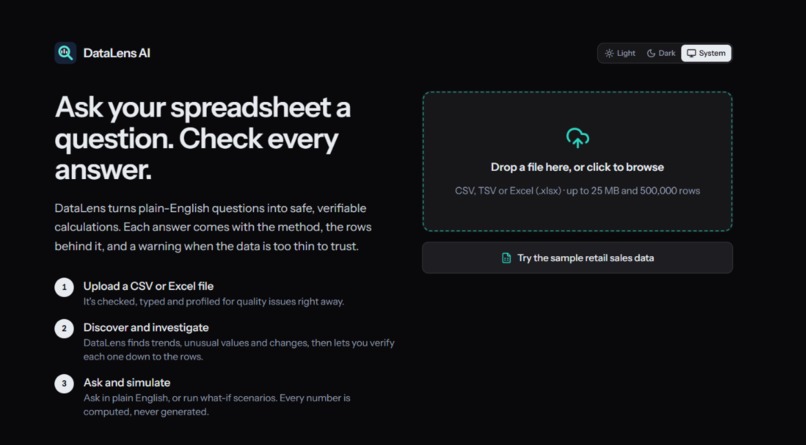
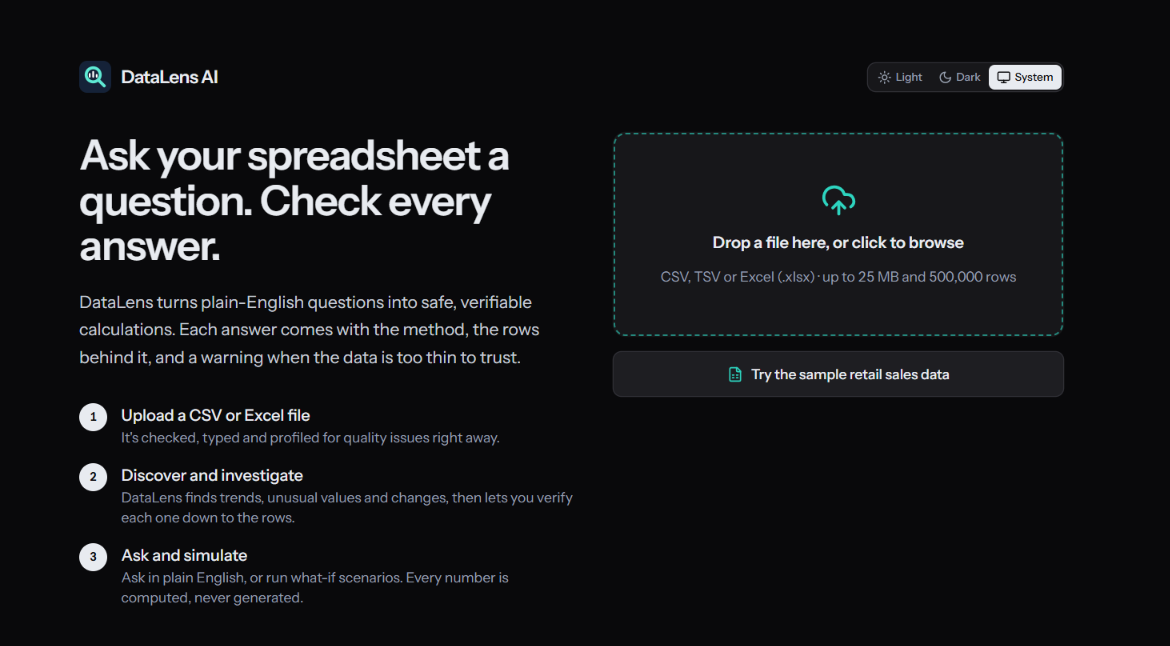
Upload your CSV or Excel files and start exploring your data with DataLens AI.
-
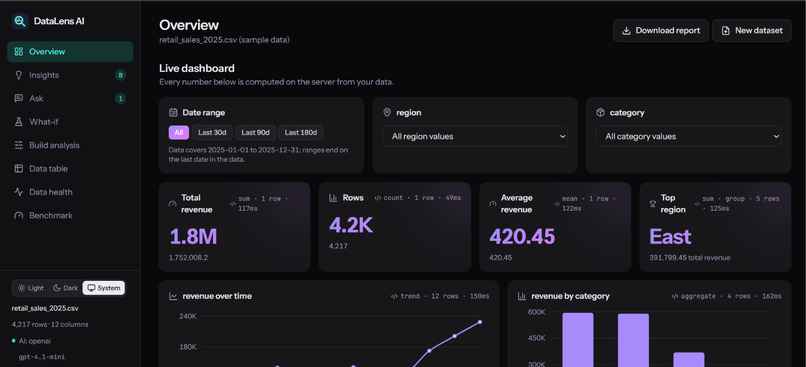
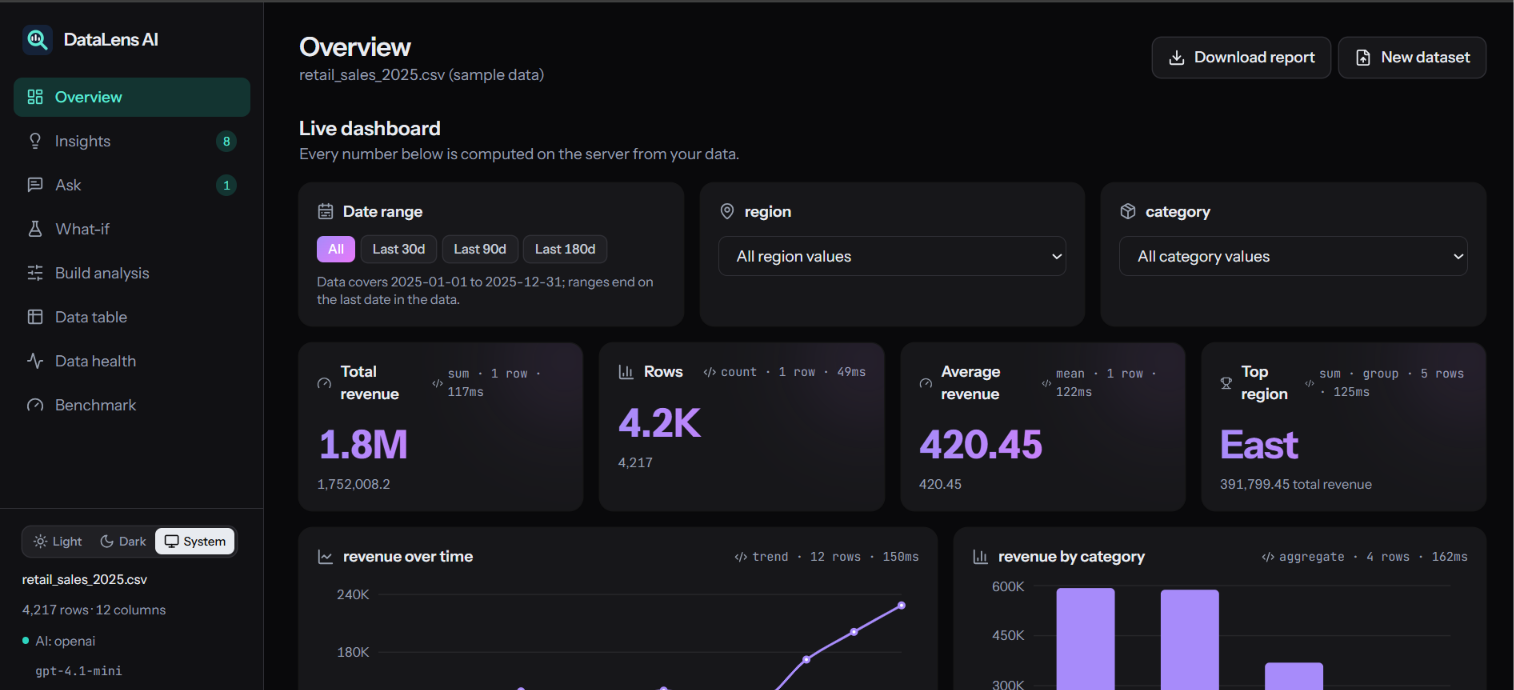
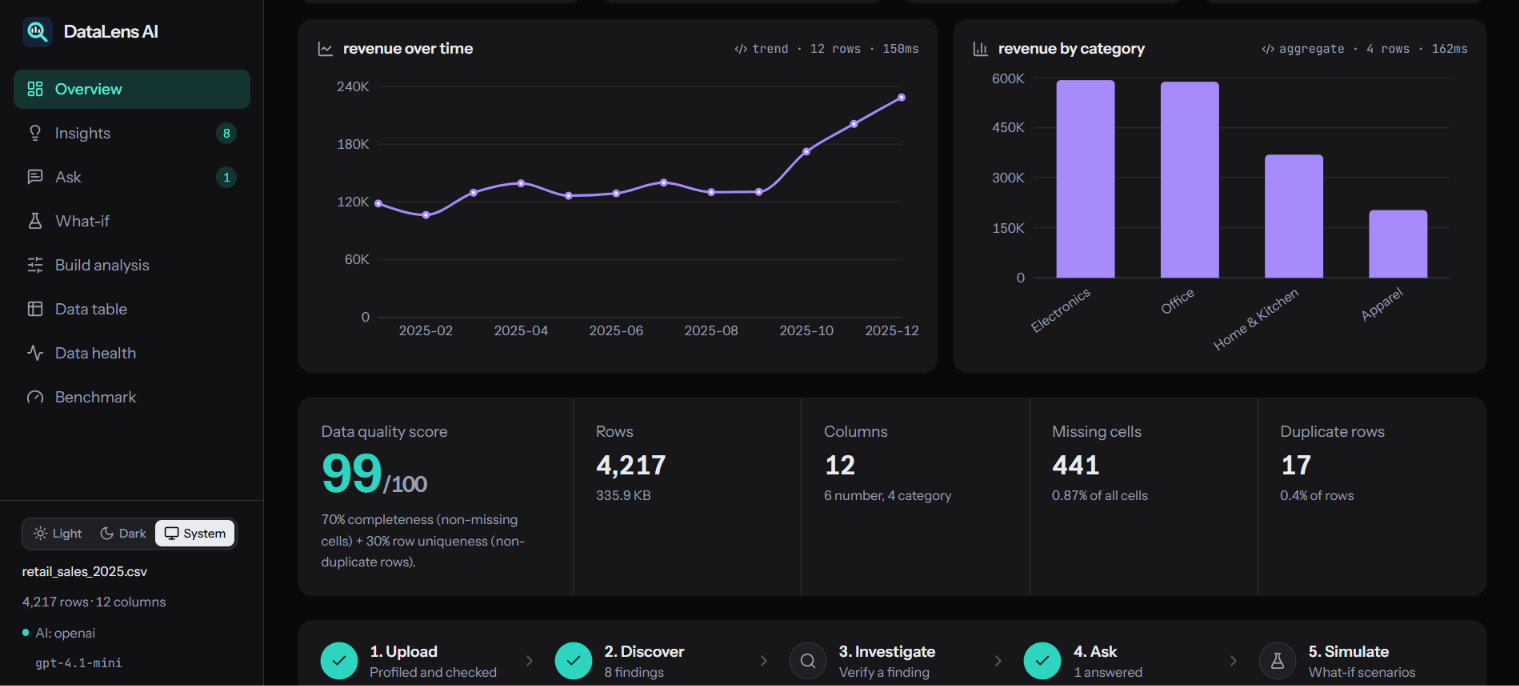
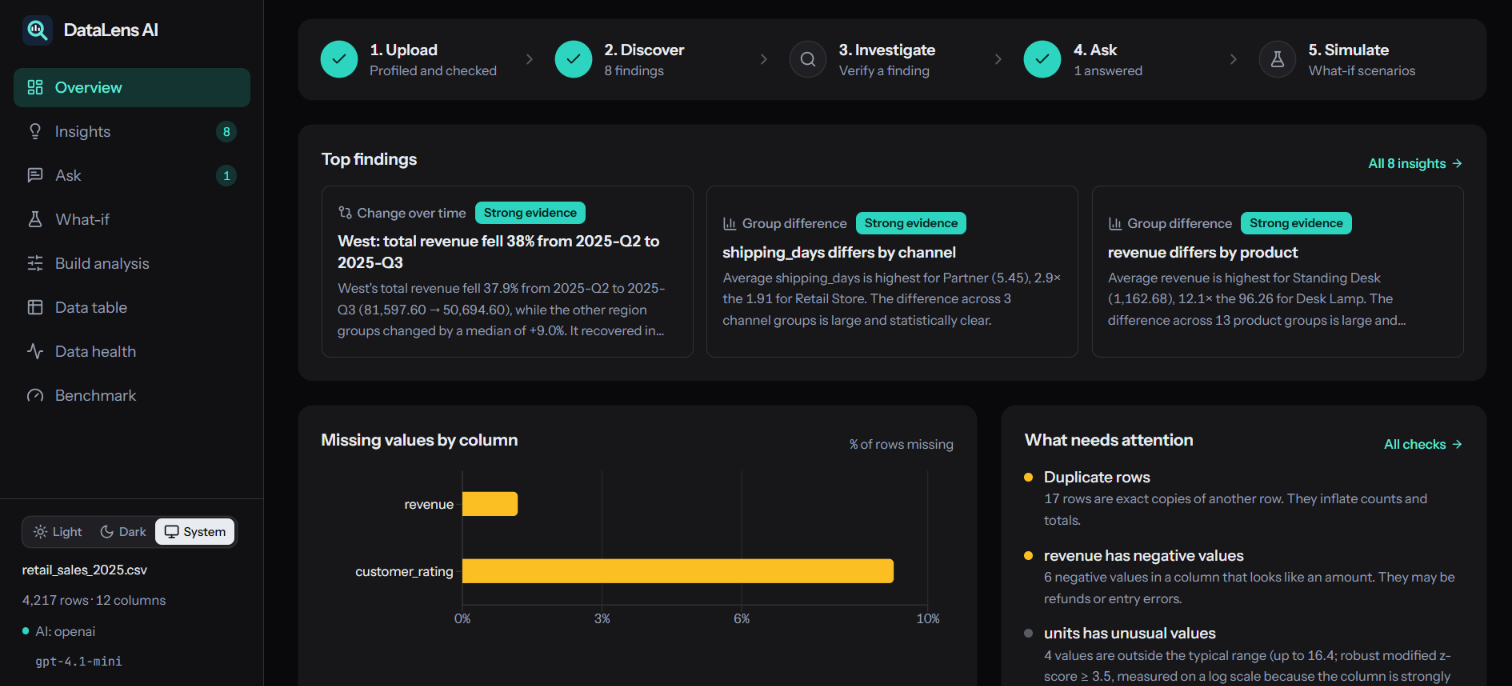
Get a complete overview of your dataset with key metrics, data quality indicators, visualizations, and AI-powered insights.
-
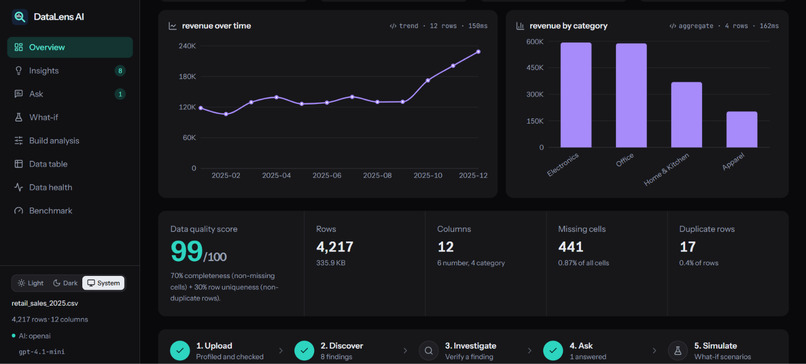
Discover trends and patterns through interactive analytics dashboards and data visualizations.
-
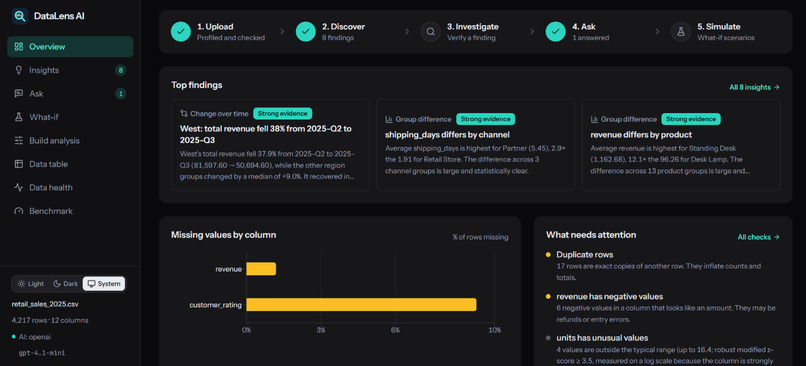
Discover meaningful insights and investigate anomalies with supporting evidence and analytical explanations.
-
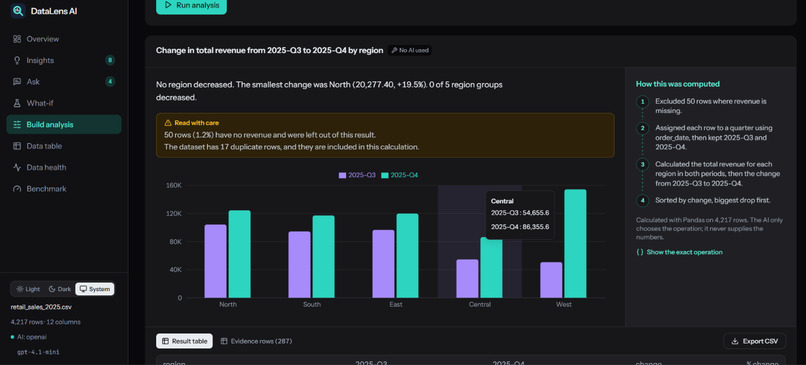
Explore your data through interactive charts and visualizations that make complex information easier to understand.
-
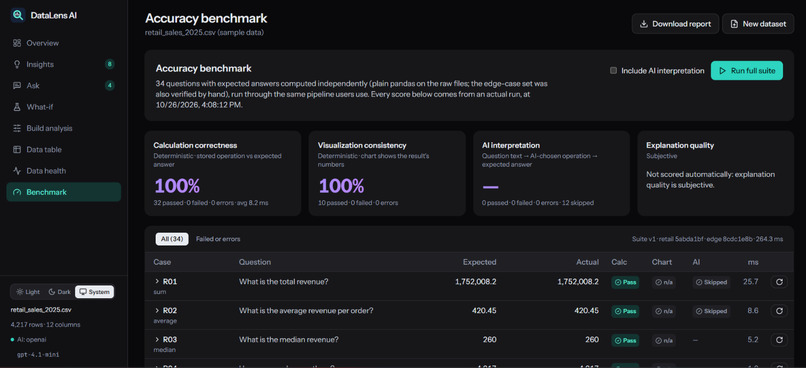
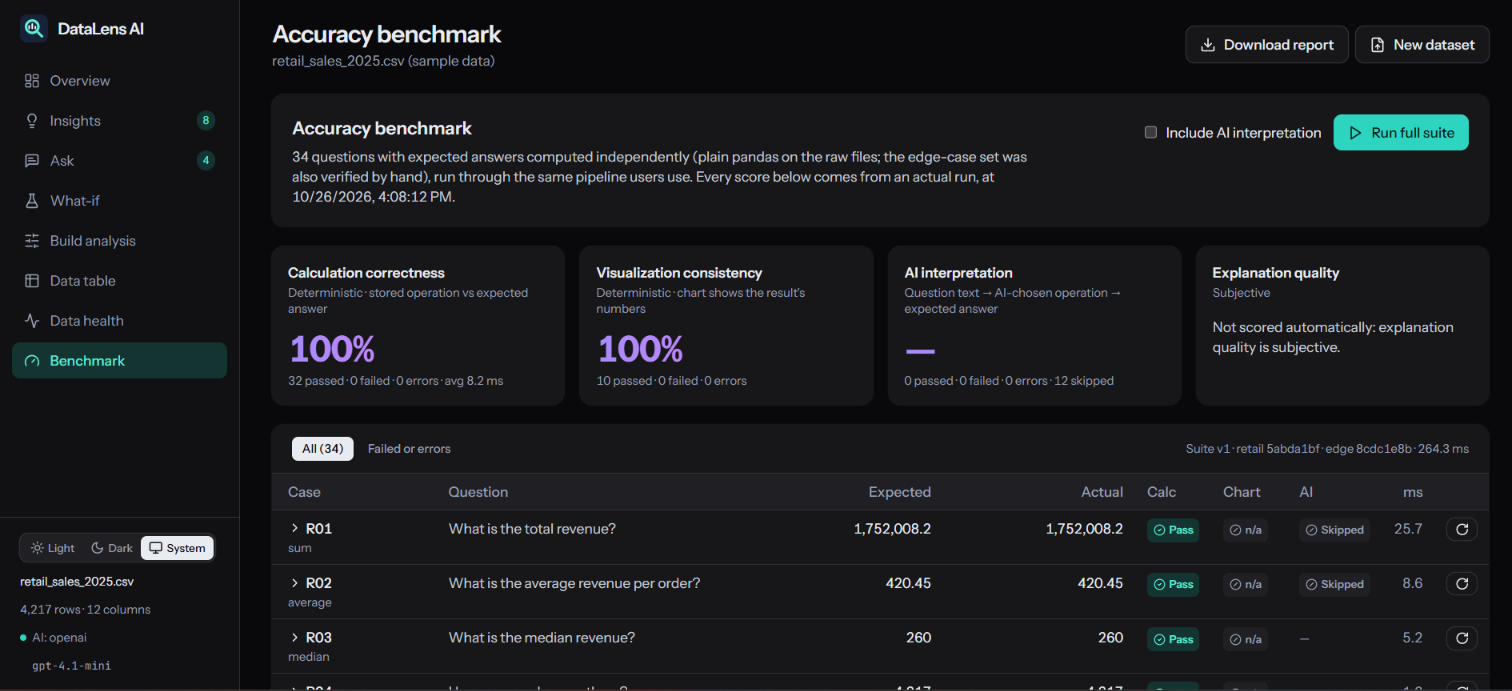
Evaluate analytical reliability by comparing actual results against expected answers using an accuracy benchmark.
-
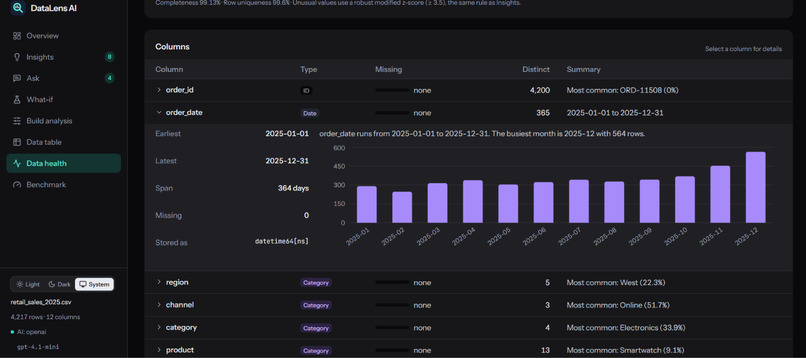
Explore dataset structure, columns, data types, and statistics to better understand your data.
-
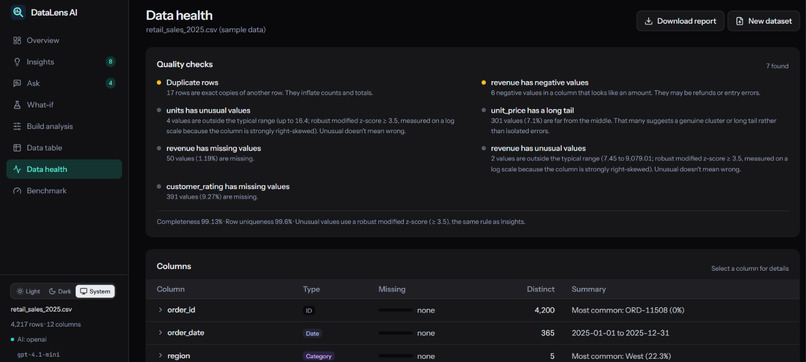
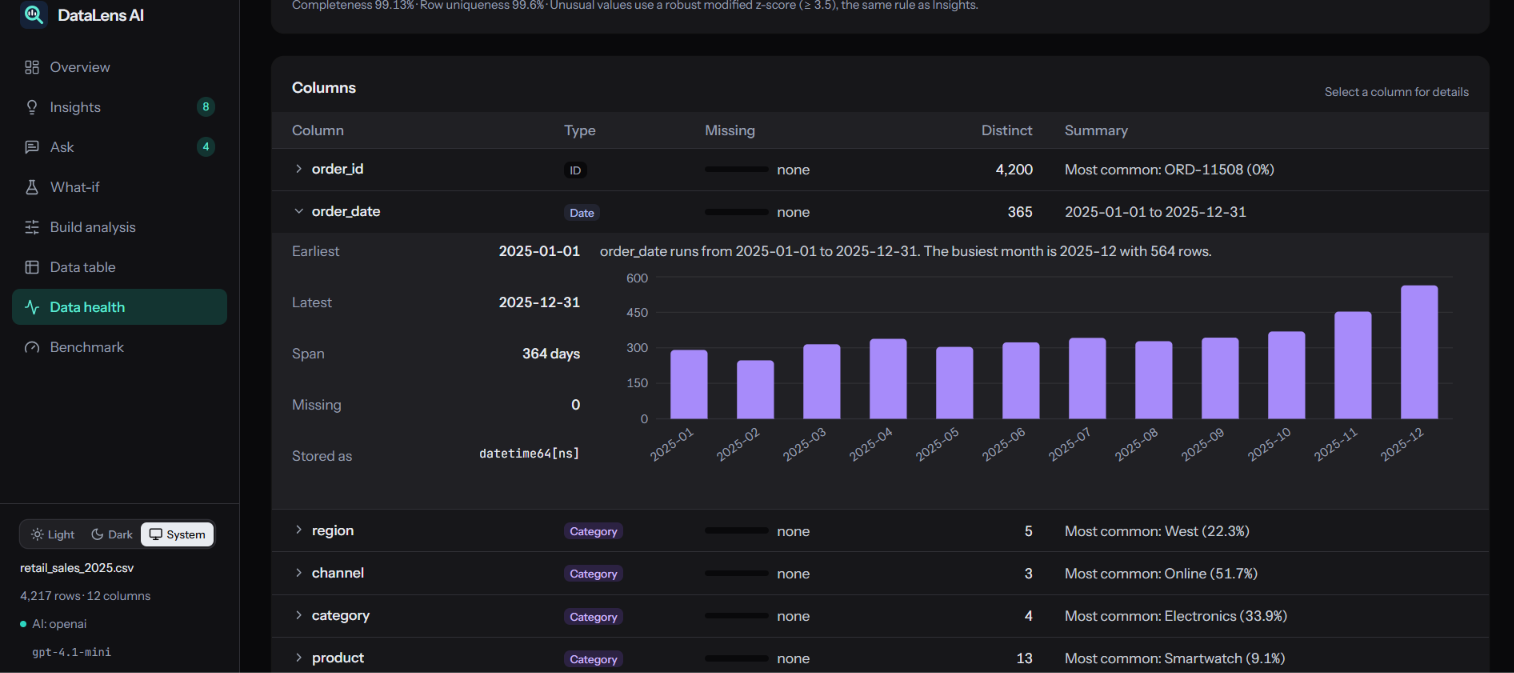
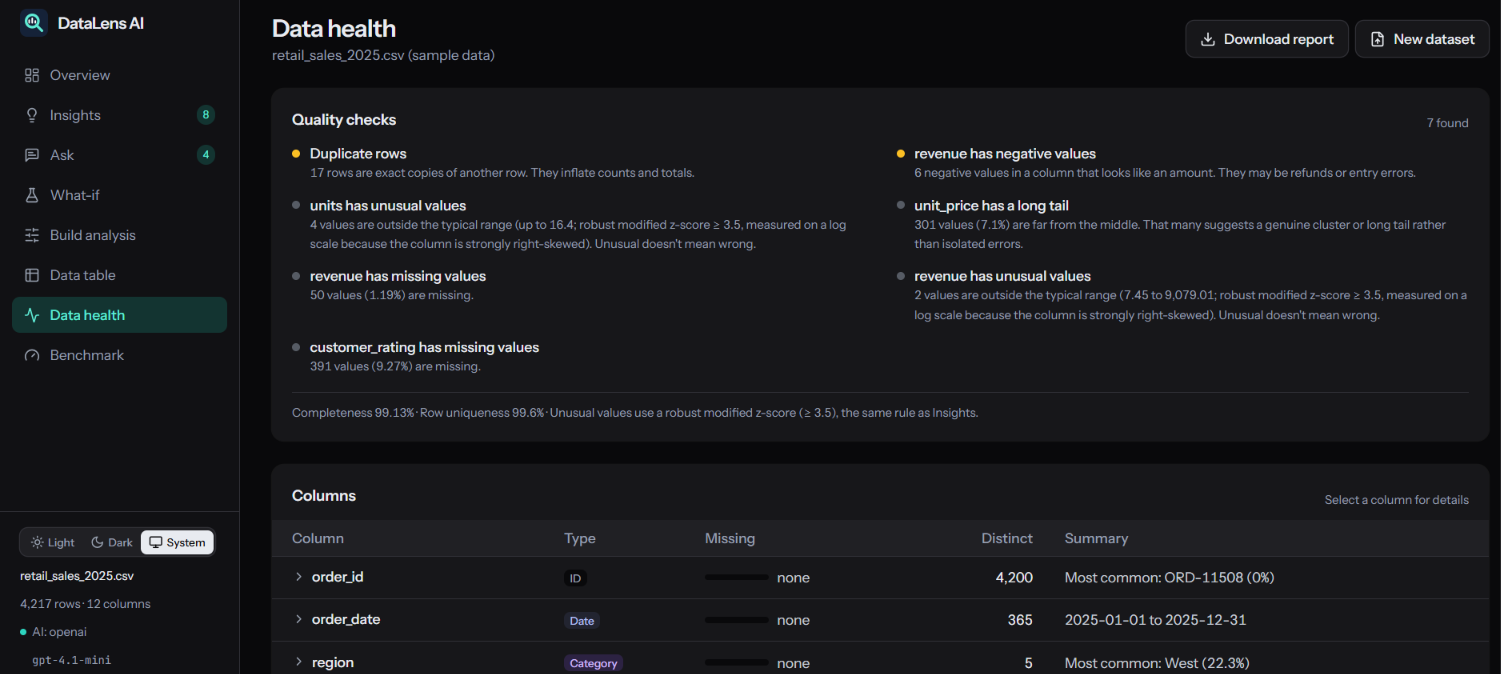
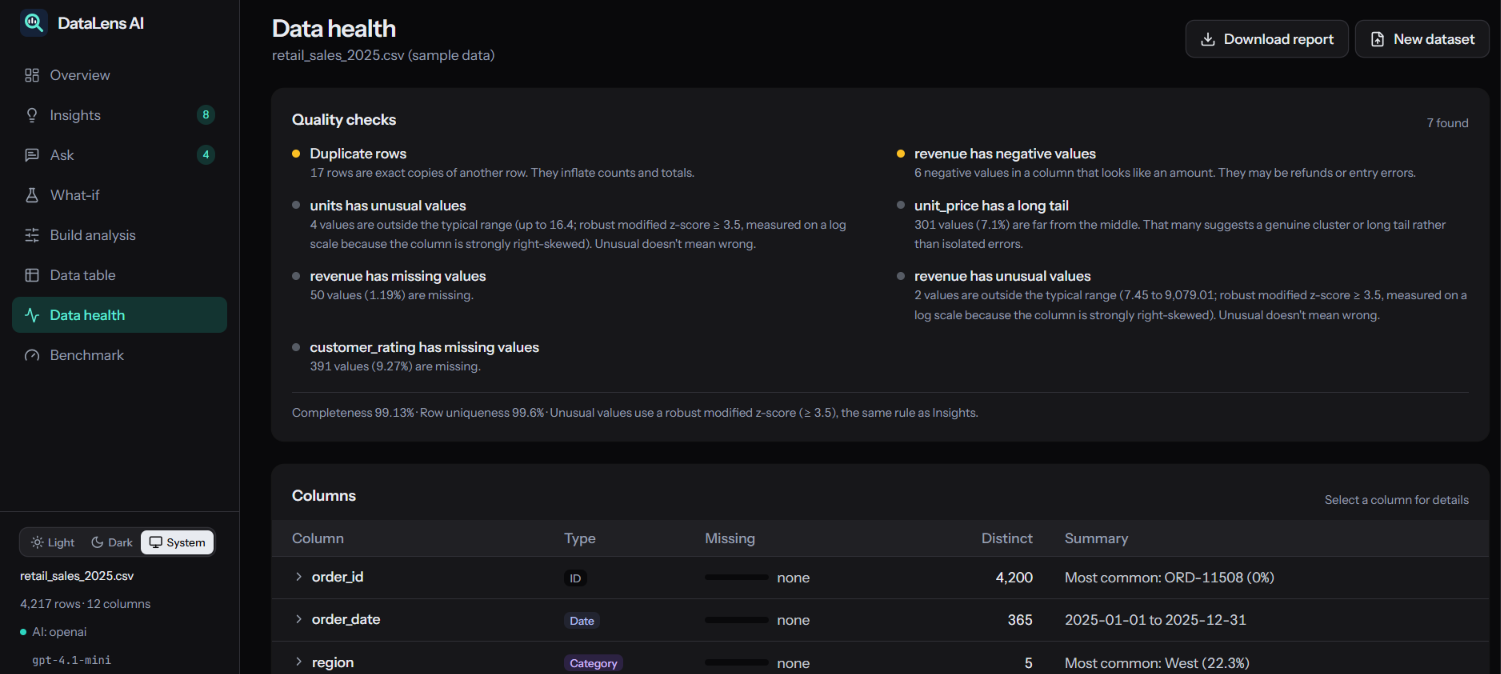
Identify potential data quality issues, including missing values, duplicates, and inconsistencies.
-
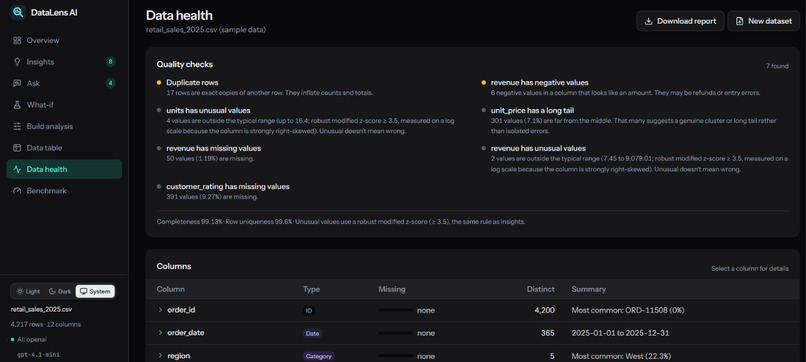
Examine data quality issues in detail to understand potential problems before performing analysis.
-
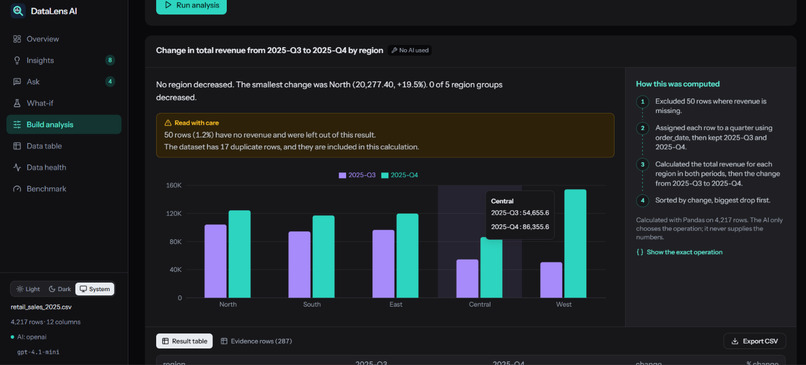
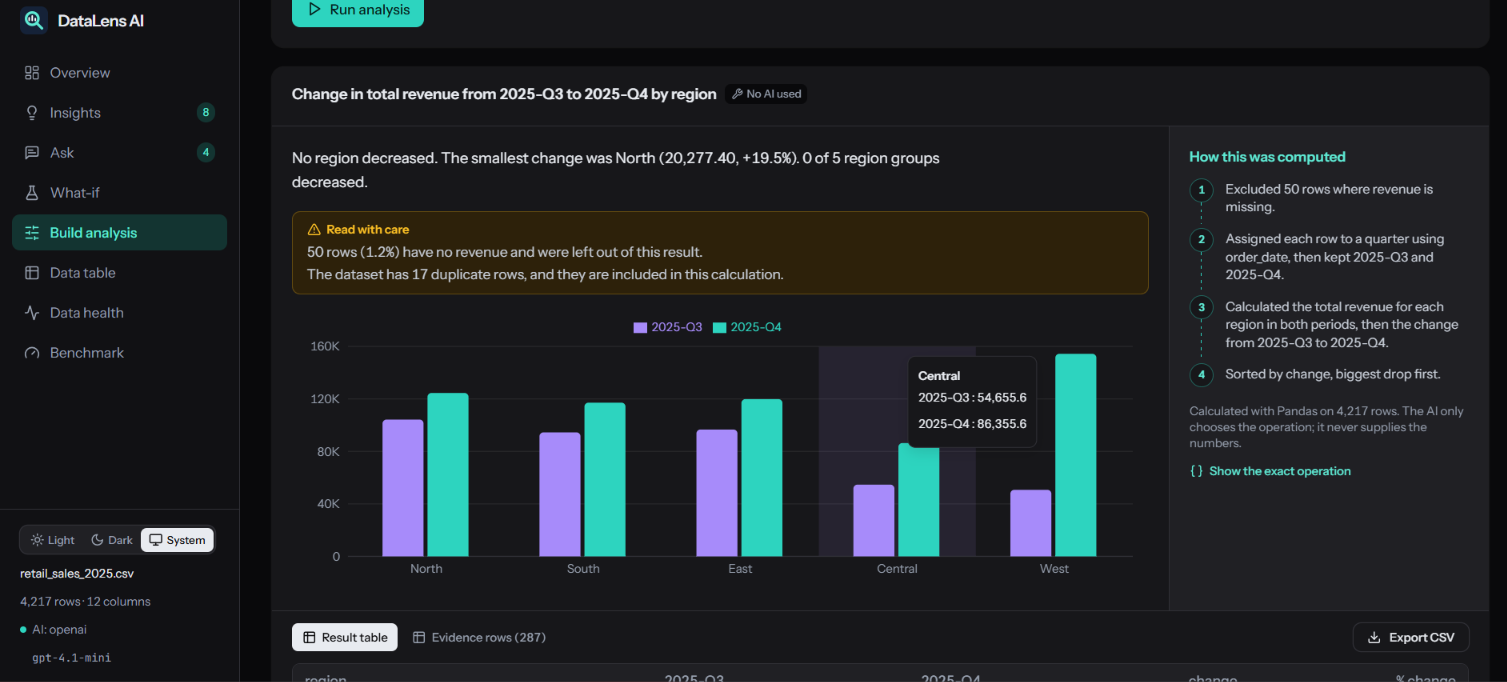
Turn analytical results into clear visualizations that reveal important patterns and trends.
-
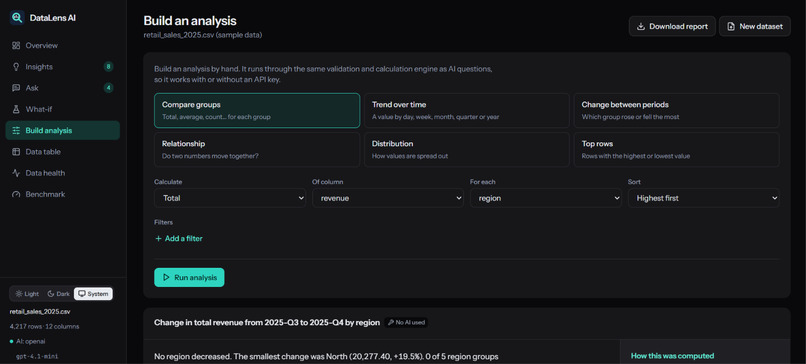
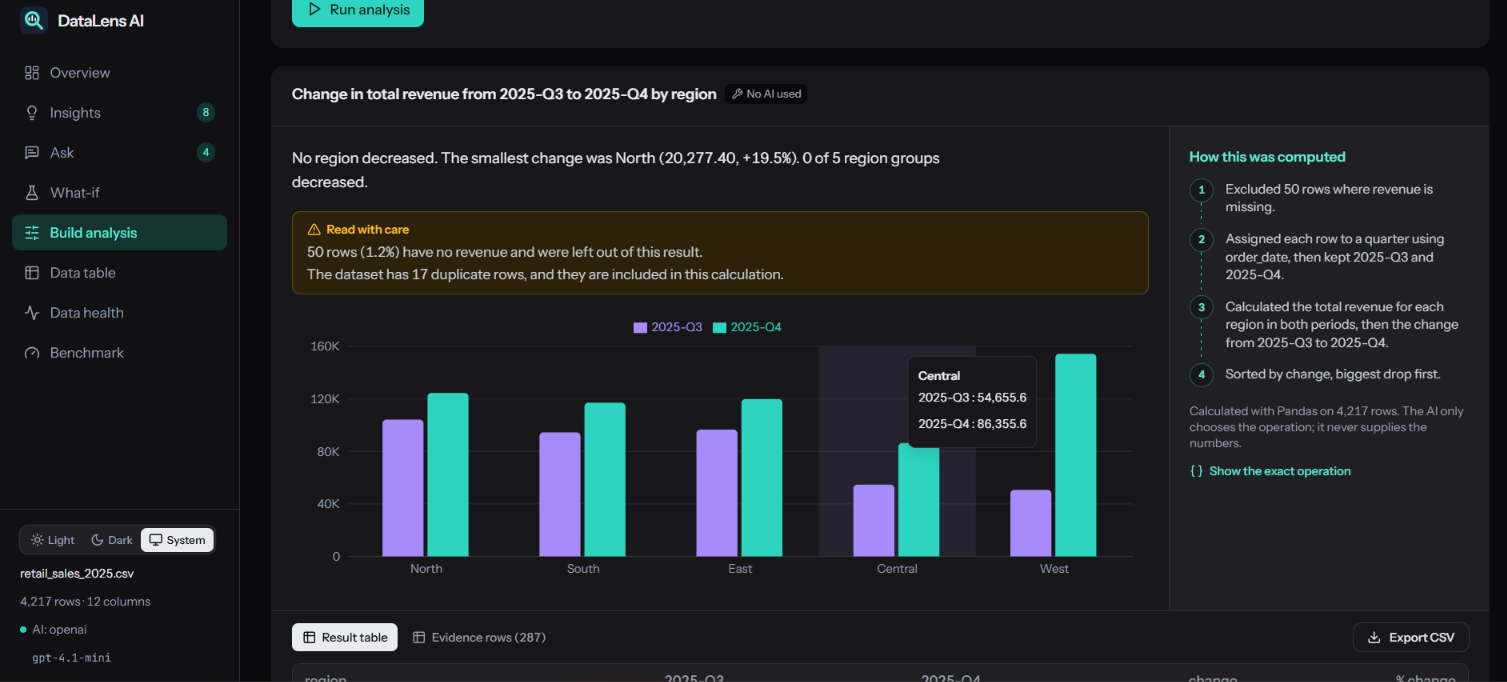
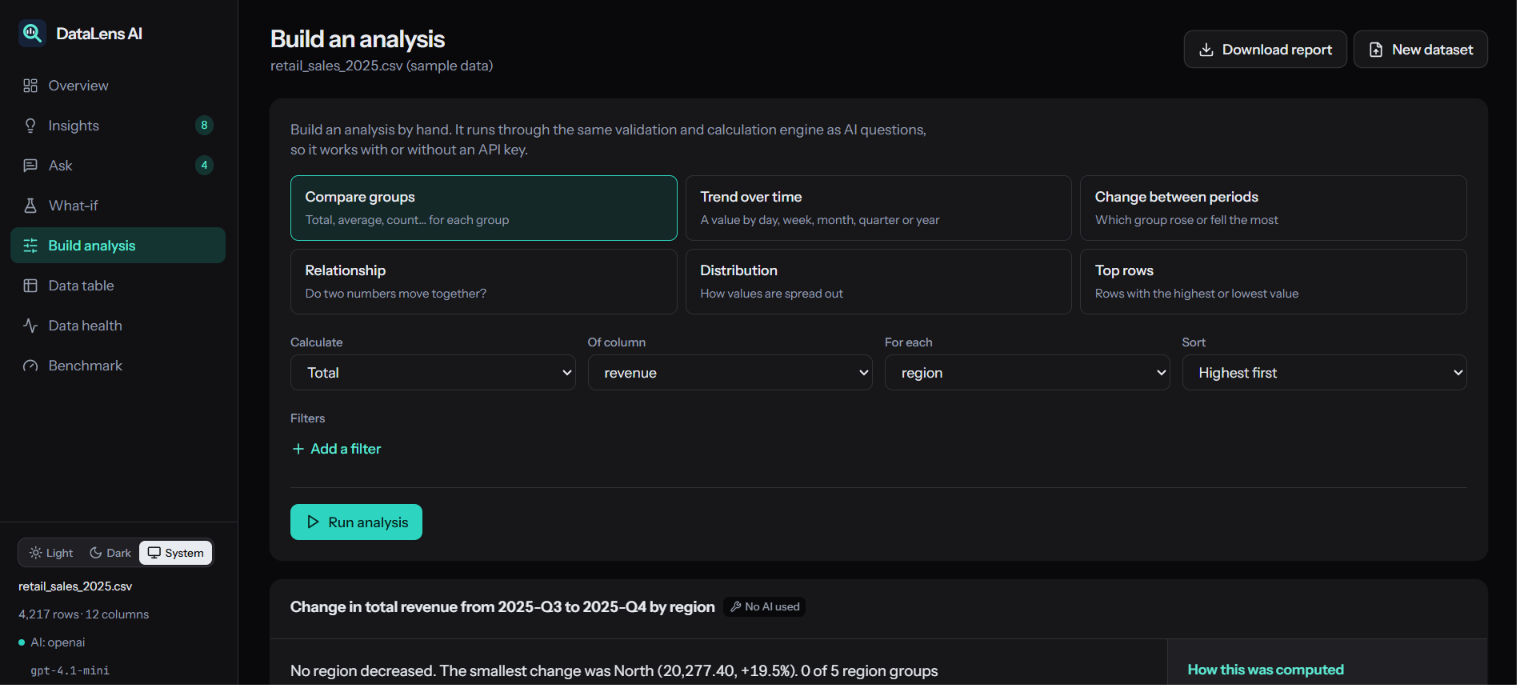
Build custom analyses by selecting operations and configuring analytical parameters to answer specific questions.
-
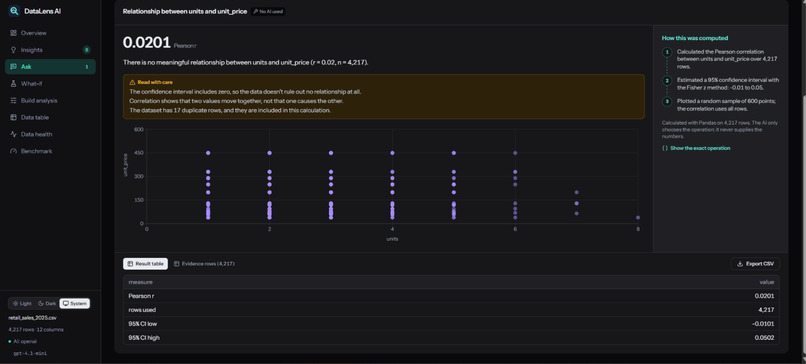
Explore what-if scenarios and compare potential outcomes to support data-driven decisions.
-
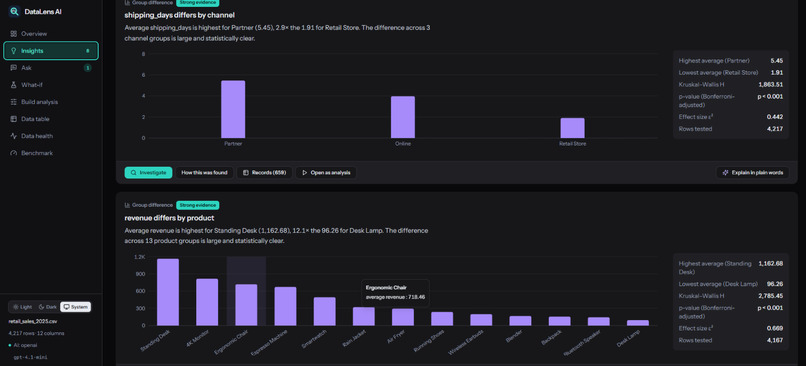
Understand analytical results through detailed breakdowns, supporting calculations, and evidence.
Inspiration
Data analysis often requires hours of spreadsheet work, complex formulas, and manual chart creation. I wanted to make this process easier with AI while addressing one important concern: how can users trust an answer if they cannot verify how it was calculated?
That inspired me to build DataLens AI, an intelligent data analysis platform that combines natural-language interaction with real data computation. Its core principle is simple: every analytical answer should be backed by evidence.
What it does
DataLens AI transforms CSV and Excel datasets into interactive, evidence-backed insights.
- Natural-language analysis: Ask questions about your data in plain English and receive answers based on actual calculations.
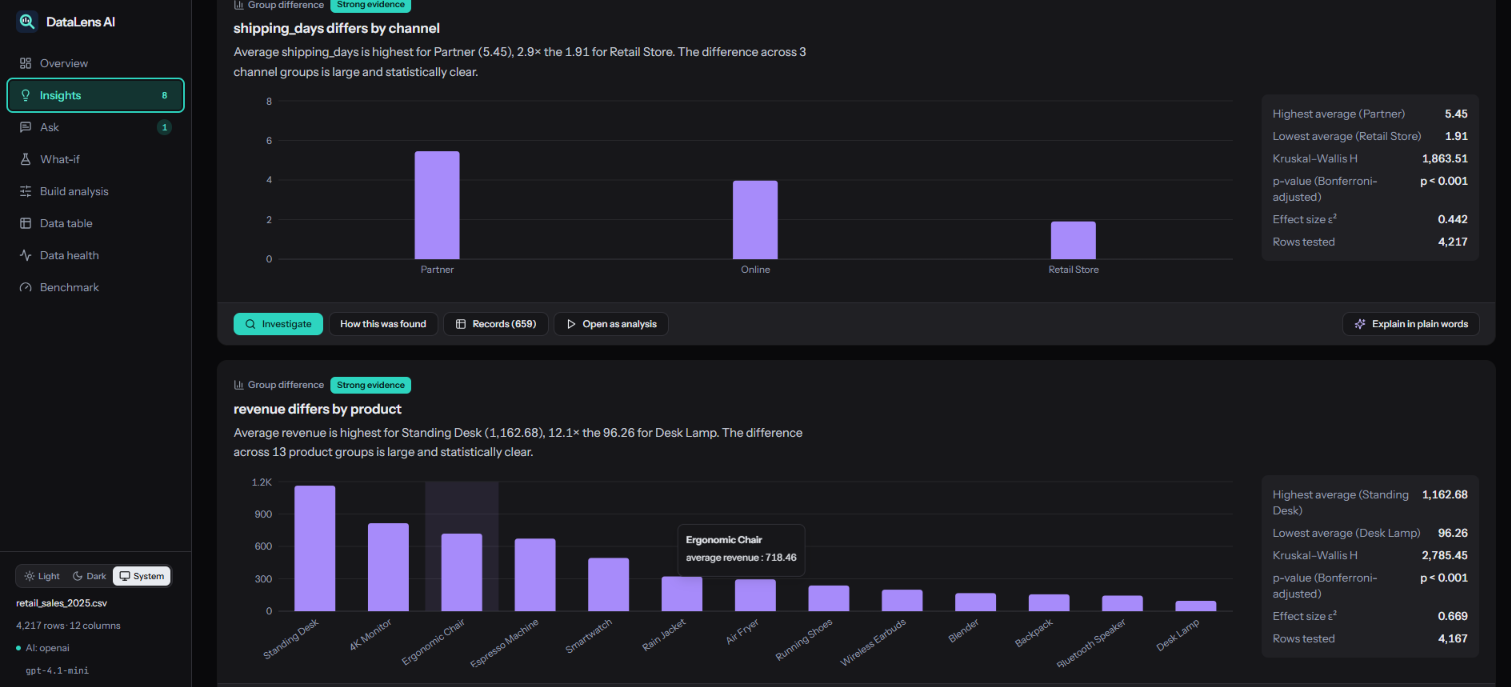
- Automated insight discovery: Identify trends, group differences, unusual values, and changes over time.
- Insight investigation: Explore findings, inspect supporting records, and understand how conclusions were reached.
- Interactive dashboard: Explore key metrics, charts, filters, and data summaries.
- Custom analysis builder: Build analyses involving group comparisons, trends, period changes, relationships, distributions, and top-value comparisons.
- What-If simulation: Explore hypothetical changes and compare calculated outcomes.
- Data health checks: Detect missing values, duplicate rows, unusual values, and other data-quality concerns.
- Accuracy benchmark: Compare analytical results against independently calculated expected answers.
- Reports and exports: Download reports and export analysis results.
- Theme customization: Switch between light, dark, and system themes.
The key differentiator is transparent analysis. DataLens AI is designed to show the calculations, supporting evidence, and limitations behind analytical results instead of asking users to trust AI-generated numbers blindly.
How we built it
DataLens AI combines a modern web interface with a Python-based analytical backend. The frontend provides an interactive workspace for uploading datasets, exploring dashboards, investigating insights, and building analyses. The backend handles data processing and executes validated analytical operations.
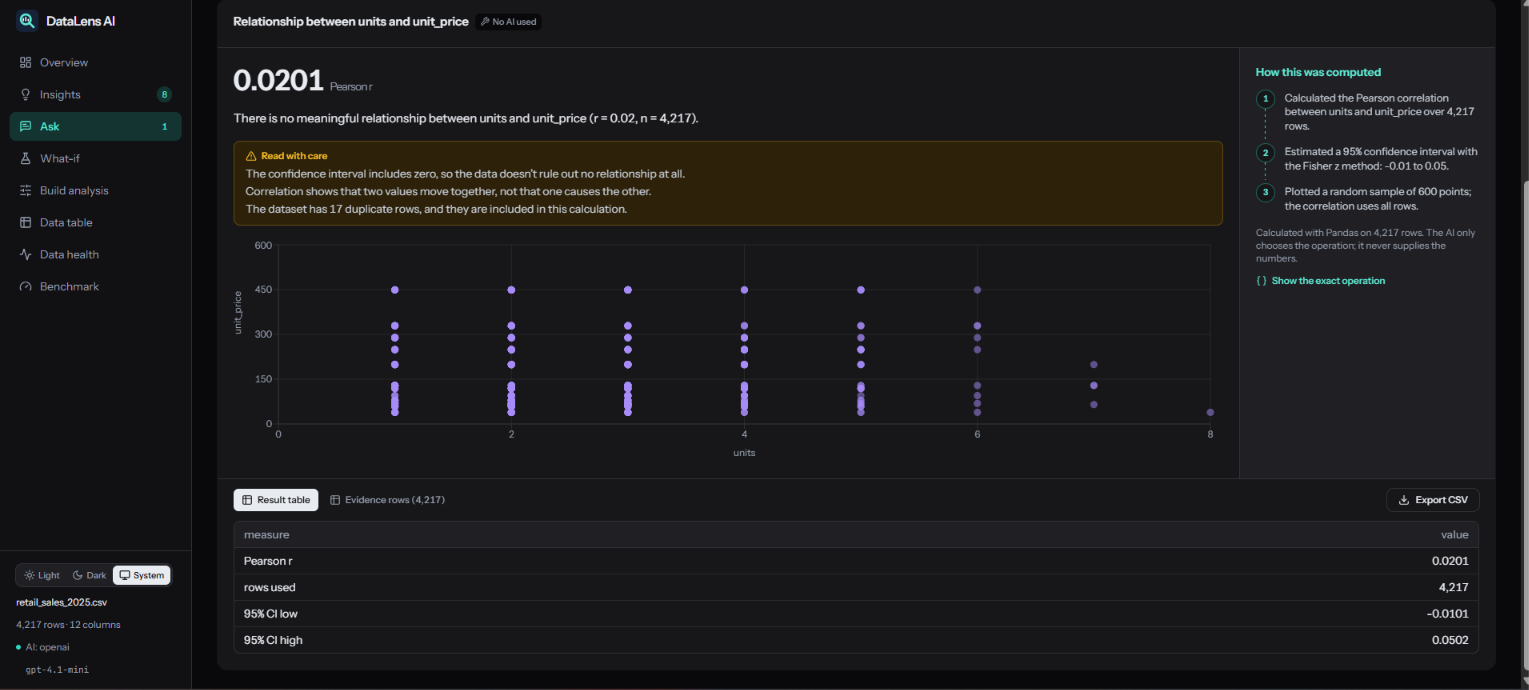
The application uses Pandas for data computation, while AI helps interpret natural-language questions and select appropriate operations. Numerical results come from data processing rather than being invented by the language model, and the system is designed to avoid executing arbitrary AI-generated code.
Interactive visualizations help users understand trends and comparisons, while evidence panels explain calculation steps and highlight relevant caveats. I also built an accuracy benchmarking workflow to evaluate analytical correctness against independently calculated expected results.
Challenges we ran into
One of the biggest challenges was balancing natural-language flexibility with numerical accuracy. User questions can be ambiguous, requested columns may not exist, and datasets can contain missing values or duplicates. The application needs to handle these situations carefully instead of producing misleading conclusions.
Another challenge was making complex analysis accessible. Users need more than numbers and charts; they need to understand the methodology, inspect supporting records, and recognize limitations in the data.
Integrating the analytical engine, AI functionality, visualizations, scenario analysis, and benchmarking into a cohesive experience also required careful attention to validation, error handling, and consistency across the application.
Accomplishments that we're proud of
One of our main accomplishments is bringing multiple stages of data analysis into one workspace, from uploading a dataset and discovering insights to investigating evidence and exploring hypothetical scenarios.
We are particularly proud of the evidence-first approach. Users can inspect how calculations were performed, review supporting records, and see warnings when missing data or other limitations affect a result.
The custom analysis builder provides a structured way to explore data without relying entirely on natural-language prompts. Combined with the accuracy benchmark, it supports a more transparent and testable approach to AI-assisted analytics.
What we learned
Building DataLens AI reinforced the importance of separating AI interpretation from actual computation. A convincing answer is not necessarily a correct answer, especially when numerical decisions depend on the results.
I learned more about analytical validation, data-quality checks, statistical interpretation, interactive visualization, and designing AI applications that communicate uncertainty. I also learned that a strong product depends on how well its features work together, not simply on how many features it contains.
What's next for DataLens AI
The next step is to continue improving analytical reliability, expand benchmark coverage, and make the investigation workflow even more useful for real-world datasets.
Future improvements could include richer multi-dataset analysis, more customizable dashboards, persistent analysis sessions, advanced report generation, and carefully evaluated predictive analytics.
My long-term goal is to make DataLens AI a trustworthy analytics companion that helps people move from raw spreadsheets to informed decisions, with evidence they can inspect and results they can verify.
Built With
- anomaly-detection
- artificial-intelligence
- data-analytics
- data-processing
- data-quality
- data-science
- data-visualization
- duckdb
- excel
- explainable-ai
- exploratory-data-analysis
- fastapi
- generative-ai
- interactive-dashboards
- large-language-models
- machine-learning
- natural-language-processing
- pandas
- python
- react
- rest-api
- statistical-analysis
- tailwind-css
- typescript
- vite


Log in or sign up for Devpost to join the conversation.