Inspiration
Data pipelines fail silently. A dataset stops loading, a schema drifts, lineage breaks, but dashboards stay green because monitoring watched job heartbeats instead of the data itself. When something finally surfaces, blame lands on innocent downstream consumers instead of the root cause.
I built this after living through the failure mode: a capture feed that ran green for 24 days while ingesting nothing, because the heartbeat proved the job started, not that data arrived. The lesson generalizes. Liveness must be measured from the data's own timestamps, never from the process that was supposed to write it.
What it does
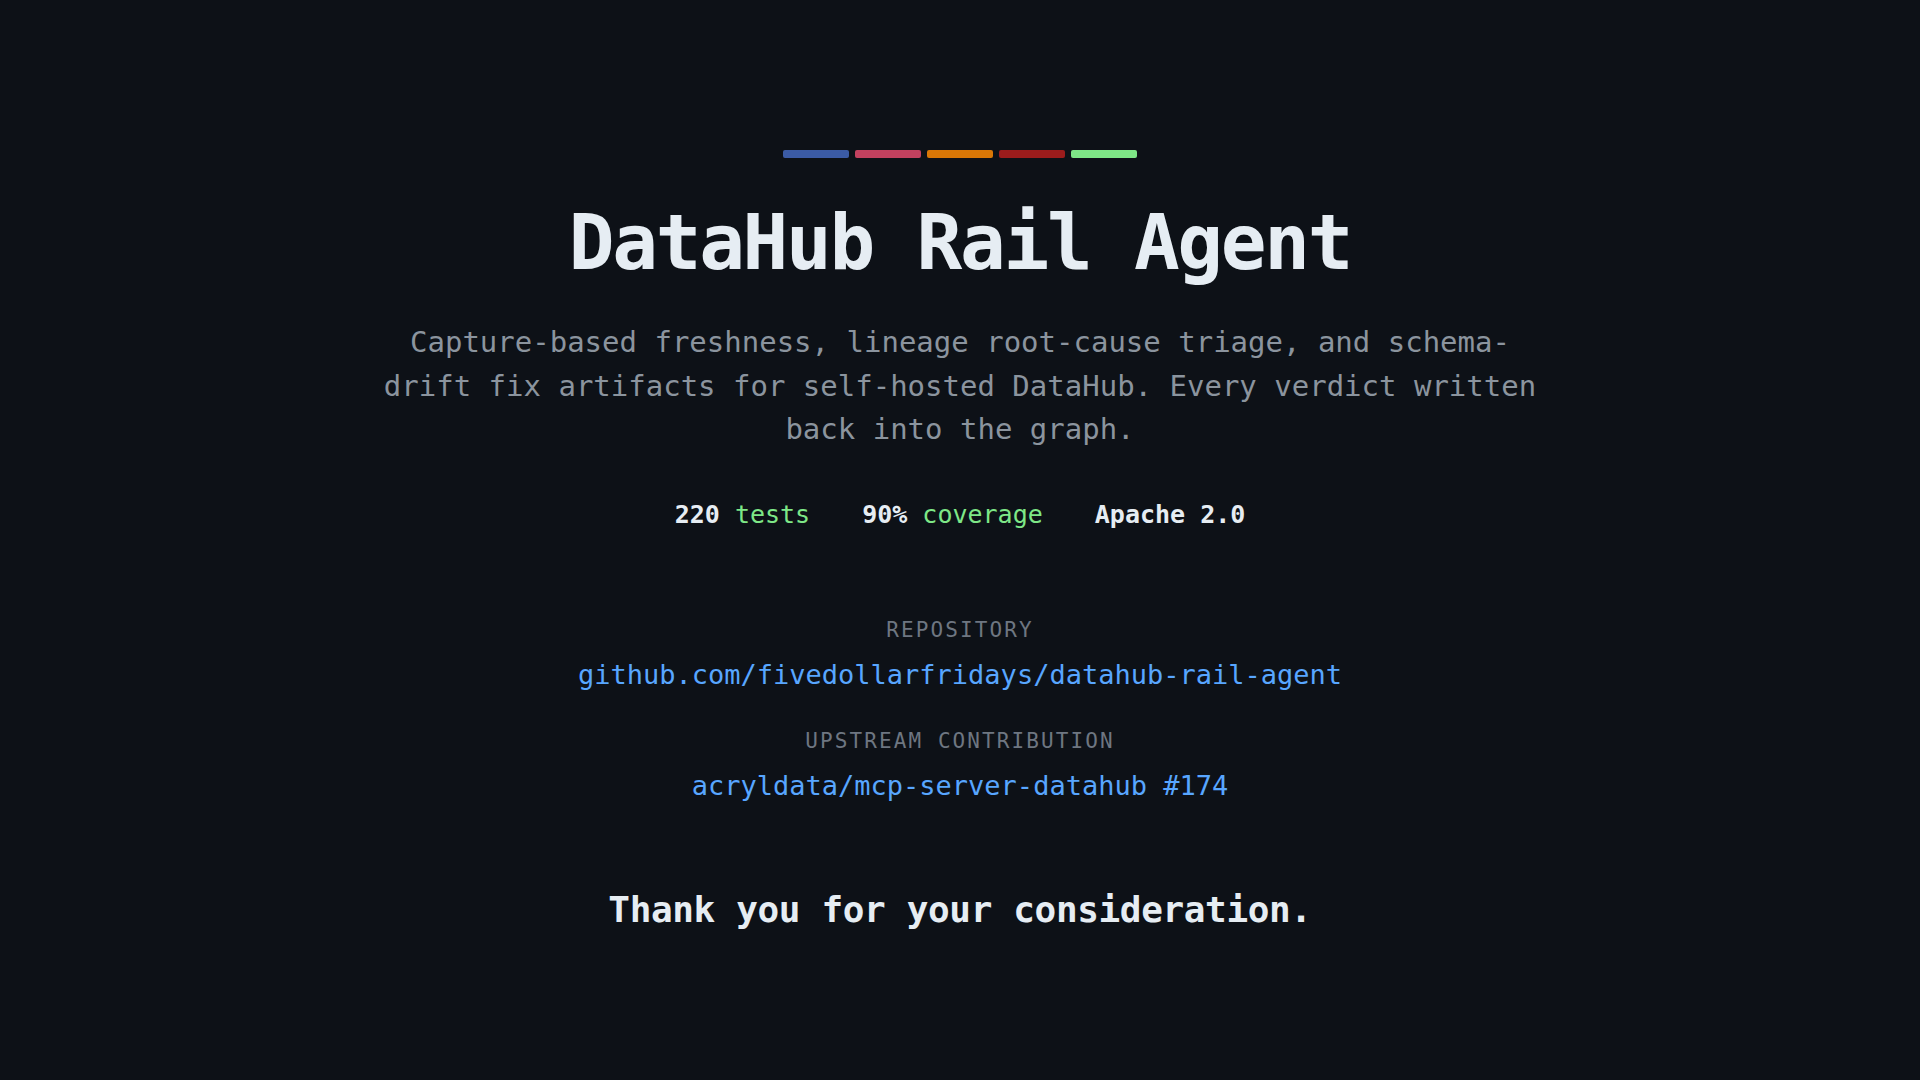
DataHub Rail Agent runs three classes of health probes across a data estate, classifies every result against history, walks lineage to find the true root cause, and publishes its verdicts back into DataHub so other agents inherit the context.
Three probes, all with never raise contracts (an exception becomes an actionable message, never a silent pass):
- Freshness. Measures dataset age from its own
lastModifiedaspect against an SLA, default 24 hours. Capture based, not job based. - Lineage. Compares declared upstream edges against the edges the graph can still resolve. A dataset declaring no upstream is a source table and passes. One whose declared upstream no longer resolves fails loudly and names the missing dataset.
- Schema. Detects contract drift when an upstream column type changes, for example
decimal(12,2)becomingint.
Delta aware state history. Every verdict is classified against prior runs as NEW, CHRONIC, or RECOVERED. A first failure creates urgency. The same failure on day nine is tracked but deprioritized. A flip from fail to pass closes the incident. First run with no history degrades gracefully.
Lineage walk triage. On failure the agent walks upstream to the deepest failing node, gathers evidence, and writes a markdown incident report addressed to the owners it read from the ownership aspect.
Fix artifacts, not just alerts. Schema violations emit a YAML patch, a unified diff computed with difflib against the committed downstream contract, and a structured commit message. The test suite runs git apply against that diff on every run, so the patch is proven to apply rather than assumed to.
Write back. With --writeback the agent publishes each verdict onto the dataset in DataHub itself: a searchable rail.status.* tag plus structured properties carrying the verdict, probe, run timestamp, and incident pointer. Both aspects are read merged, so rail replaces only its own markers. Any other MCP reading agent now inherits rail's health context instead of re deriving it.
Provenance guarantee, and it is stronger than the usual one. There is no model anywhere in the fact path, because there is no model in this project at all. The dependency list is mcp, aiohttp, and PyYAML. Every fact in every incident report is a DataHub graph read, rendered deterministically, and each report ends with a provenance table naming the tool, the entity, and the read timestamp behind every claim. Nothing is phrased by a model, so nothing can be hallucinated. Most agent submissions ask you to trust that the model stayed on the rails. This one removes the rails question entirely.
How I built it
Python 3.11+, talking to DataHub through the MCP Server plus the OpenAPI v3 entity endpoint.
DataHub surfaces used:
- Context graph reads via MCP Server:
searchfor dataset discovery,get_entitiesfor owner, name and platform,list_schema_fieldsfor field types,get_lineagefor resolved upstream edges. - Aspect reads via OpenAPI v3:
datasetProperties.lastModifiedfor capture based freshness, and theupstreamLineageaspect for declared edges. The MCP tool surface exposes neither. Entity properties come back withoutlastModified, andget_lineagereturns only upstreams that still resolve, so a soft deleted upstream, which is exactly the broken lineage fault, simply disappears. Reading the declared aspect directly is what makes that fault detectable at all. - Metadata ingestion: the seeder writes datasets, schemas, ownership and lineage through the OpenAPI v3 entity endpoint, failing loud on any non 2xx or error body.
- Lineage navigation: breadth first graph walk to identify root cause candidates.
- Ownership aspect reads for incident report @mentions.
- Metadata write back via OpenAPI v3, opt in, onto
globalTagsandstructuredProperties. - Read after write for self verification:
check-monitorreads therail.last_runstamps back out of the graph to judge whether the monitor itself is still alive. The graph is not just the subject of monitoring here, it is the evidence store the monitor uses to prove its own liveness.
Engineering: TDD throughout. 220 tests at 90% line coverage (verified: 220 passed, 1088 statements, 111 missed). The suite is hermetic, with sockets blocked for every test and a canary that proves the block is live, so a fail soft path cannot pass locally against a running service and then fail in CI. File and function size limits are enforced in CI. ruff 0.16.1 and the full suite run in GitHub Actions.
What makes it different from DataHub out of the box
This is the question I expect judges to ask, so I want to answer it directly.
DataHub Cloud Observe already provides freshness, volume, and schema assertions, including anomaly detection that learns a table's normal change cadence. That is a genuinely good product and this project does not pretend otherwise.
Two things distinguish this work.
First, it brings estate wide health monitoring to open source DataHub. Observe is part of the managed Cloud offering. This agent runs against a plain open source DataHub quickstart using only the MCP Server and the public OpenAPI, so a team on self hosted DataHub gets capture based freshness, lineage integrity, and schema drift detection without moving to Cloud.
Second, it is built on three things assertions structurally do not do.
1. The verdict becomes context other agents inherit. Run with --writeback and each probed dataset carries a searchable rail.status.* tag plus structured properties holding the verdict, the probe that issued it, the run timestamp, and the incident pointer. That turns "which tables are chronically failing" from a log grep into a catalog facet query. More importantly, any other MCP reading agent already calling get_entities or search now sees rail's verdict on the assets it was about to touch. A query agent can refuse to answer off a CHRONIC table. A migration agent can see which upstreams are mid incident. Neither needs to know this project exists. Both aspects are read merged, so rail replaces only its own markers and anything set by humans or other tools survives. This is an agent ecosystem idea rather than a monitoring idea, and it is the part I would defend hardest.
2. The monitor proves its own liveness from capture evidence. A monitor that dies quietly looks exactly like a healthy estate: no alerts, no incidents, nothing to notice. check-monitor exits non zero when the newest rail.last_run stamp in the graph is older than the window, and also when there is no stamp at all, because no evidence is a blind state rather than a passing one. Liveness is judged from what the agent actually wrote into DataHub, never from a heartbeat file. One line later in the same cron job, and a dead rail becomes a red build instead of a quiet week.
3. Triage separates a stalled producer from a broken delivery. A stale dataset whose immediate upstreams are all fresh is a different fault from one sitting behind a stalled pipeline. The producer ran, the output never arrived, and the break is on the edge between them. When the graph shows that shape, the report leads with an explicit "Producer Healthy, Delivery Broken" callout showing both capture timestamps, pointing at the edge rather than at a job whose run history reads green throughout. When an immediate upstream is stale too, no callout fires and the ordinary root cause walk stands.
Underneath all three sits delta aware state history. Threshold alerting re fires on every violation until nobody reads the alerts. This fires on state change, and the difference between run one and run two comes entirely from persisted history, with no clock faked and nothing backdated.
Why platform teams care
Every row below is a fault that actually ran in a production ops system, and the behavior this agent has because of it. None were caught by a threshold or a dashboard. Each was invisible until something downstream was already lost.
| Failure mode | What happened | What the agent does about it |
|---|---|---|
| Silent capture outage | An ingest feed captured nothing for 24 days behind a green heartbeat. The job started on schedule, exited zero, wrote no rows, so every status surface read healthy while the data stopped. | Freshness is capture based: each probe measures a dataset's own lastModified, never a job's exit status. A feed that runs and writes nothing fails on the next pass. |
| Producer green, deliverable dead | A daily deliverable stopped arriving for nine days while the pipeline producing it ran green every night. A week went into diagnosing the scheduler; the break was a missing config file on the delivery step. | Triage compares the failing dataset's capture time against its immediate upstreams'. Stale output behind fresh producers gets the "Producer Healthy, Delivery Broken" callout, both timestamps shown, pointing at the edge instead of the job. |
| Silently dead watcher | A scheduled watcher stopped producing check runs entirely and nothing said so. Absence of output is indistinguishable from a quiet week, so the monitor's own death was the one failure it could not report. | check-monitor exits non zero when the newest rail.last_run stamp in the graph is stale, or absent entirely. |
| Fail soft handler hiding a broken test | A test asserted a write back happened, but the code opened a connection first inside a fail soft try. On a machine with DataHub running the connect succeeded and the test passed. In CI, with nothing listening, the swallowed exception skipped the assertion. |
The suite blocks sockets for every test, with allow_network as the only escape hatch, and a canary makes a real call to prove the block is live. |
Challenges I ran into
The honest one: my first build was demo dead behind green CI.
Everything passed. The seeder printed success while writing zero datasets, because it issued GraphQL mutations that do not exist and swallowed the error body. The MCP client could not open a session and was calling four tools that were not real. The documented entry command did not exist. CI was green the entire time, because the tests exercised fixtures rather than the live path.
I caught it by running the judge's path on a clean clone as an adversarial exercise rather than trusting the suite, which produced twelve findings. Fixing them is what made the project real, and it is why the test suite now blocks sockets with a liveness canary. A fail soft path can no longer pass locally against a running service and fail in front of a judge.
That experience is the same lesson the product itself encodes. A green signal that does not measure the thing you care about is worse than no signal, because it buys false confidence.
Accomplishments I'm proud of
The provenance guarantee held, and it is absolute rather than best-effort. Every fact in every generated incident report traces to a DataHub graph read, because there is no model in the codebase that could supply one. In a category full of agents that hallucinate confident narratives, removing the model from the fact path entirely was worth the engineering.
The generated patches actually apply. git apply runs against the produced diff on every test run.
And the fault detection is honest. Pointed at a real production estate rather than the demo fixtures, the agent returned seven genuine failures against seven passes, and correctly named an upstream corpus as the root cause candidate for a stale downstream fingerprint. It found real problems in a real system on the first try.
What I learned
The MCP tool surface and the underlying metadata model are not the same thing, and the gap is where the interesting faults live. get_lineage only returns upstreams that still resolve, which means the single most diagnostic lineage failure, a soft deleted upstream, is invisible through the tool surface and only visible by reading the declared upstreamLineage aspect. Building this required treating MCP as one read path among several rather than as the whole API.
Open source contribution back to DataHub
I contributed a health monitoring agent patterns guide upstream to the DataHub MCP Server repository, documenting the aspect reading approach above so the next person building an agent against this surface does not have to rediscover the gap.
acryldata/mcp-server-datahub PR #174: https://github.com/acryldata/mcp-server-datahub/pull/174
What's next
Community contributed probe plugins, Slack and PagerDuty delivery, a trend view over the state history, and auto remediation hooks for the faults where a retry is the correct response.
Try it
The repository ships a reproducible demo estate with three deliberate faults and two healthy controls, so a judge can reproduce every result in the video.
- Stale freshness:
orders_archive, 45 days old against a 24 hour SLA - Broken lineage:
events, declaring an upstream that has been deleted - Schema drift:
transactions, whereamountmoved fromdecimal(12,2)toint - Healthy controls:
usersandtransactions_warehouse
DATAHUB_GMS_URL=http://localhost:8080 python scripts/seed_demo_estate.py
The seeder is idempotent. All sample outputs committed to the repository, including incident reports, patches, diffs, and the state digest, are regenerated from a real two run pass by scripts/refresh_sample_outputs.py rather than written by hand.
Full setup is in the README and docs/environment.md. Zero to demo has been verified on a clean clone.
All code in this repository was written during the hackathon submission period. The architectural approach draws on capture-reliability patterns from prior private operations work, which is design doctrine rather than code; this is also disclosed in the README.
Built With
- aiohttp
- datahub
- github-actions
- mcp
- openapi
- pytest
- python
- ruff

Log in or sign up for Devpost to join the conversation.