-
-
DataGlance Chrome Extension
DataGlance
Inspiration
We look at tables on websites—rows and columns of numbers—but the meaning behind them stays invisible. Charts may look appealing, yet they rarely answer questions like “What’s the trend?” or “Which category performs best?”
Copying data into spreadsheets or separate AI tools breaks focus. We wanted a way to understand data instantly, right where it lives—without switching tabs or uploading files. That idea became DataGlance: your on-page AI data analyst.
What It Does
DataGlance transforms static web data into an interactive, AI-powered workspace. It runs entirely on your device, using Chrome’s built-in Gemini Nano model for natural language and vision-based reasoning.
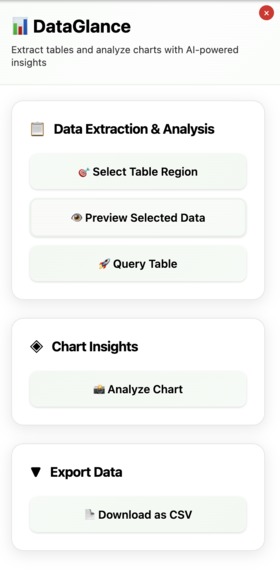
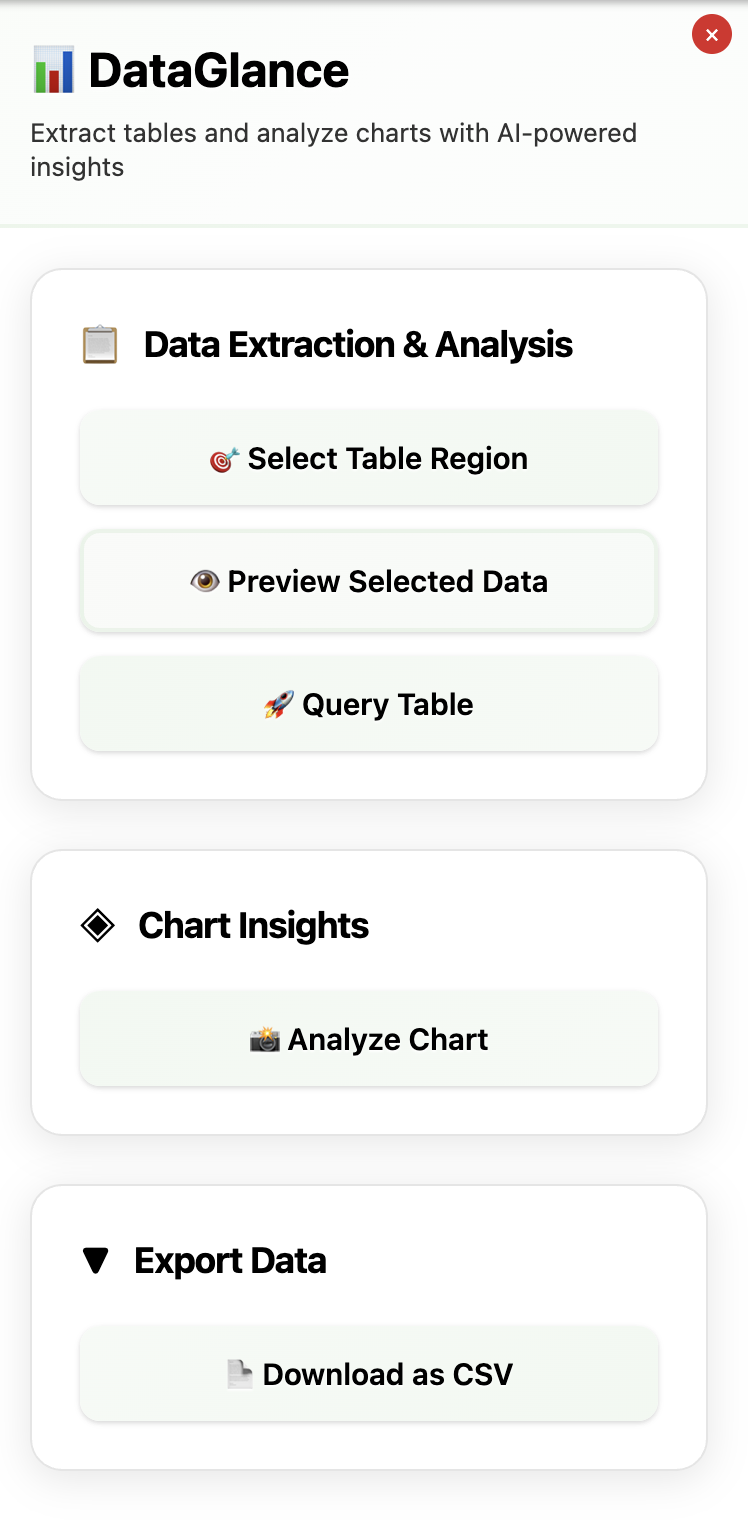
1. Smart Table Extraction
Select any table on a webpage using an intuitive rectangle selection tool. The extension automatically detects and parses structured data, even from complex or nested HTML tables.
2. AI-Powered Metadata Generation
Once extracted, DataGlance uses the Prompt API to infer column descriptions, data types, and sample value summaries, building a rich metadata layer for every table. This allows downstream AI queries to understand both structure and semantics.
3. Natural Language Queries
Ask questions directly in plain English—no SQL required. Queries like “Which month had the highest sales?” are translated into executable SQL via the Prompt API, using contextual metadata. Results are processed locally using SQL.js, with no data leaving the browser.
4. AI Chart Visualization
After querying, DataGlance automatically determines the best visualization type—bar, line, pie, or scatter—based on your result structure. Charts are rendered using Chart.js, with AI selecting formats optimized for interpretability.
5. Chart Insights with Vision AI
Using Chrome’s Multimodal Prompt API, you can analyze any chart or graph on a webpage. DataGlance captures the chart image and prompts the on-device model to extract insights such as trends, anomalies, and comparisons. Outputs include structured summaries, bullet-point analyses, and high-level takeaways.
6. CSV Export
Download your extracted or transformed data instantly as a CSV file for offline use or further analysis. All export operations are handled locally for full privacy and speed.
How We Built It
- Chrome Extension Framework: JavaScript content scripts interact directly with webpage DOMs.
- AI Integration: Chrome’s on-device (\text{LanguageModel}) powers metadata generation, SQL reasoning, and chart insights.
- In-Browser Query Engine: SQL.js executes SQL operations in WebAssembly.
- Visualization Layer: Chart.js dynamically renders AI-selected chart types.
- UI Design: Vanilla JavaScript and modern CSS power a responsive sidebar with smooth animations and resize logic: $$ \text{newWidth} = \text{windowWidth} - \text{mouseX} $$
Challenges We Faced
- AI setup – Enabling Chrome’s Prompt API and downloading the on-device model (~2 GB)
- Dynamic layouts – Building a sidebar that resizes gracefully without breaking webpage structure
- Complex table parsing – Adapting to inconsistent HTML table hierarchies
- Vision analysis – Capturing and encoding screenshots reliably for multimodal reasoning
Each challenge deepened our understanding of Chrome’s evolving AI capabilities and the design trade-offs of fully local execution.
Accomplishments We’re Proud Of
- Built a fully local AI data analysis workflow with zero external APIs
- Designed a smooth, resizable sidebar that integrates seamlessly with any website
- Enabled natural-language-to-SQL querying directly in-browser
- Delivered vision-based chart analysis using multimodal AI
- Ensured complete user privacy through on-device processing
What We Learned
- Chrome’s emerging AI APIs can power complete, on-device data intelligence systems
- Browser extensions can now rival desktop applications in capability
- Real-time DOM handling requires precise event and layout management
- Users prefer intelligence integrated directly into their browsing experience, not hidden behind separate tools
What’s Next for DataGlance
- Smarter AI reasoning – Handle multi-step analytical questions and derived insights
- Expanded format support – Extract from PDFs, images, and embedded dashboards
- Collaboration features – Share insights or visualizations directly
- Automatic detection – Identify and highlight extractable tables without manual selection
Built With
- api
- browser
- canvas
- chart.js
- chromeextension
- css3
- file
- html2canvas
- html5
- javascript
- languagemodel
- languagemodelapi
- sql.js
- webassembly


Log in or sign up for Devpost to join the conversation.