-
-
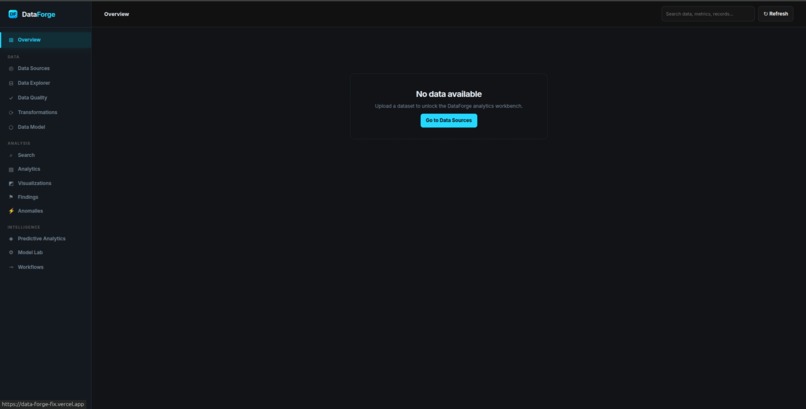
Landing Page
-
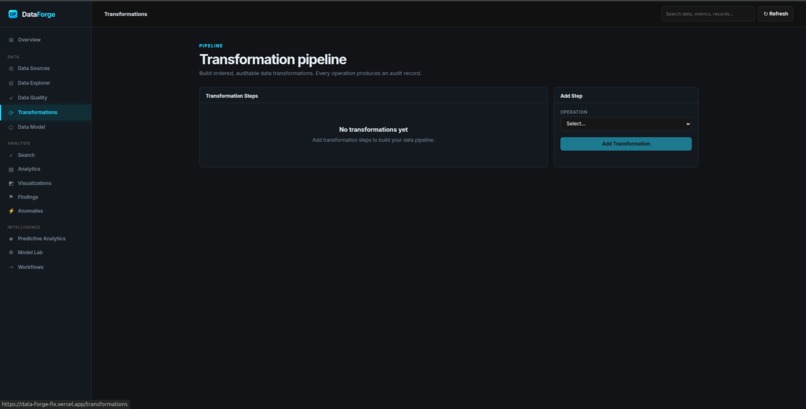
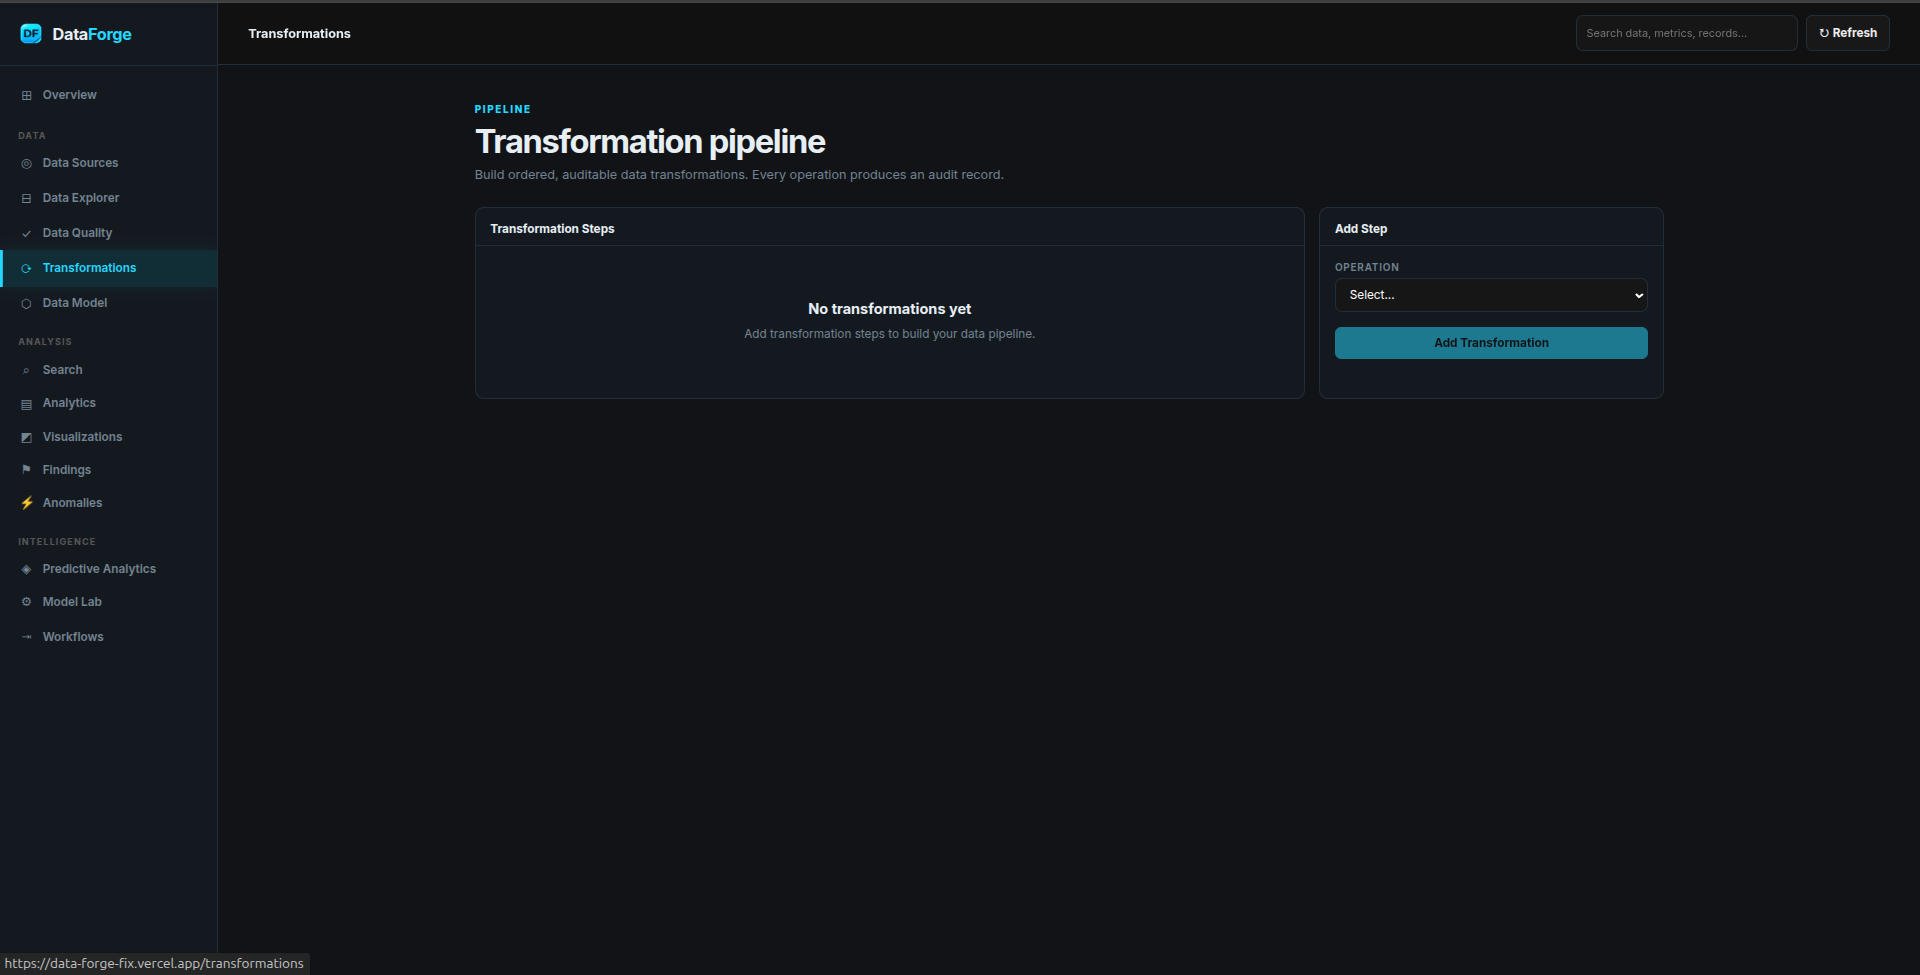
Transformation Tab for data transformation
-
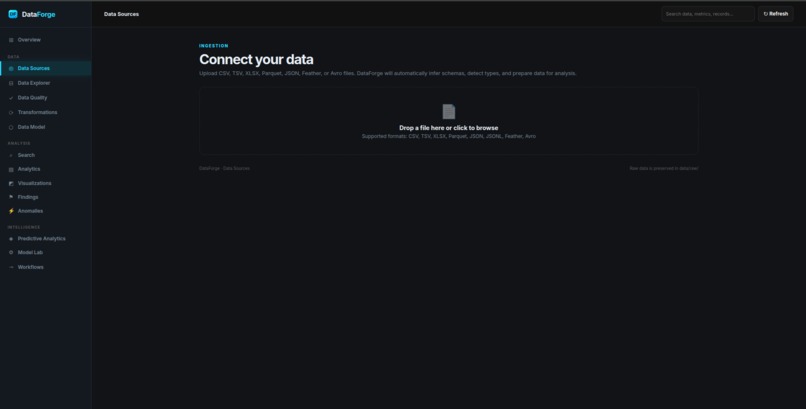
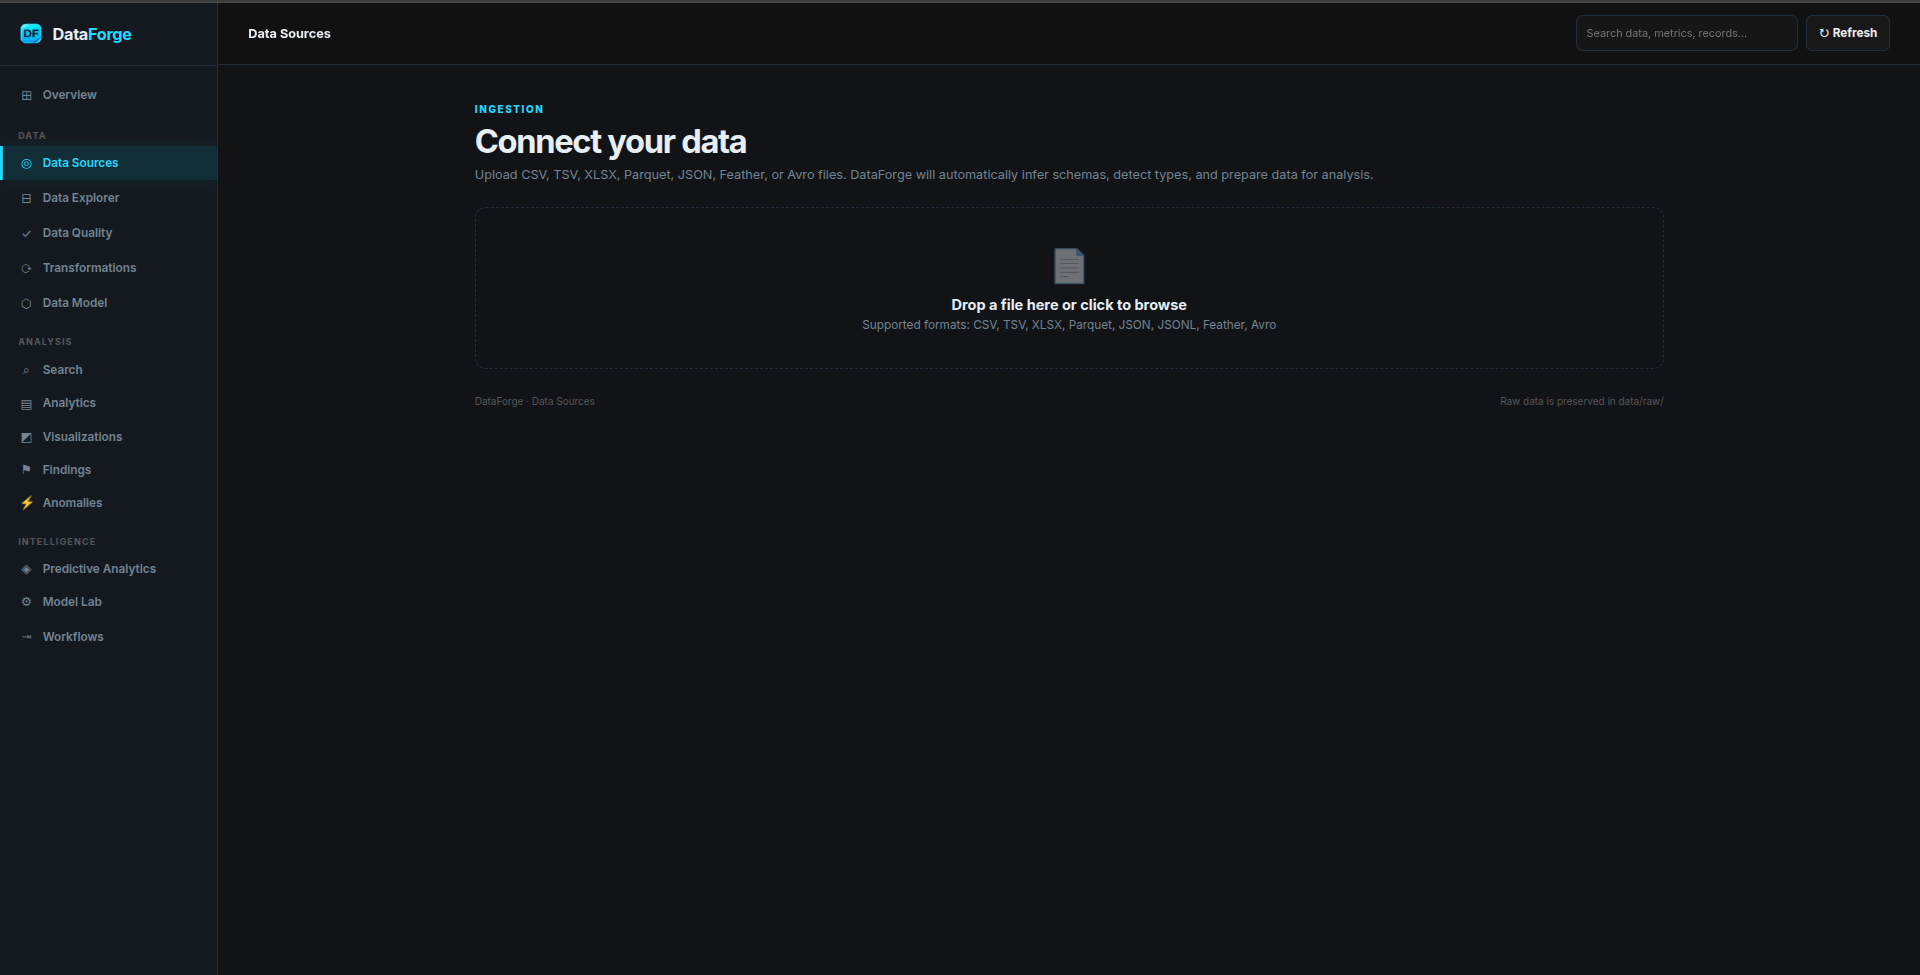
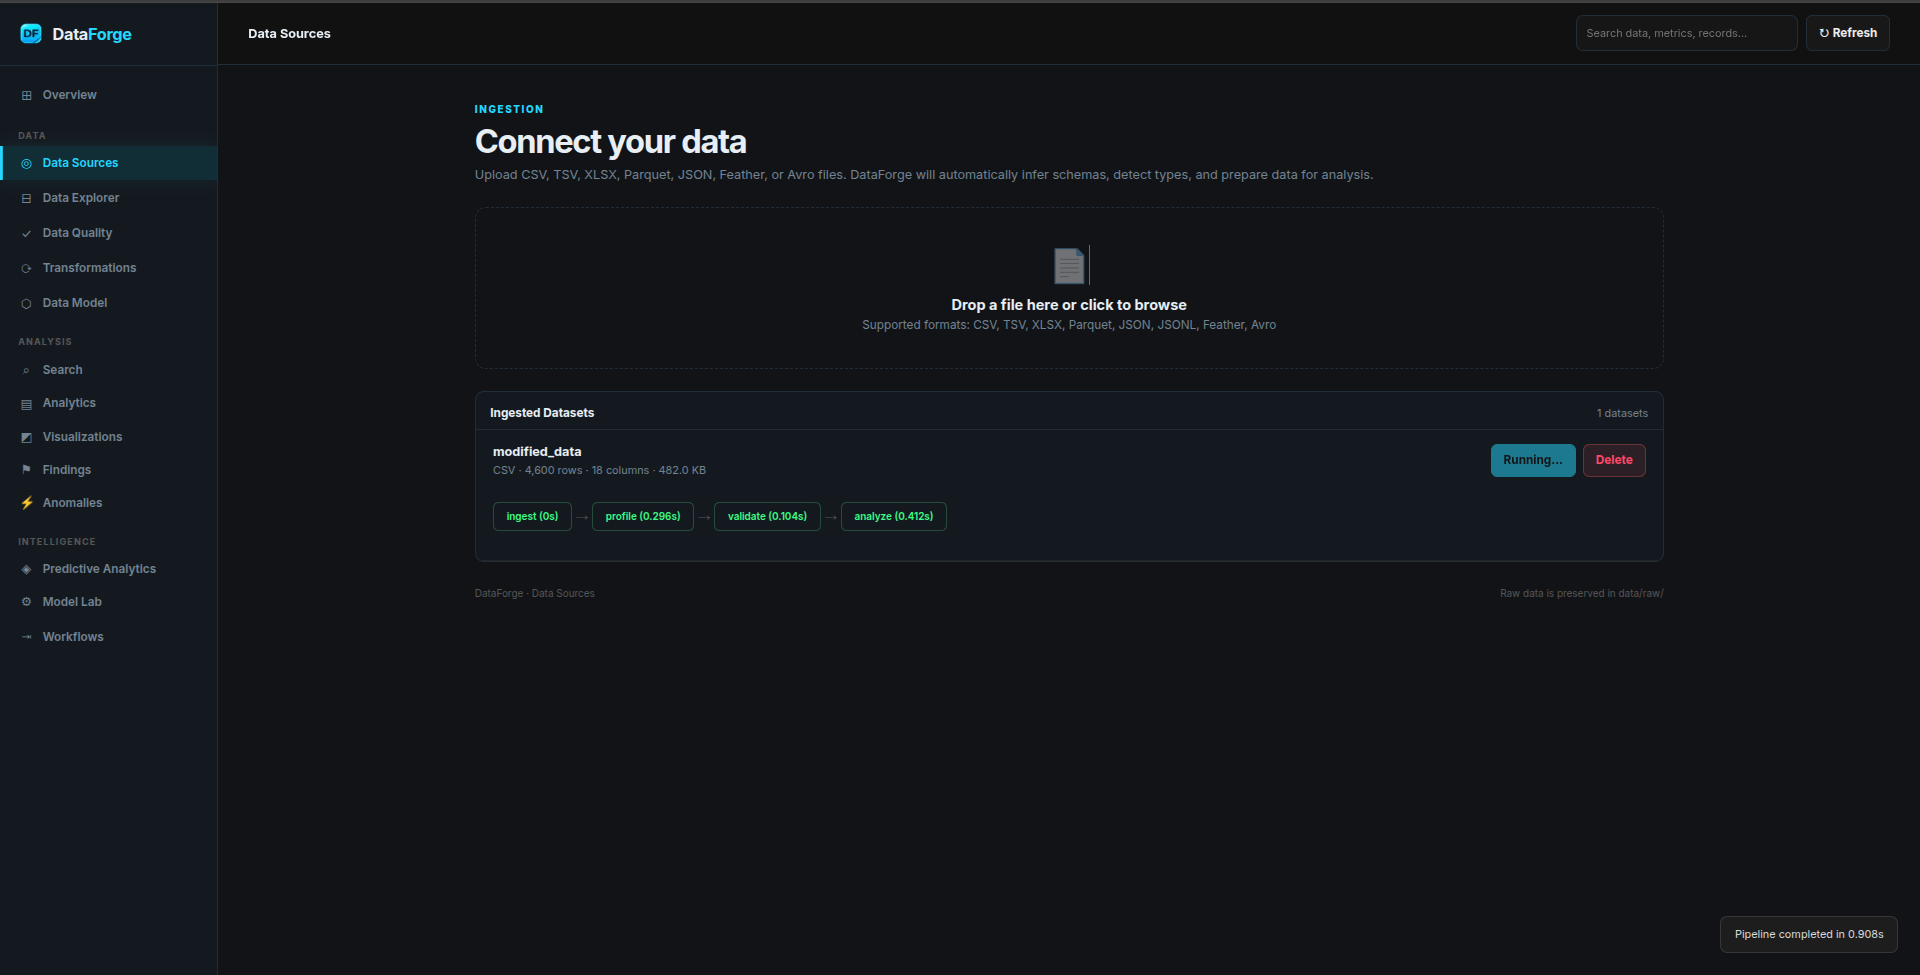
Add dataset here
-
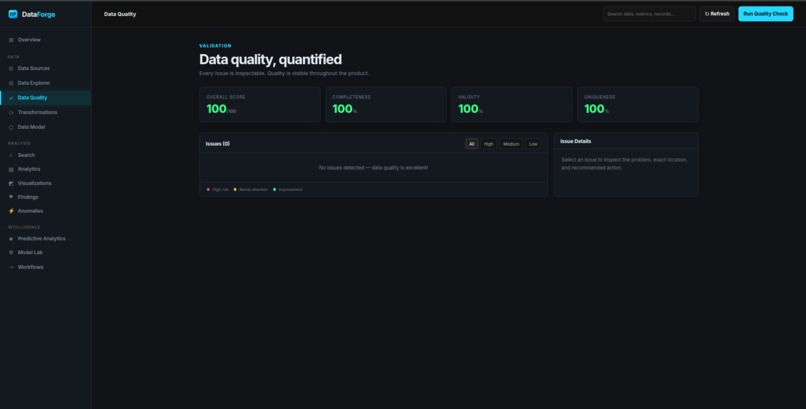
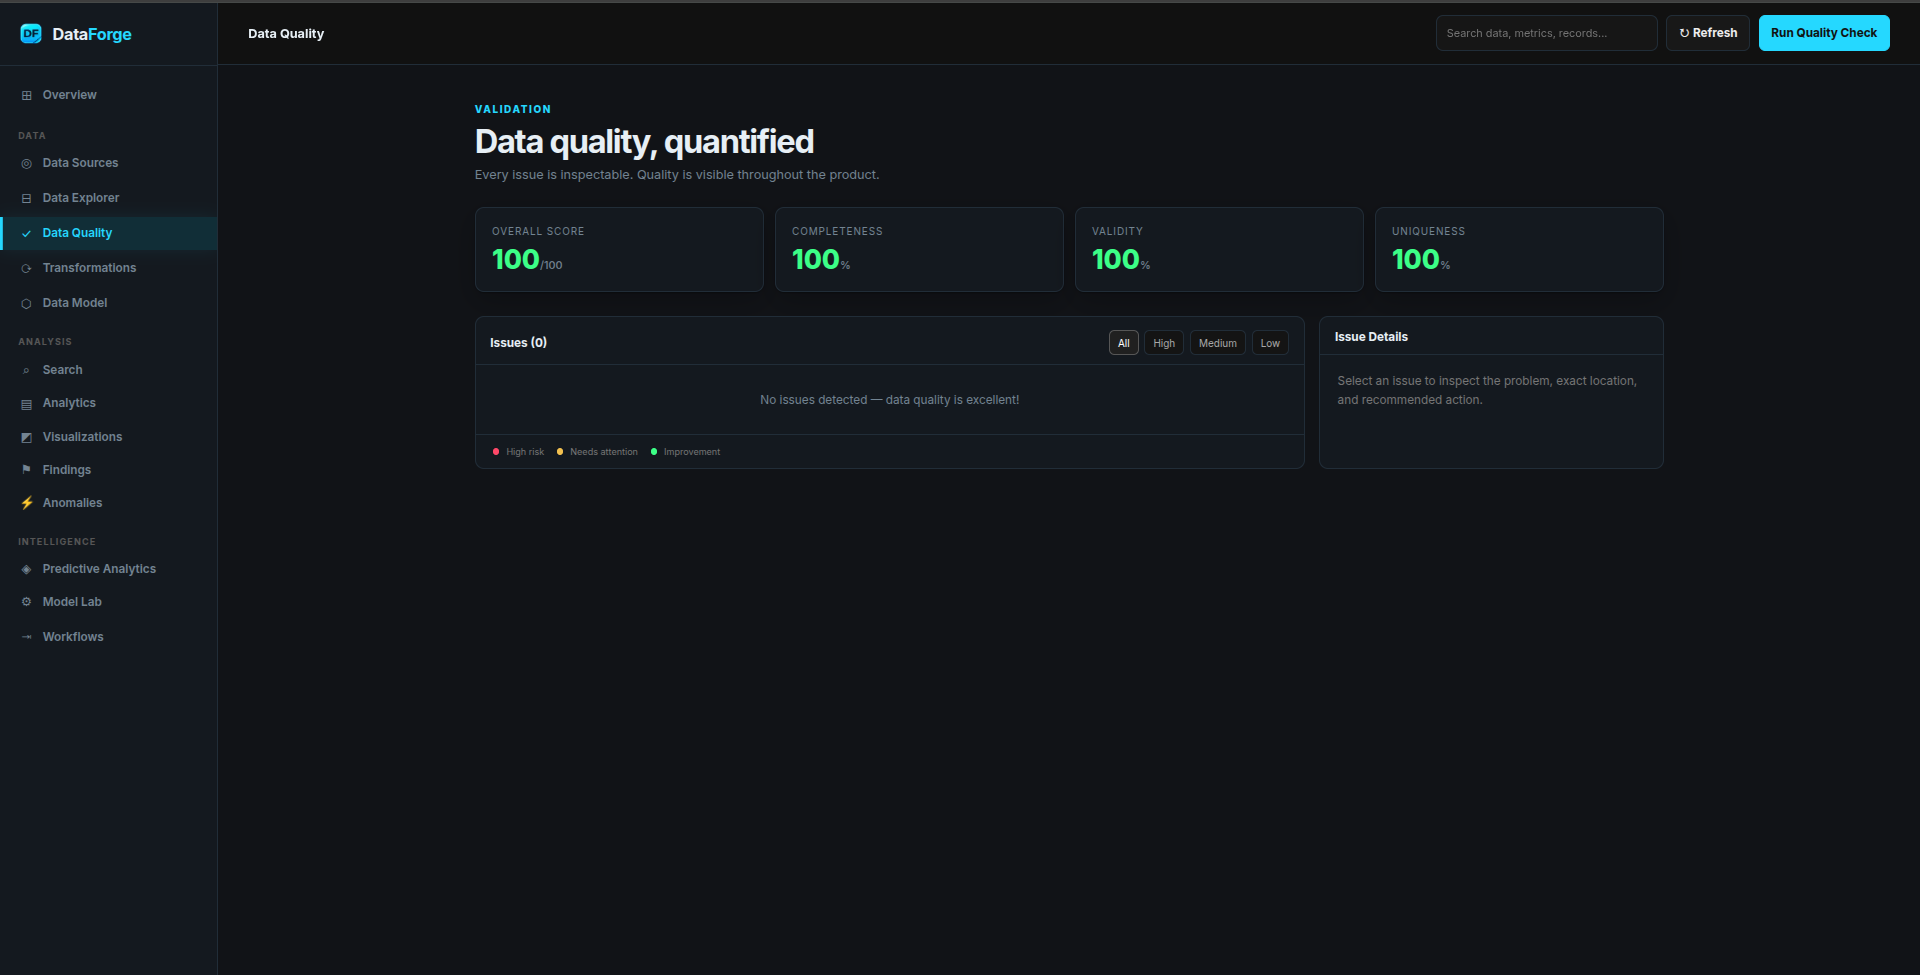
Data Quality Inspection
-
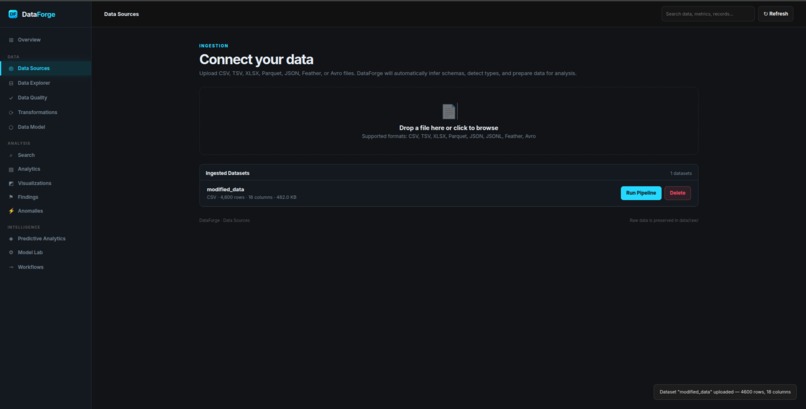
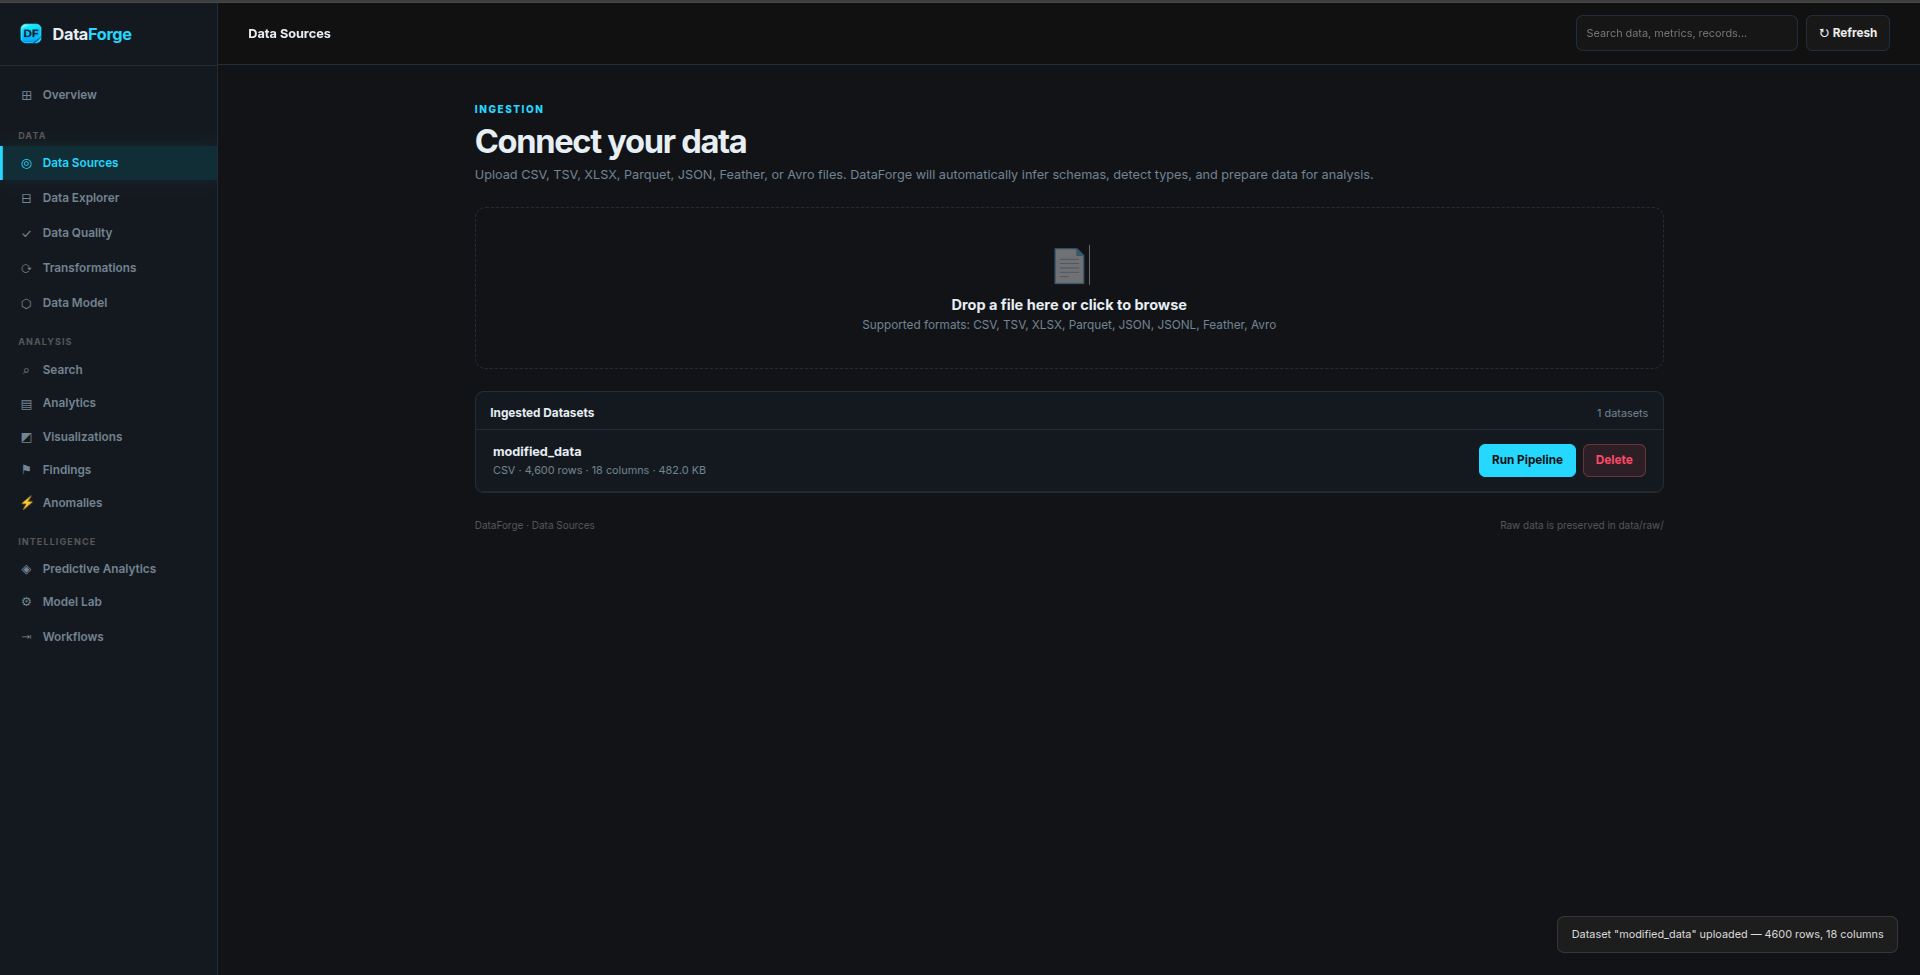
Added dataset
-
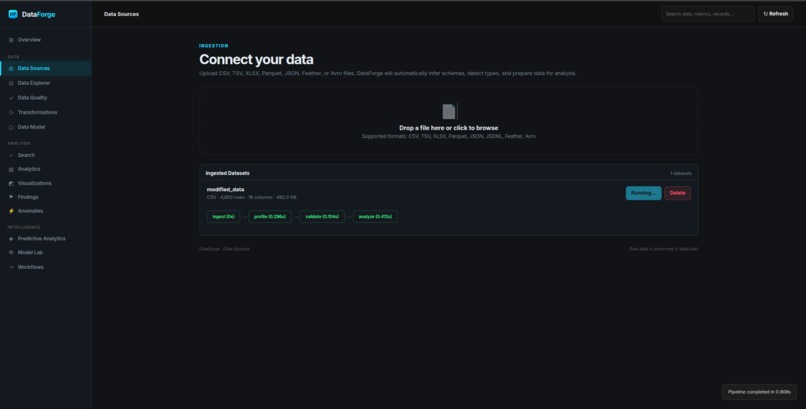
Ran the pipeline
-
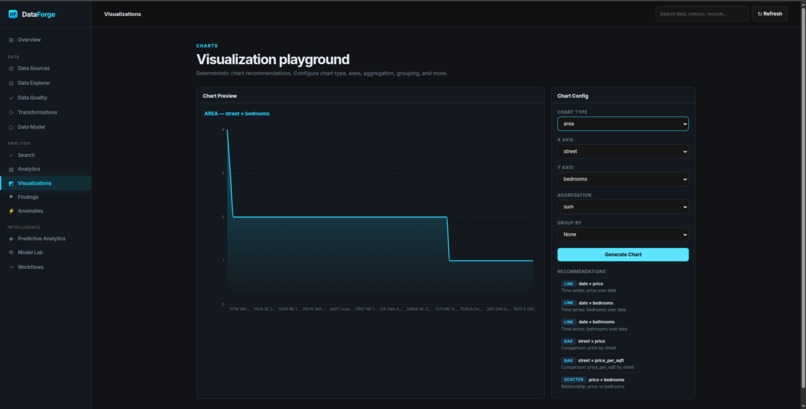
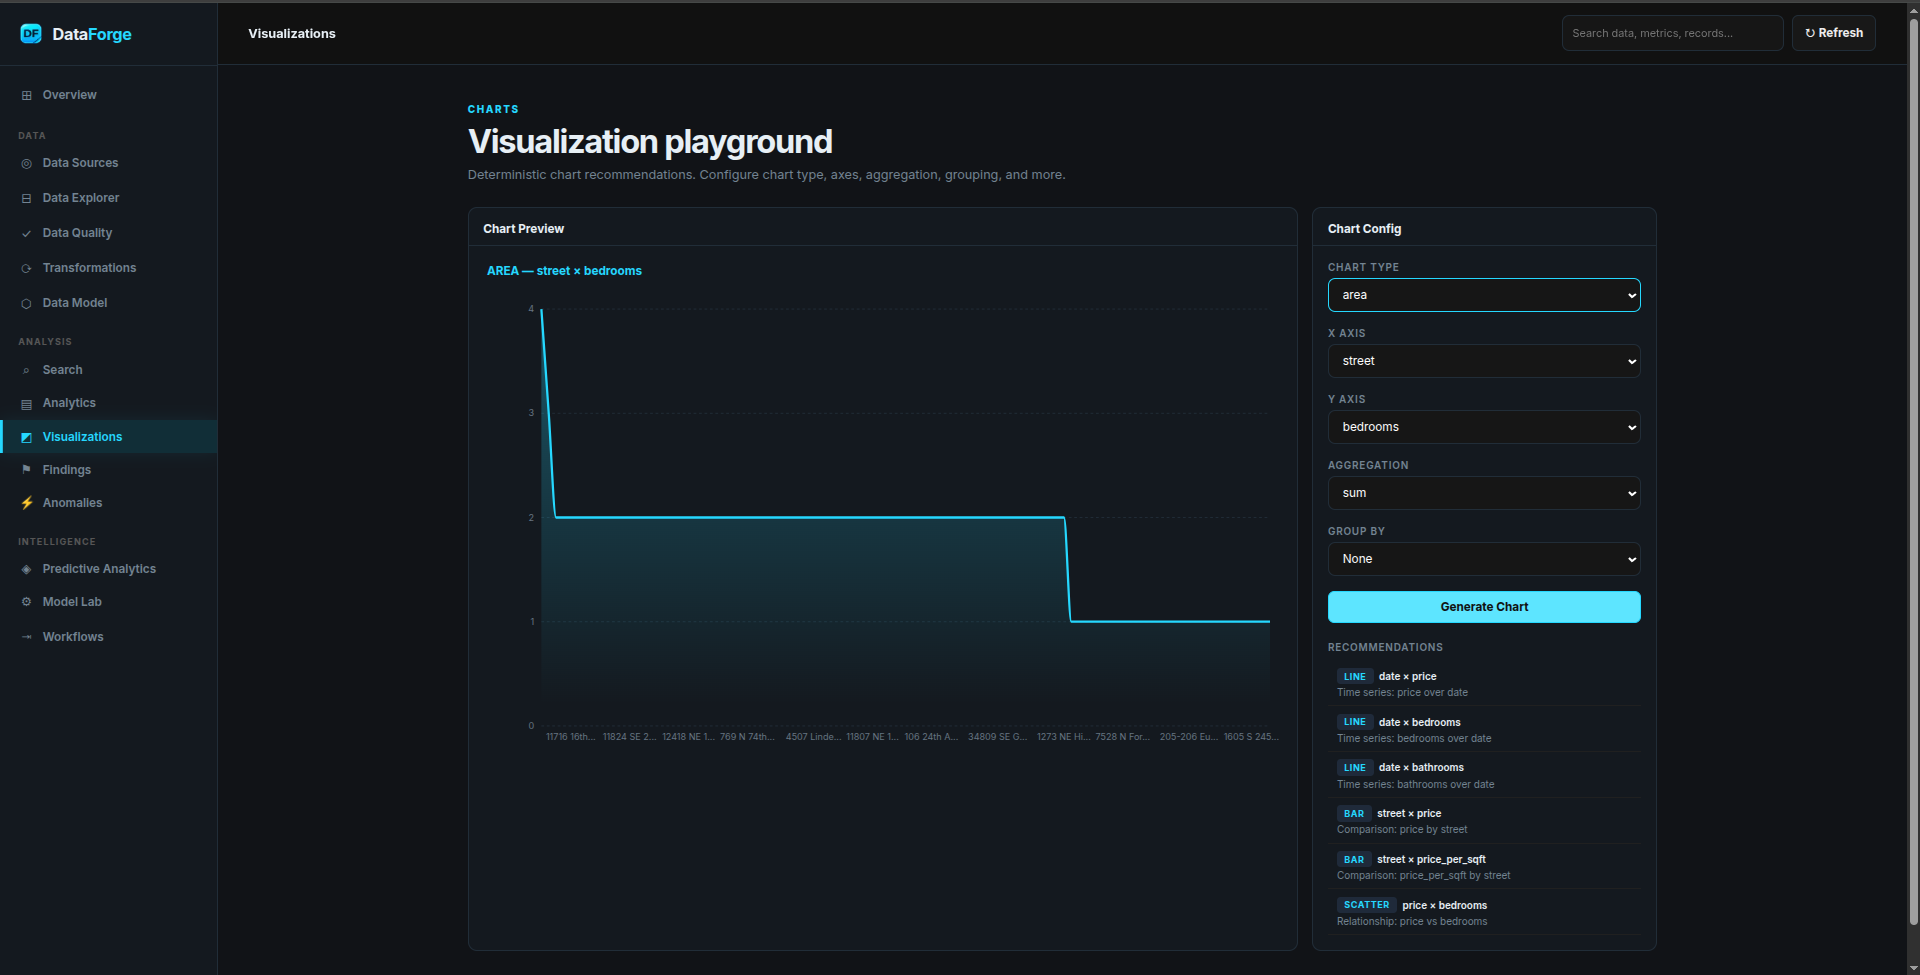
Different method of data visualization(Area)
-
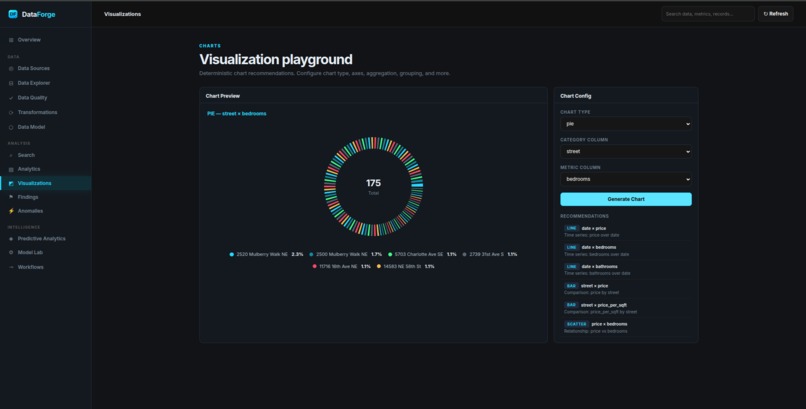
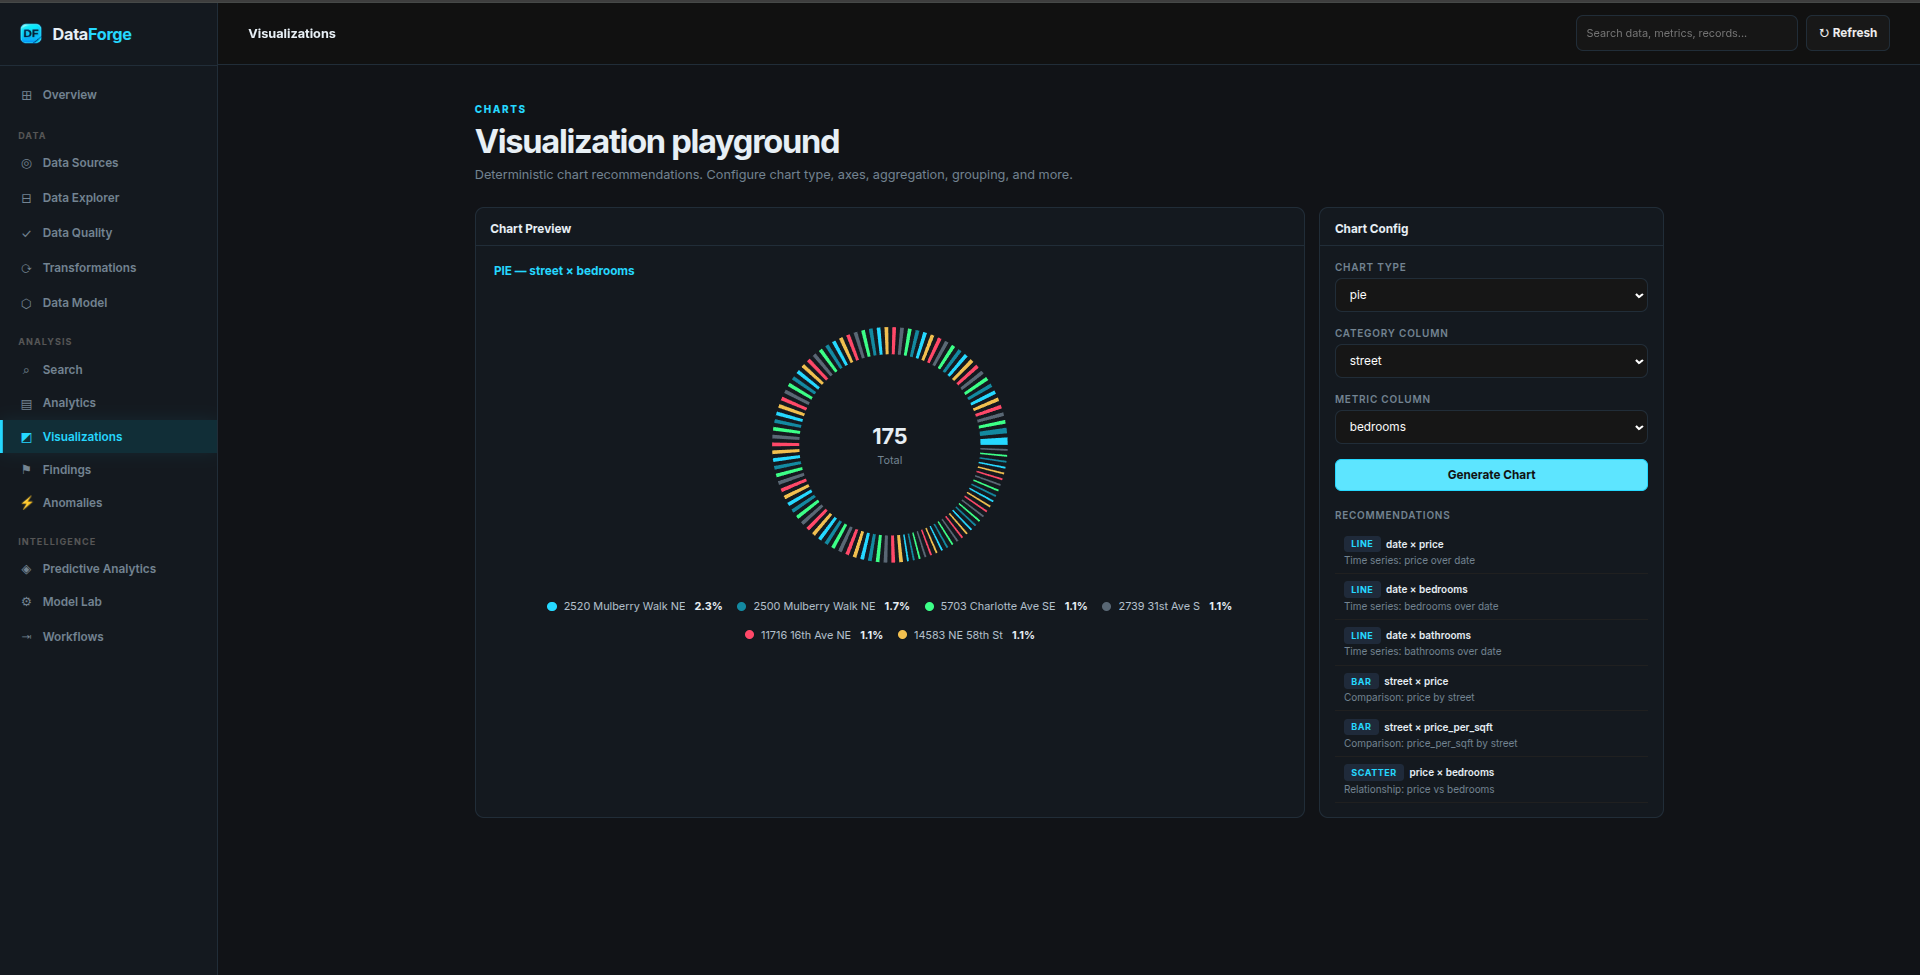
Different method of data visualization(Pie)
-
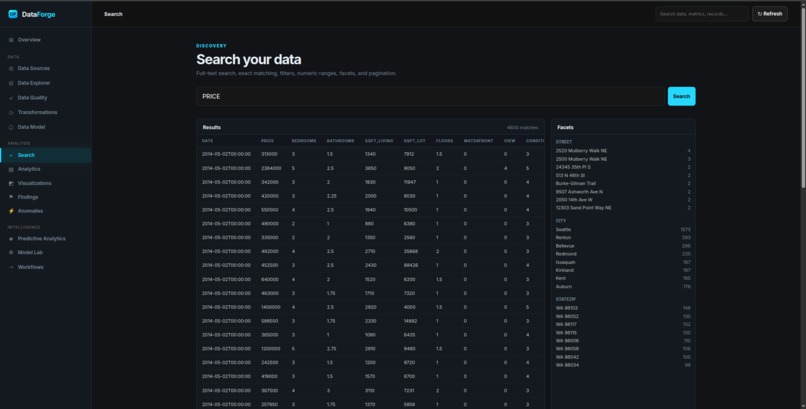
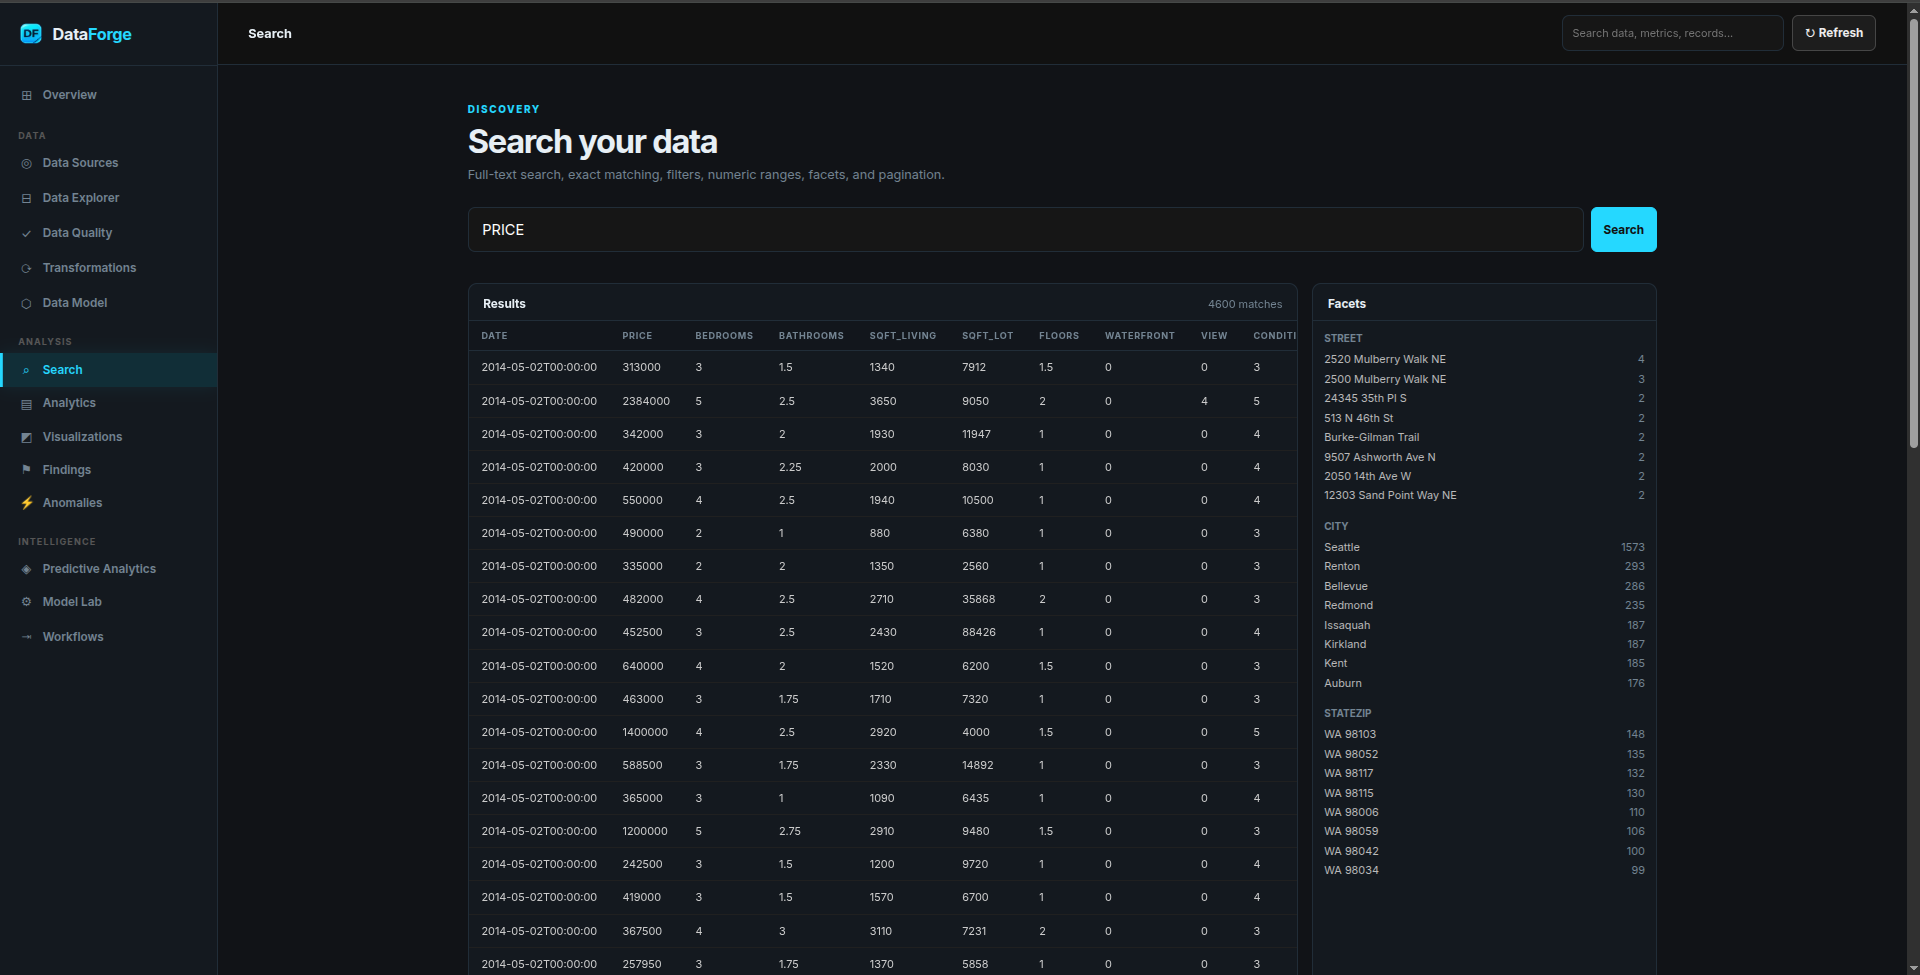
Search dataset
-
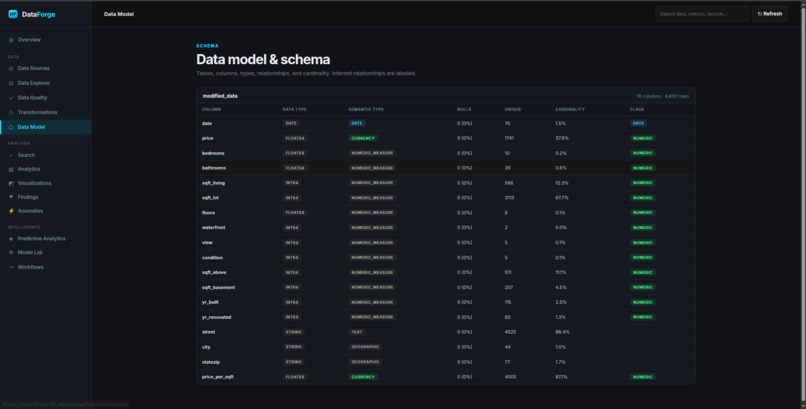
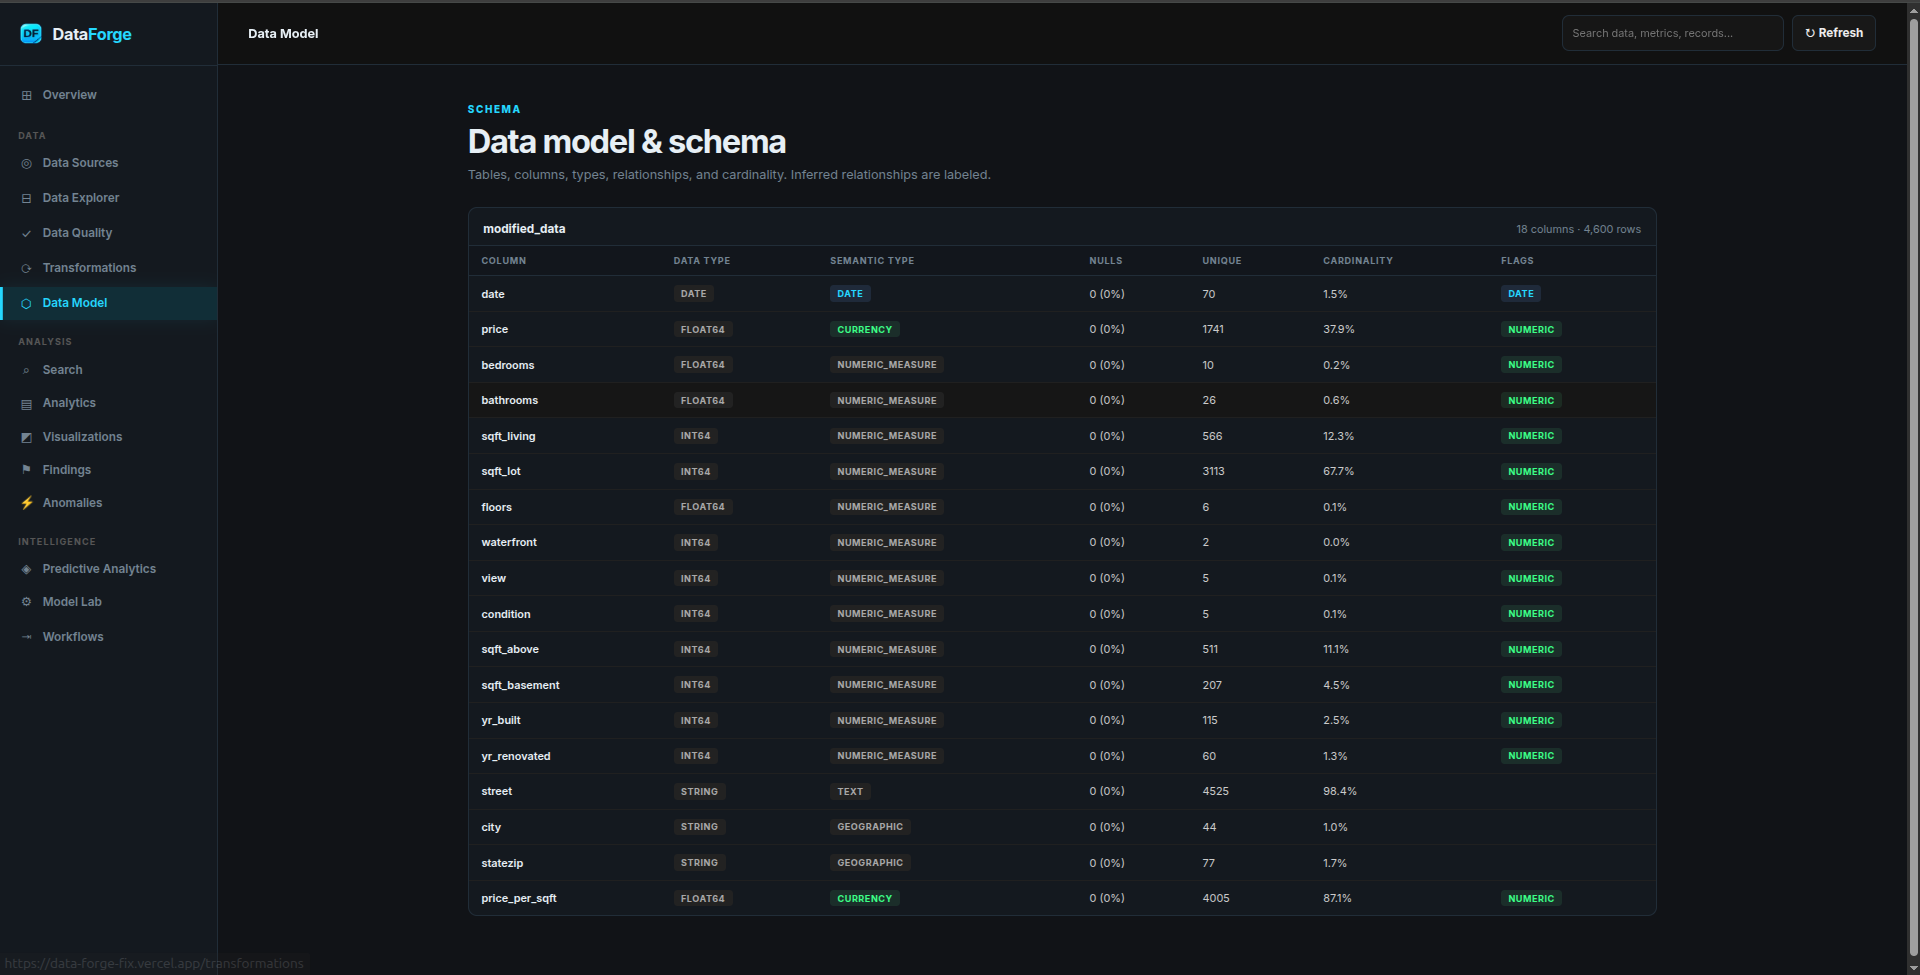
Data Schema and Model detailing tab
-
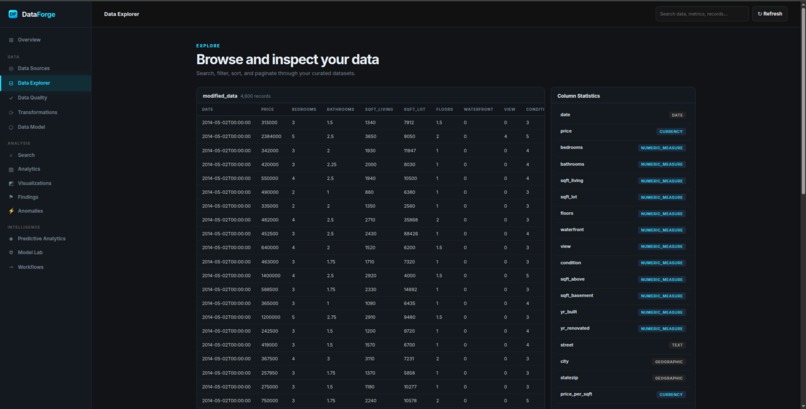
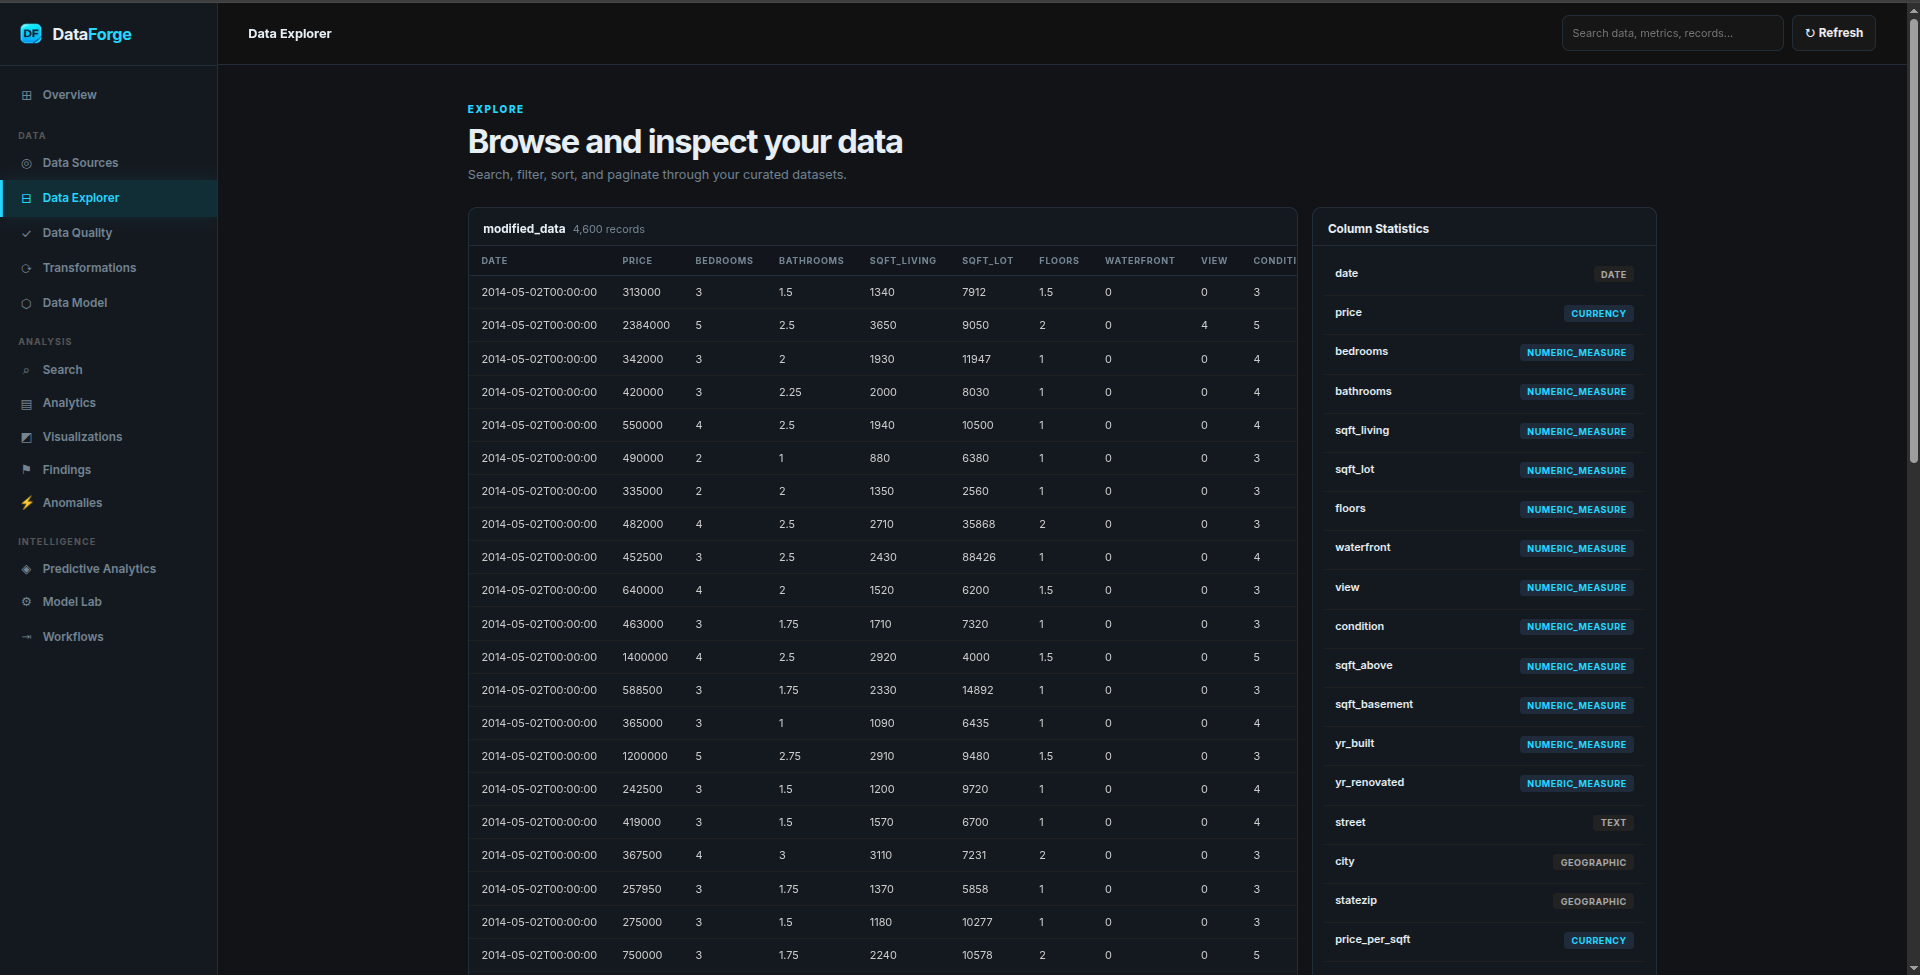
DataExplorer Tab
-

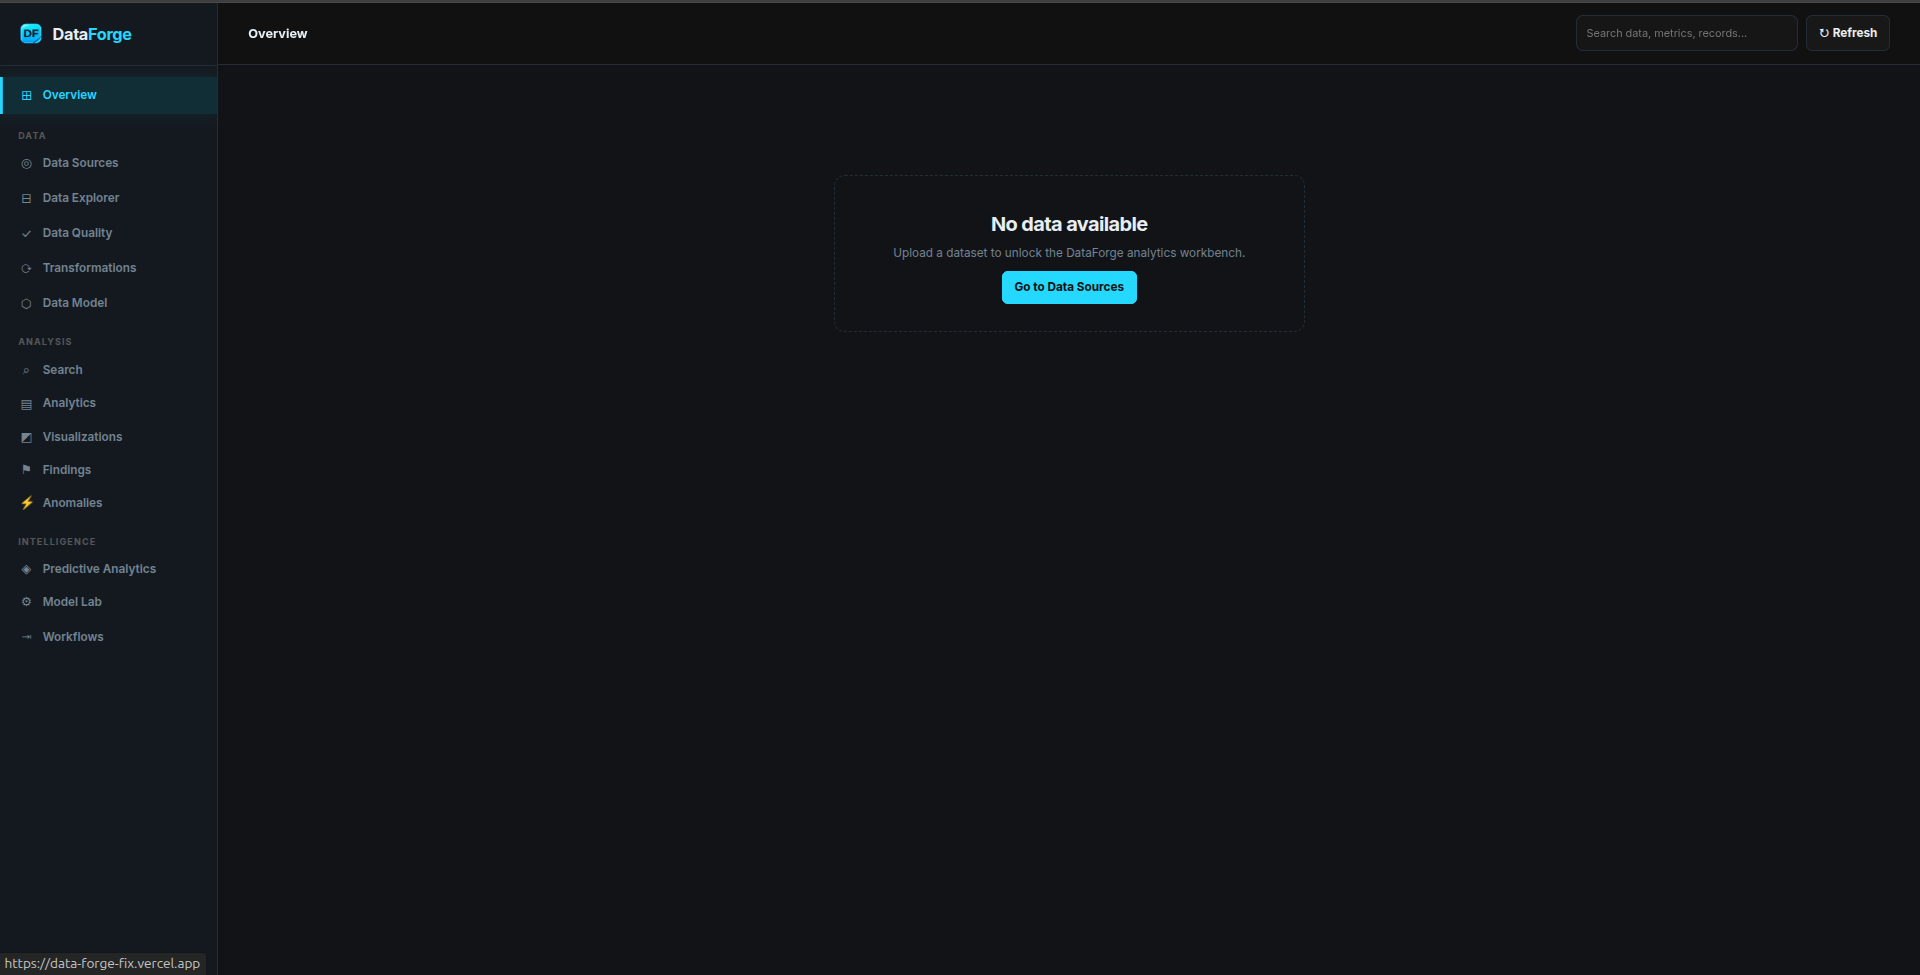
Loading screen

Inspiration
Data analysis often involves switching between multiple tools just to answer a simple question—opening a dataset, cleaning it, writing queries, filtering records, generating statistics, and finally creating visualizations.
We wanted to reduce that friction.
DataForge was inspired by the idea of creating a single environment where users can take raw data and progressively turn it into meaningful insights. The name represents this concept: raw data is the material, and DataForge is the forge that transforms it into something useful.
We also wanted to make the platform flexible enough to work with different kinds of data files. While we are continuously improving file compatibility, CSV is currently the preferred format for testing and demonstrating the project because of its structured and reliable nature.
What it does
DataForge is a data exploration and analysis platform that helps users go from raw datasets to useful insights.
It provides capabilities for:
- 📂 Importing datasets from supported file formats
- 📊 Exploring dataset structure, columns, data types, and statistics
- 🧹 Identifying data-quality issues such as missing and duplicate values
- 🔎 Filtering, searching, sorting, grouping, and limiting data
- 🔗 Performing joins and matching between datasets
- 📈 Analyzing and visualizing results
- 💡 Turning complex datasets into information that is easier to understand
The platform is designed as an evolving system, with additional file-format support and analytical capabilities being actively improved.
For the current hackathon build, CSV files are recommended for testing.
How we built it
We designed DataForge as a modular data-analysis workflow rather than a collection of disconnected features.
The general pipeline is:
[ \text{Import} \rightarrow \text{Explore} \rightarrow \text{Clean} \rightarrow \text{Analyze} \rightarrow \text{Visualize} \rightarrow \text{Insight} ]
We separated the system into different responsibilities so that data ingestion, processing, analysis, visualization, and the user interface can evolve independently.
We focused on making common data operations accessible through the interface instead of requiring users to manually build an analysis pipeline for every dataset.
We also designed the project with future file-format expansion in mind. CSV is currently our most reliable testing format, but the architecture is being improved to support additional formats.
Challenges we ran into
Handling different datasets
Not every dataset follows the same structure. Columns, data types, missing values, formatting, and overall quality can vary significantly.
Making the system flexible enough to handle these differences was one of our biggest challenges.
Data quality
Real-world data is messy.
Missing values, duplicates, inconsistent types, and unexpected values can easily affect analytical results. We had to make data validation and cleaning an important part of the workflow.
Making complex analysis simple
Operations such as joins, grouping, aggregation, filtering, and matching are powerful, but exposing all of them without overwhelming the user required careful design.
Connecting analysis and visualization
A correct result is not necessarily an understandable result. We had to consider how analytical outputs could be presented visually so users could recognize patterns and trends more easily.
Hackathon time constraints
There were many features we wanted to build, but we had to prioritize the functionality that demonstrated the core idea of DataForge while keeping the project stable.
Accomplishments that we're proud of
We are proud that DataForge brings multiple stages of the data-analysis workflow into one platform.
Instead of treating importing, cleaning, querying, analysis, and visualization as completely separate tasks, we created a foundation where they can work together.
We are particularly proud of:
- Building an end-to-end data-analysis workflow
- Supporting practical operations such as filtering, sorting, grouping, joins, and aggregation
- Creating an interface focused on making data exploration easier
- Designing the project to evolve toward broader file-format support
- Building something that can work with real datasets rather than only predefined examples
Most importantly, we have a working foundation that we can continue improving rather than a collection of isolated demonstrations.
What we learned
Building DataForge taught us that data analysis is not just about running queries.
We learned about:
- Data validation and cleaning
- Handling inconsistent datasets
- Designing reusable analysis operations
- Data visualization
- Structuring modular applications
- Designing interfaces around real user workflows
- Balancing flexibility with simplicity
- Prioritizing features under time constraints
One of our biggest takeaways was that the quality of the insight depends heavily on the quality and understanding of the underlying data.
We also learned that making a powerful tool easy to use can be more challenging than simply implementing the underlying functionality.
What's next for DataForge
The current hackathon version is only the foundation.
Our next priorities include:
- 🌐 Broader file-format support
- 🤖 AI-powered natural-language data queries
- 🔍 Automatic anomaly detection
- 🧹 Smarter automated data cleaning
- 📊 Automatic visualization recommendations
- 💬 Natural-language explanations of analytical results
- 📈 Advanced statistical and predictive analysis
- 🗄️ Direct database connectors
- ⚡ Better performance for larger datasets
- 📑 Automated report generation
Our long-term vision is for a user to upload a dataset and simply ask:
“What are the most important patterns in this data?”
DataForge should be able to perform the analysis, create the appropriate visualizations, and explain the findings in understandable language.
The goal is to move DataForge from a data-analysis tool toward an intelligent data-analysis workspace—where users spend less time manipulating data and more time understanding it.


Log in or sign up for Devpost to join the conversation.