-
-
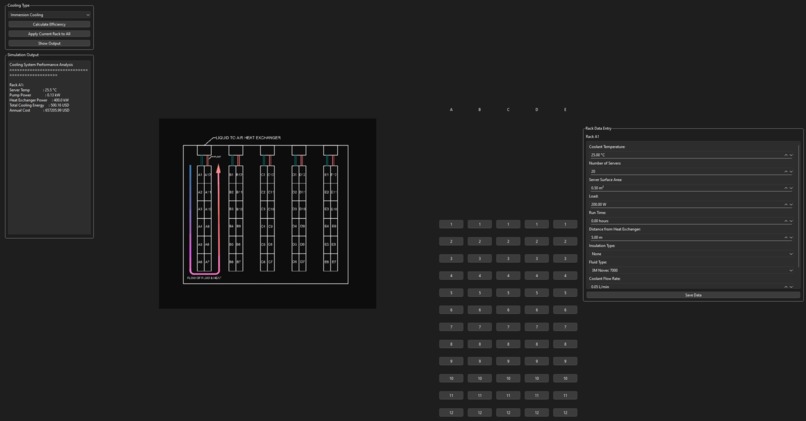
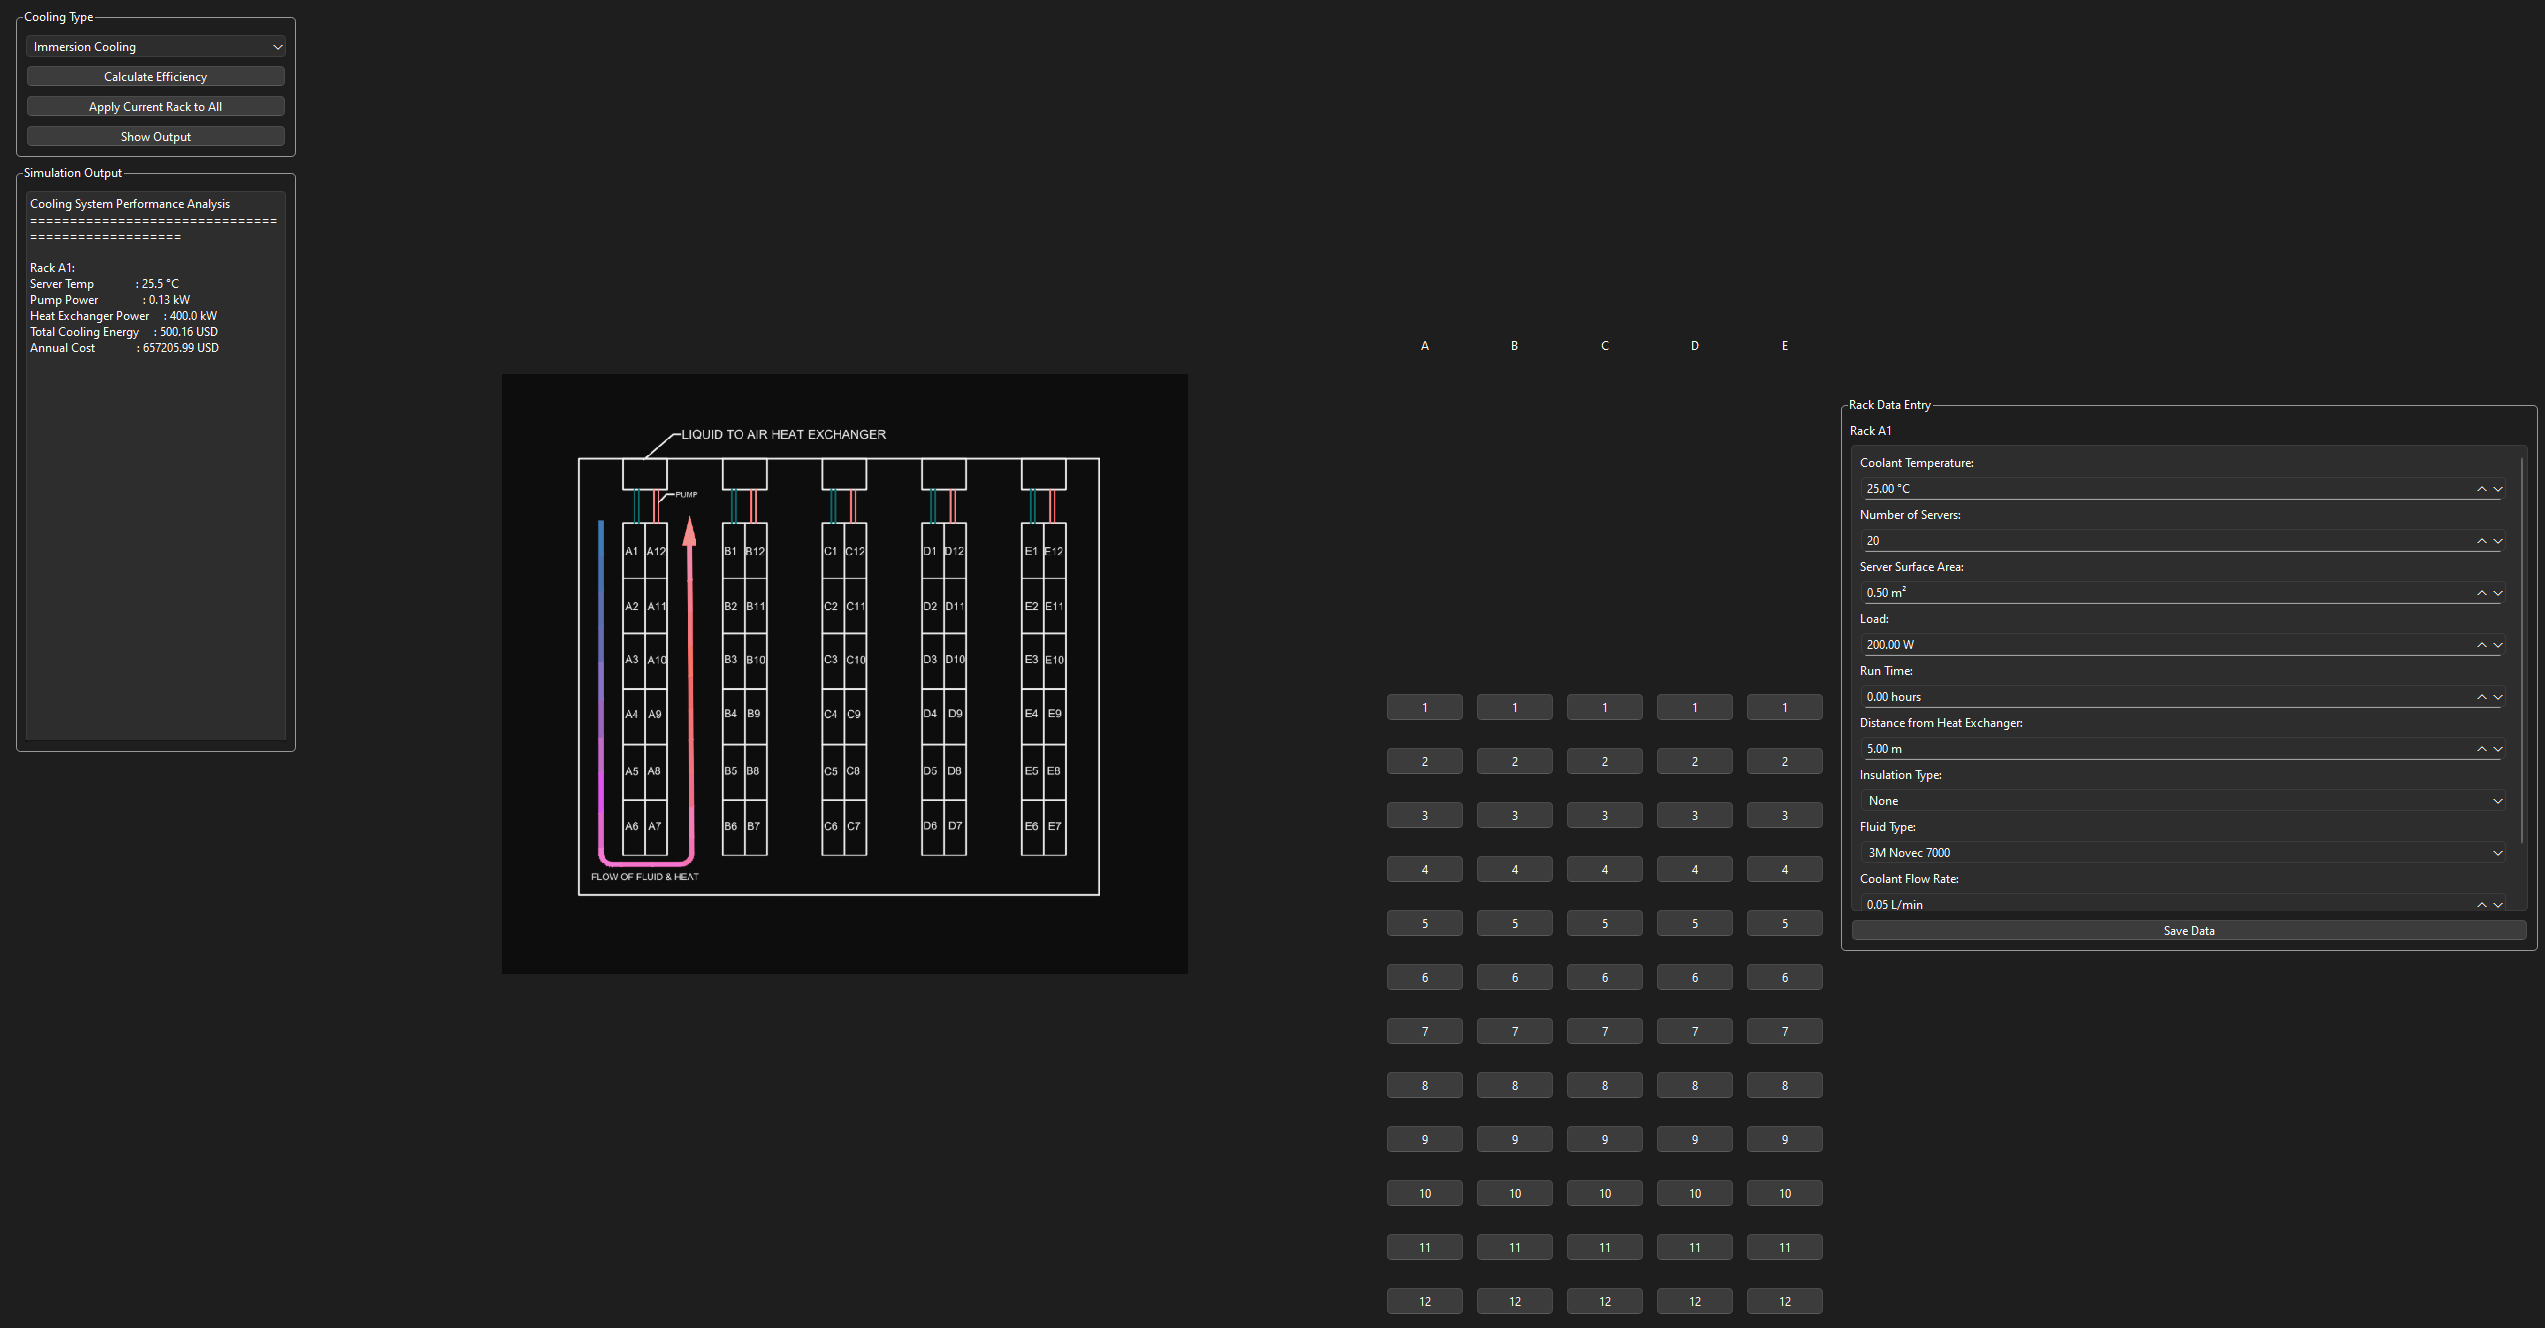
Screenshot of GUI, built in PyQT. Includes an input pane for parameters of server racks and an output pane of power/heat characteristics.
-
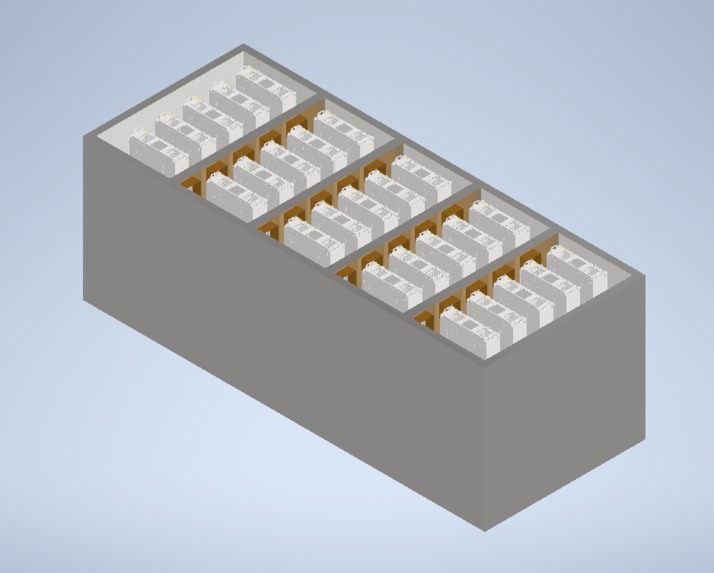
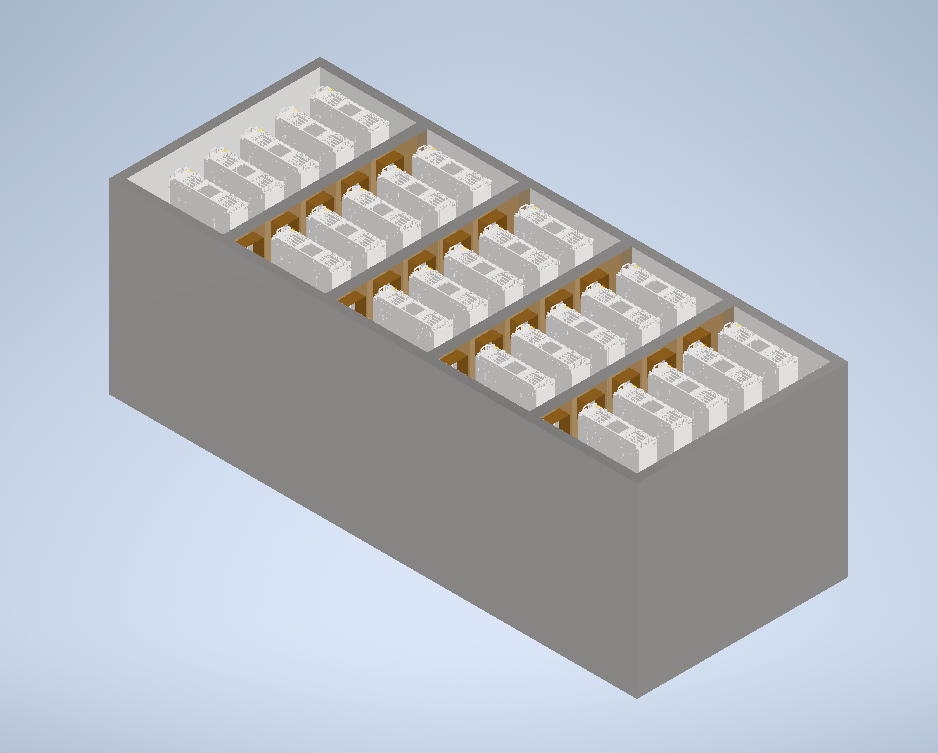
A 3D Model of the Immersive Cooled Server Rack
Inspiration
Data centers are an integral part of the Northern Virginia economy. With over 700 million dollars in property tax revenue alone, data centers contributed 31.4 billion dollars of economic output in 2023. Yet, with more and more centers being built on what was once a staple of Virginian nature, it raises the question of data centers' effects on our climate. We sought out to find a way to make data centers more sustainable and efficient, and make it easy for owners to make this switch into the future.
What it does
DataCoolSim works by creating a simulator of a data center's thermal and energy efficiency by modeling the effectiveness of a cooling system on individual server racks. The calculations find the temperature of a server in the rack after the cooling has been applied. It prompts the user to enter specific data for each rack, provides them the option to set a standard for multiple racks for ease of use, and allows them to calculate thermal efficiency. Along with thermal efficiency, it shows the energy usage of parts of the system, the total energy use, and the annual cost of running this system, providing owners with the insight of how they can scale an implementation of immersion cooling.
How we built it
We built DataCoolSim entirely with Python and made visuals using AutoCAD and Inventor. The UI was coded with PyQT, a GUI framework, and the maps of server racks was drawn on AutoCAD. To make the calculation model, we first created an equation to relate all the variables for each cooling method, then turned it into a callable function. Afterwards, we used the data from that function to calculate the other values, like cost and energy expenditure. The 3D model of an immersion-cooled rack was made on Inventor.
Challenges we ran into
We ran into two main challenges throughout the development process: developing/fitting PyQT for different screen sizes and developing the mathematical equations. PyQT was a challenge, as it was unlike any front-end frameworks or kits any of us have used, especially considering it made GUI through Python, so it came with a learning curve to create a usable product. Creating the equations to predict temperature was a challenge, as we had to learn about thermodynamics to understand how each parameter and variable interact with each other to change the final result and make our prediction accurate.
Accomplishments that we're proud of
We're especially proud of our straightforward UI and how it makes the process for data center owners simple. It makes it easy for them to interact with different parts of their centers and understand how their parameters affect the output. Additionally, we're proud of the accuracy of our math, as we were able to produce realistic numbers under a variety of different test conditions.
What we learned
We learned about how to use PyQT to create fully Python-based applications and how to make them universally applicable across different devices, as well as how to integrate function-calling and mathematics into these PyQT applications.
What's next for DataCoolSim
The next steps are to refine our model by testing it with real data and creating more detailed maps of data centers based on this advanced prediction model. We also hope to make a more advanced and modular simulation with color mapping as well as custom floorplan design.
Built With
- pyqt
- python

Log in or sign up for Devpost to join the conversation.