-

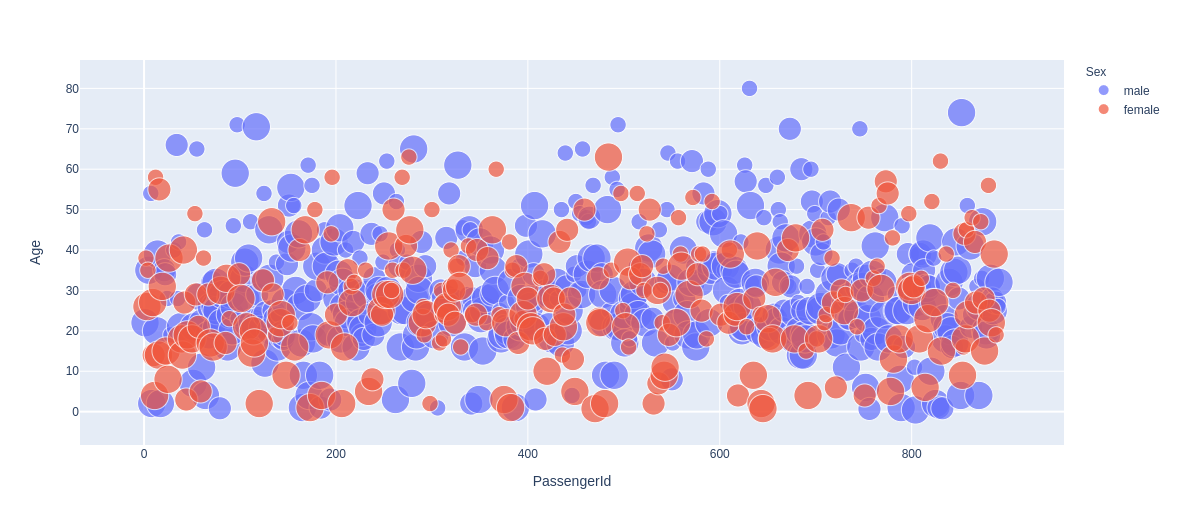
Total Passengers of TITANIC
-
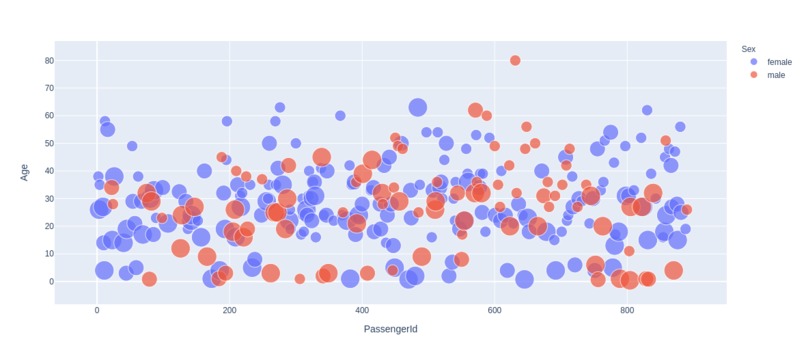
Survived Passengers of TITANIC

Inspiration
Daily simple hack to learn data_visualisation using PYTHON
What it does
Here we have visualised the data set of TITANIC in 2 different plots->
- First plot show the total passengers on the TITANIC with their age and passengerId
- Second plot show the same info of those who SURVIVED that day
How we built it
We will be using Pyhton libraries like Pandas and Plotly.
What we learned
Simple way to plot data on scatter plot(2D-plane)
Built With
- kaggle
- python
- titanic-dataset

Log in or sign up for Devpost to join the conversation.