-
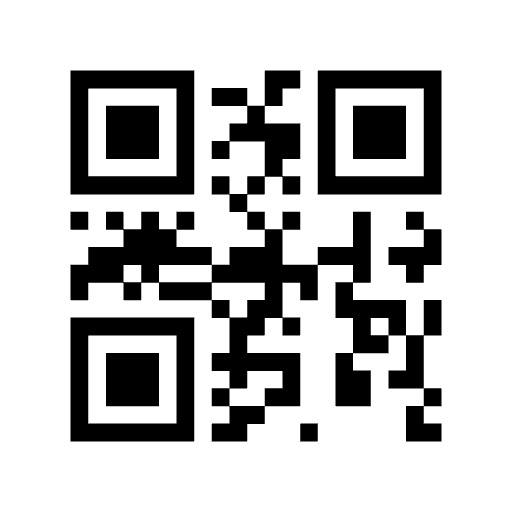
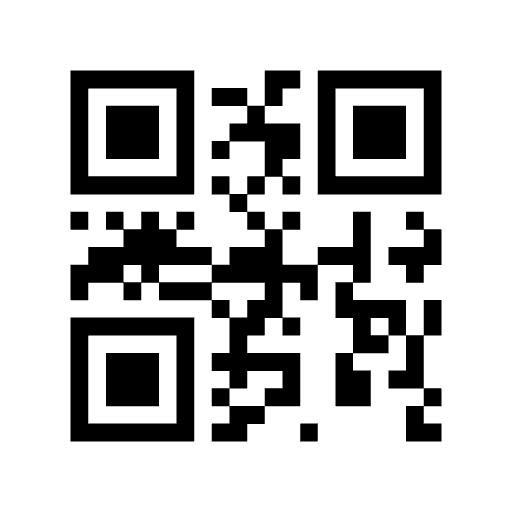
QR Code to AR Web App
Inspiration
Meta set out to create a virtual work environment. So far all still need to present their work only using static presentations.
Which disengages from a true XR experience. Remote & Virtual Reality work will only become more common as time passes.
What it does
Data3D creates an immersive environment for presenting data visualizations in hopes of targeting virtual workspaces.
How we built it
Our team first started by creating a Python library to create our 3D graph objects. (Python and Blender)
We then created an environment for those objects to be hosted and imported them into our AR environment. (8thwall Engine)
We then added front-end functionality to switch between various important and interesting statistics that represent data in our real world. (A-Frame.Js, JavaScript, HTML, CSS)
This was hosted on the 8thWall Cloud Hosting Service and registered under Data3D.Tech
Challenges we ran into
The 8thwall cloud engine requires working with very niche frameworks specially catered towards implementing 3D models. Blender is built for high-level creators and animators which makes the developer documentation very complex (even when working with geometric shapes). We also strive to publish our package on PyPI for all to use, however, the publication process provided some hurdles.
Accomplishments that we're proud of
We are proud to demonstrate our interest and passion in Data Science and AR. Also while having a completed submission.
What we learned
We tackled many popular languages and concepts and even niche concepts and frameworks. We were able to learn a ton throughout our building
What's next for Data3D
We plan to create even more creative charts, graphs, and data visualization in Augmented Reality

Log in or sign up for Devpost to join the conversation.