-
-
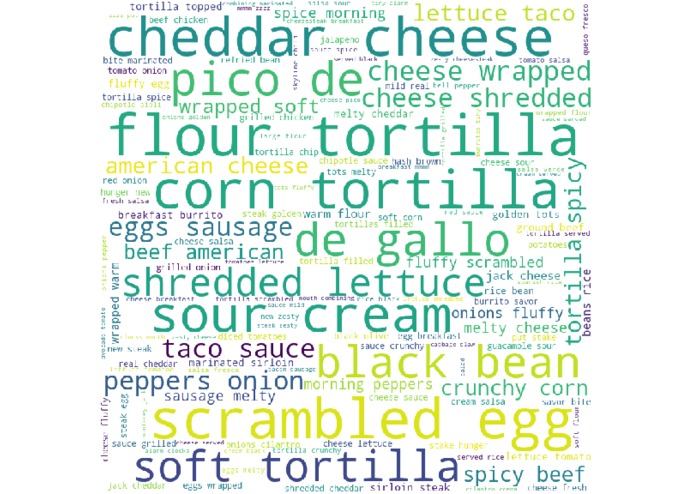
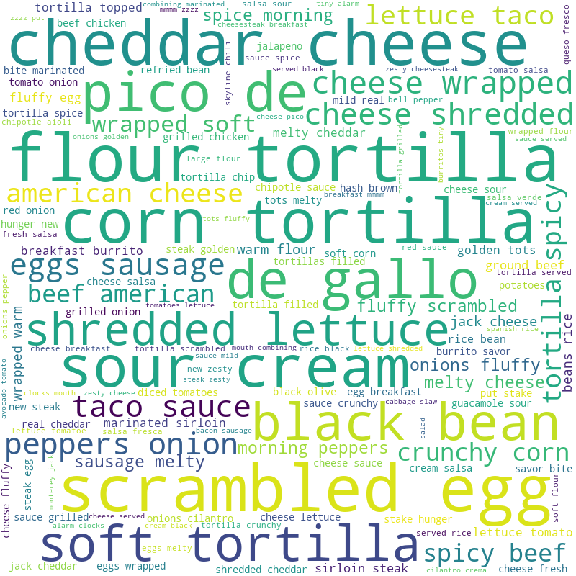
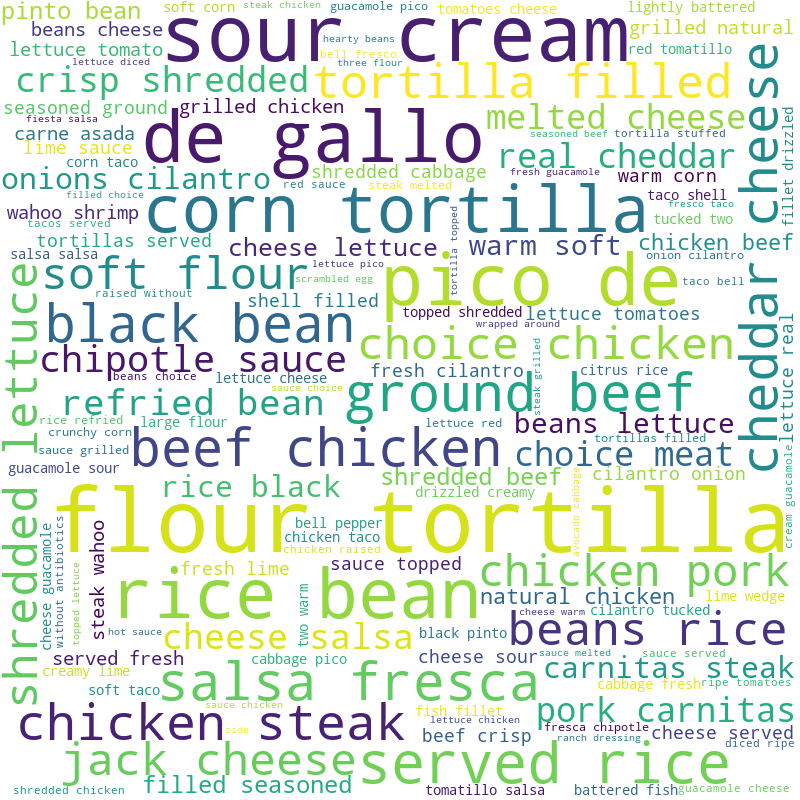
word cloud for Ingredients used in non Mexican restaurants
-
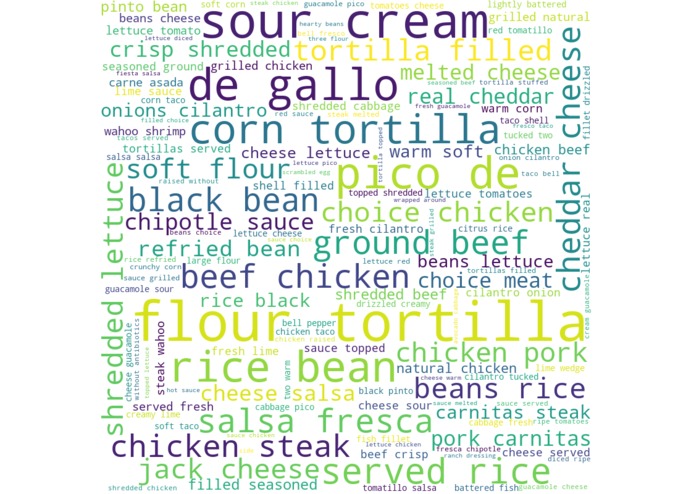
word cloud for Ingredients used in Mexican restaurants
-
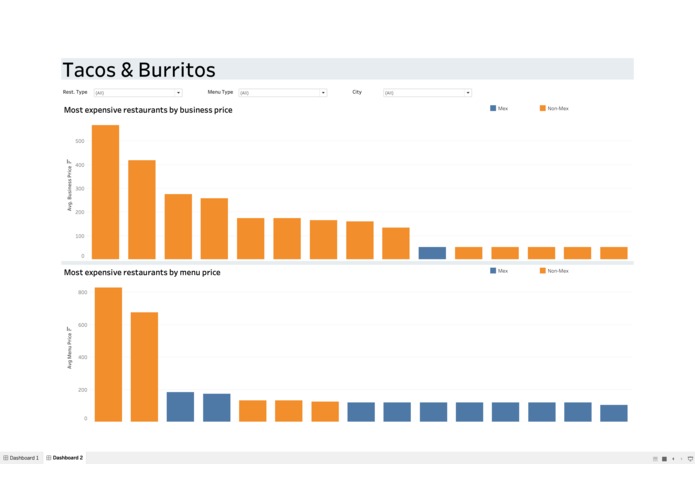
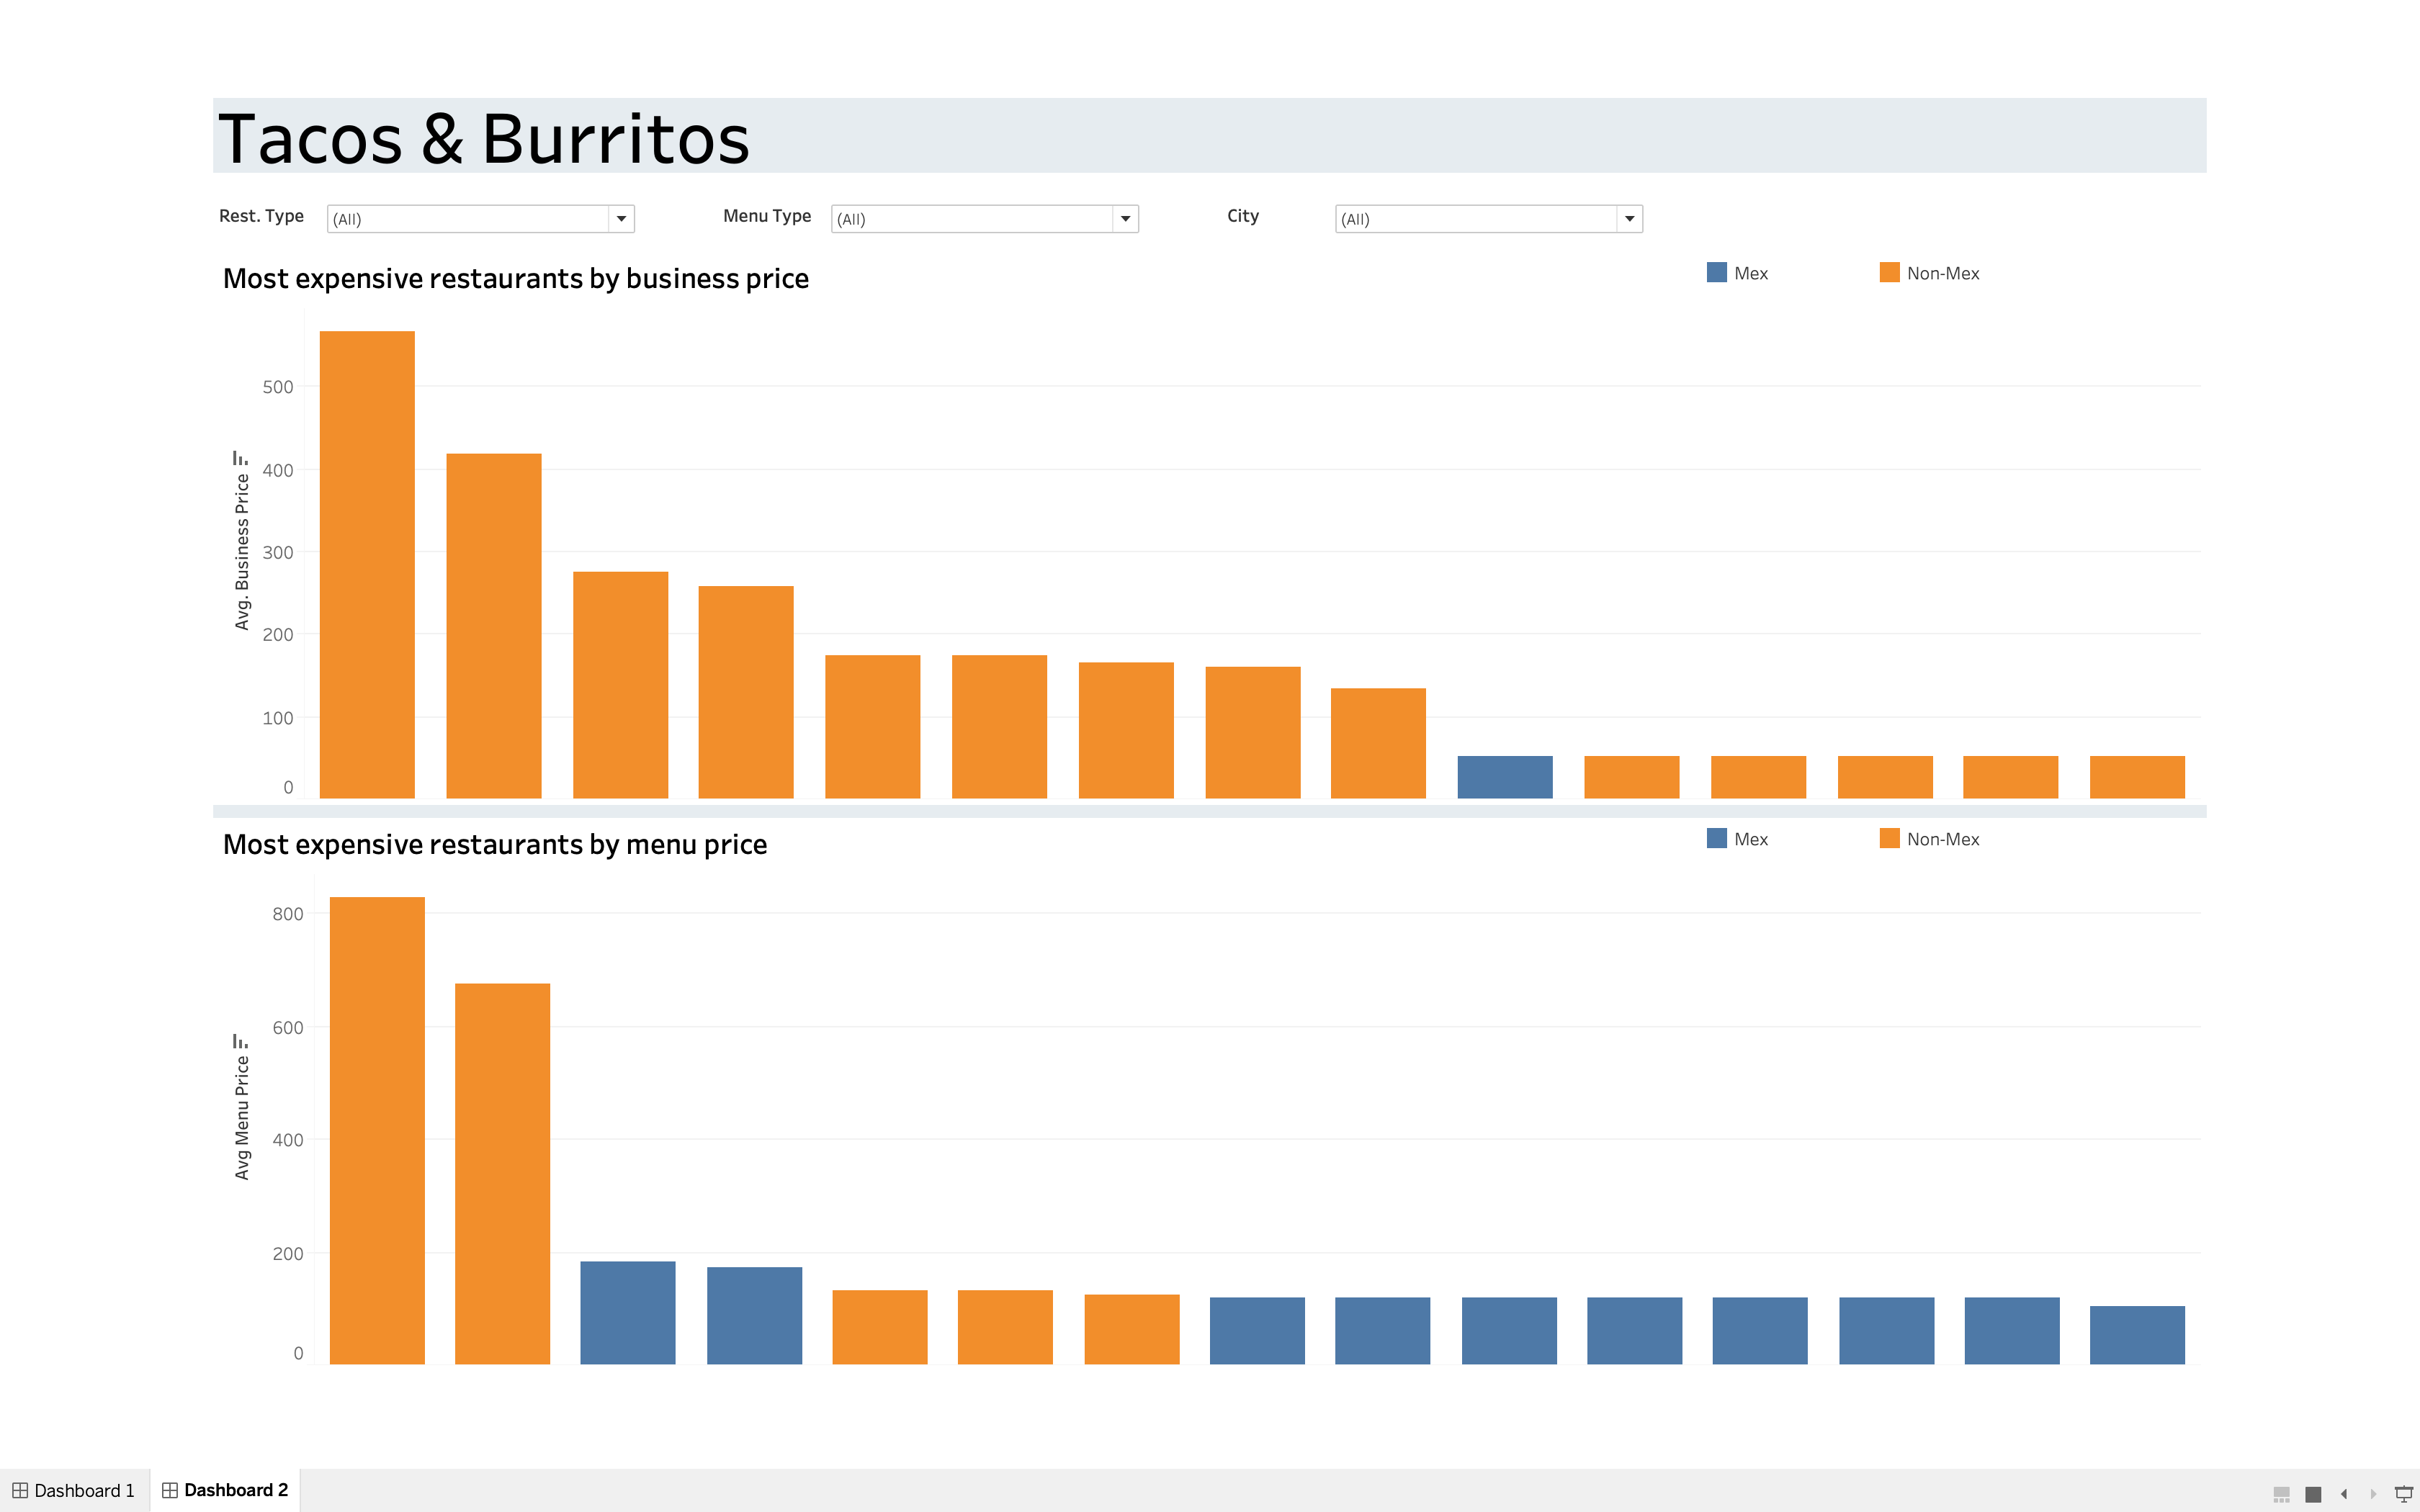
Analyzing price range
Problem Chosen - Goldman Sachs Challenge
Motivation - Having profound interest in data analysis, this challenge was a perfect opportunity for us to put some of our expertise into practical experience and learn about different aspects of data analysis like data cleaning, interpreting and understanding data, deriving insights, and representing them using data visualizations.
Execution Steps Having decided the challenge to tackle, we evaluated the tasks to be performed. Firstly, we investigated the dataset and did a preliminary analysis such as determining the fields and their values, missing values, meaning of the fields and the data. We identified the fields that required data cleaning and performed the relevant tasks using python. Having obtained the cleaned data, we then brainstormed on what insights can be derived out of the data based on the problem statement. We listed down a few questions that we can ask the data and extract the answers for. We used this list of questions to build interactive visualizations using Tableau to represent the data and the insights. We then built a visualization story by organizing the elements in the form of tableau dashboards with the right set of filters. Flexibility to the users has been provided by adding interactivity and filters so that users can draw insights based on their thought process on various combinations of the data elements. Word clouds were also built to get additional insights about the data.
Team Members Prathiksha R Prasad, Monika Daryani, Roline Saldanha, Devi Sandeep


Log in or sign up for Devpost to join the conversation.