Inspiration
For the last twenty years or so, we've experienced the growing trend of globalism. Recently, however, there's been a tide of isolationism and conservatism that's alarming. We wanted to show the wide variety of widely positive economic and civic changes that have happened due to the world becoming more connected.
How we built it
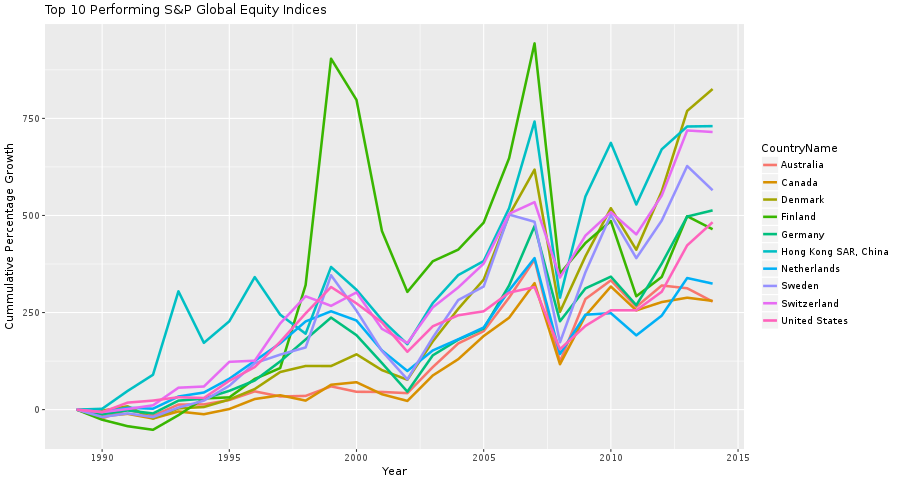
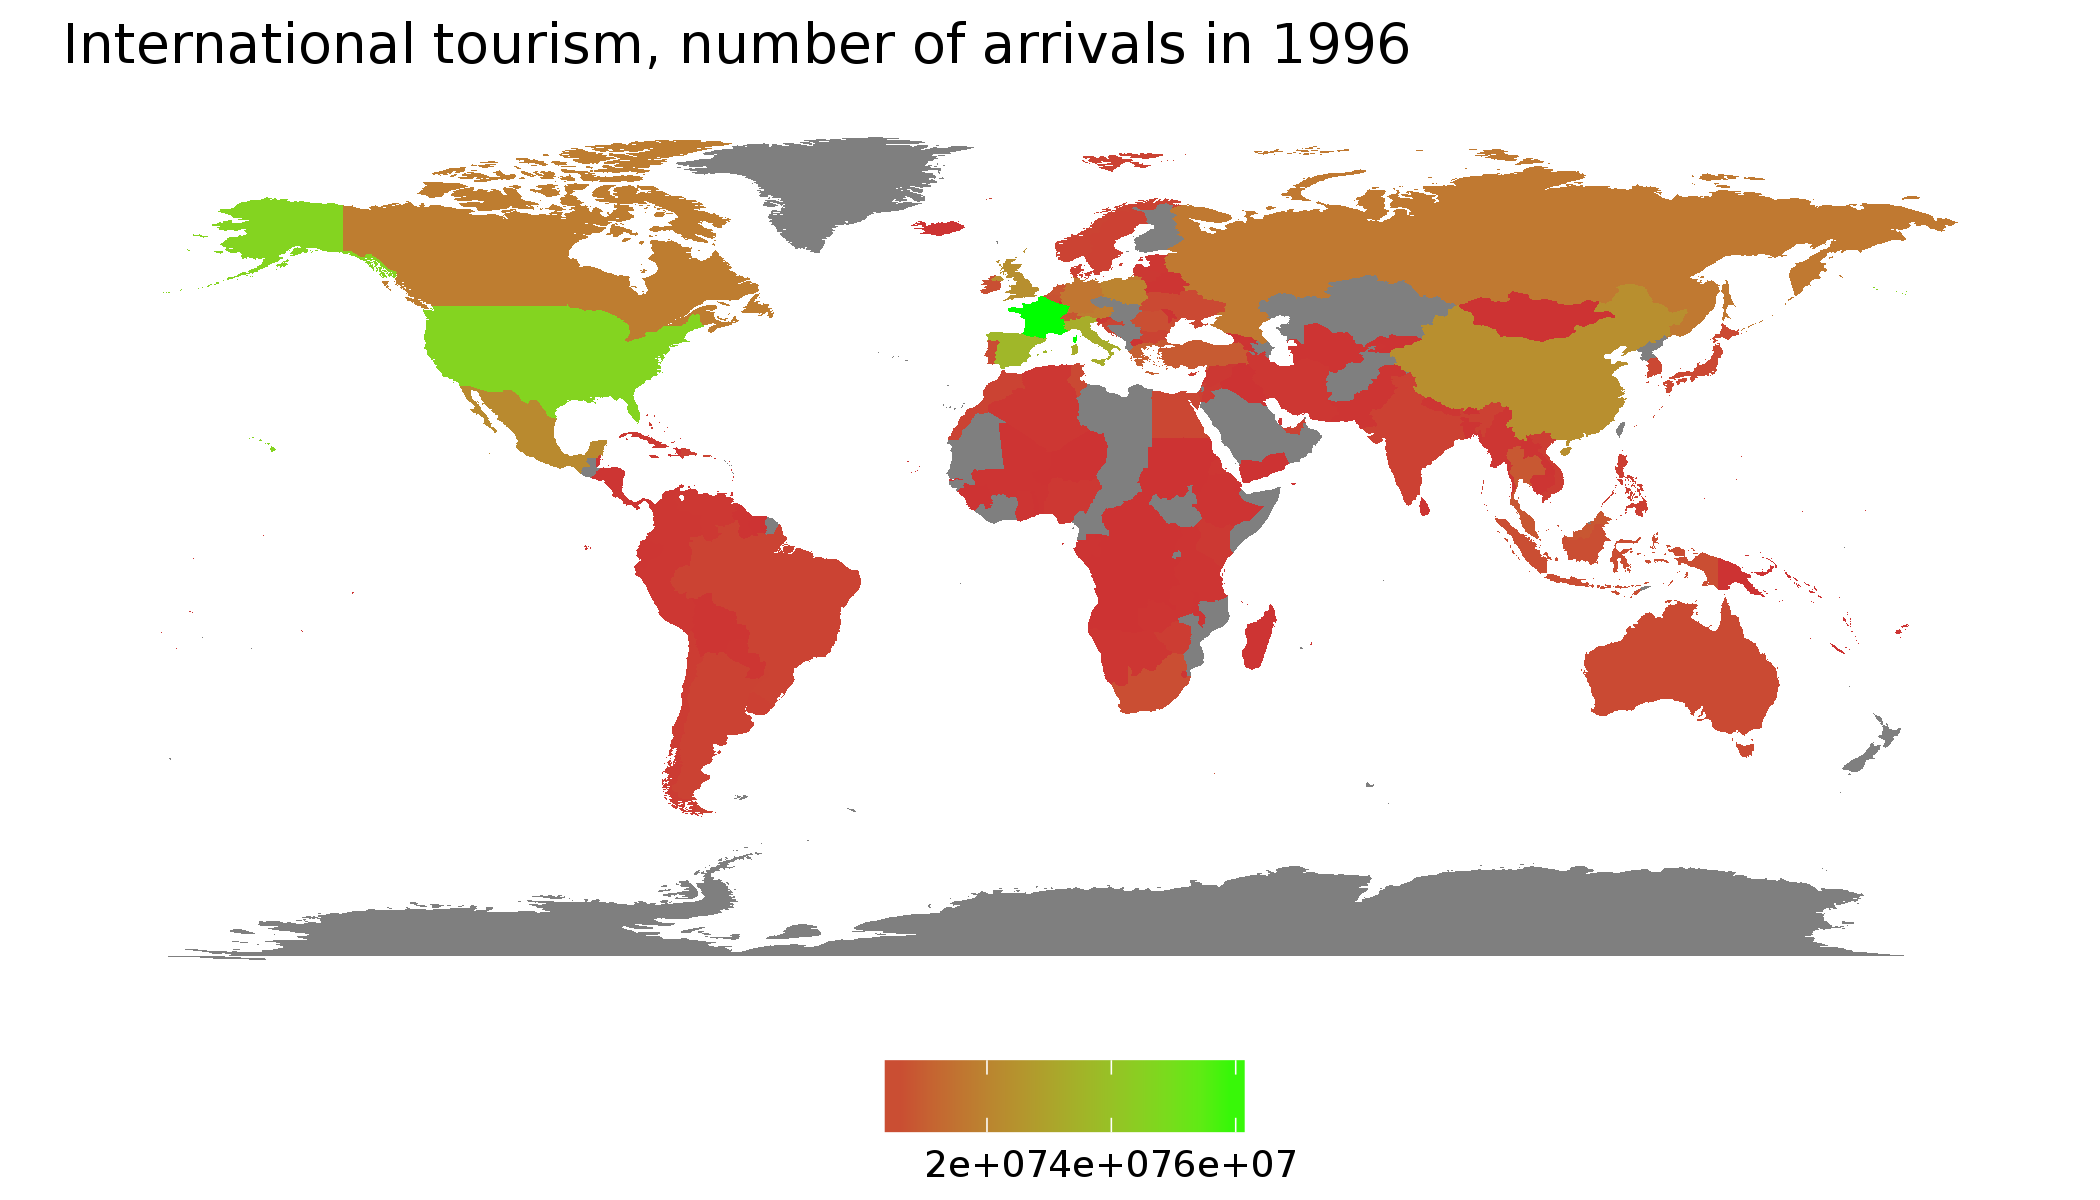
Using R and the World Bank's extensive dataset on global socioeconomic indicators, we were able to create some interesting visualizations.
Accomplishments that we're proud of
Learning R and working with a large dataset has been awesome.
What's next for Data Viz to Understand Globalization and its Impact
There's much more that can be done with this incredible data set - statistical analysis to determine correlation and possibly predicting future trends, as well as mapping out the relationships between countries to see how they've changed over the years.

Log in or sign up for Devpost to join the conversation.